In-app subscription benchmarks for Photo & Video apps

TL;DR:
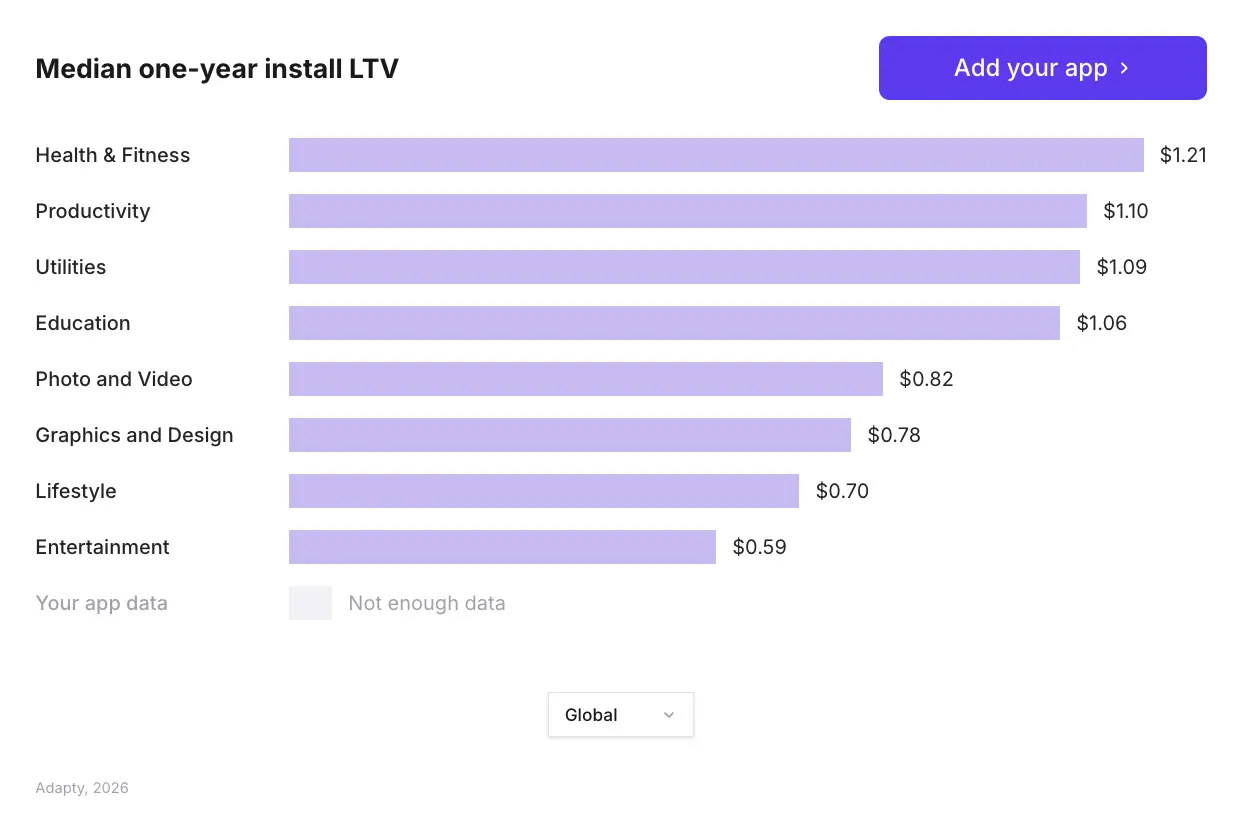
- Photo & Video has a $0.82 median install LTV — below Health & Fitness ($1.21) and Productivity ($1.10), but there's a clear path to outperforming that figure.
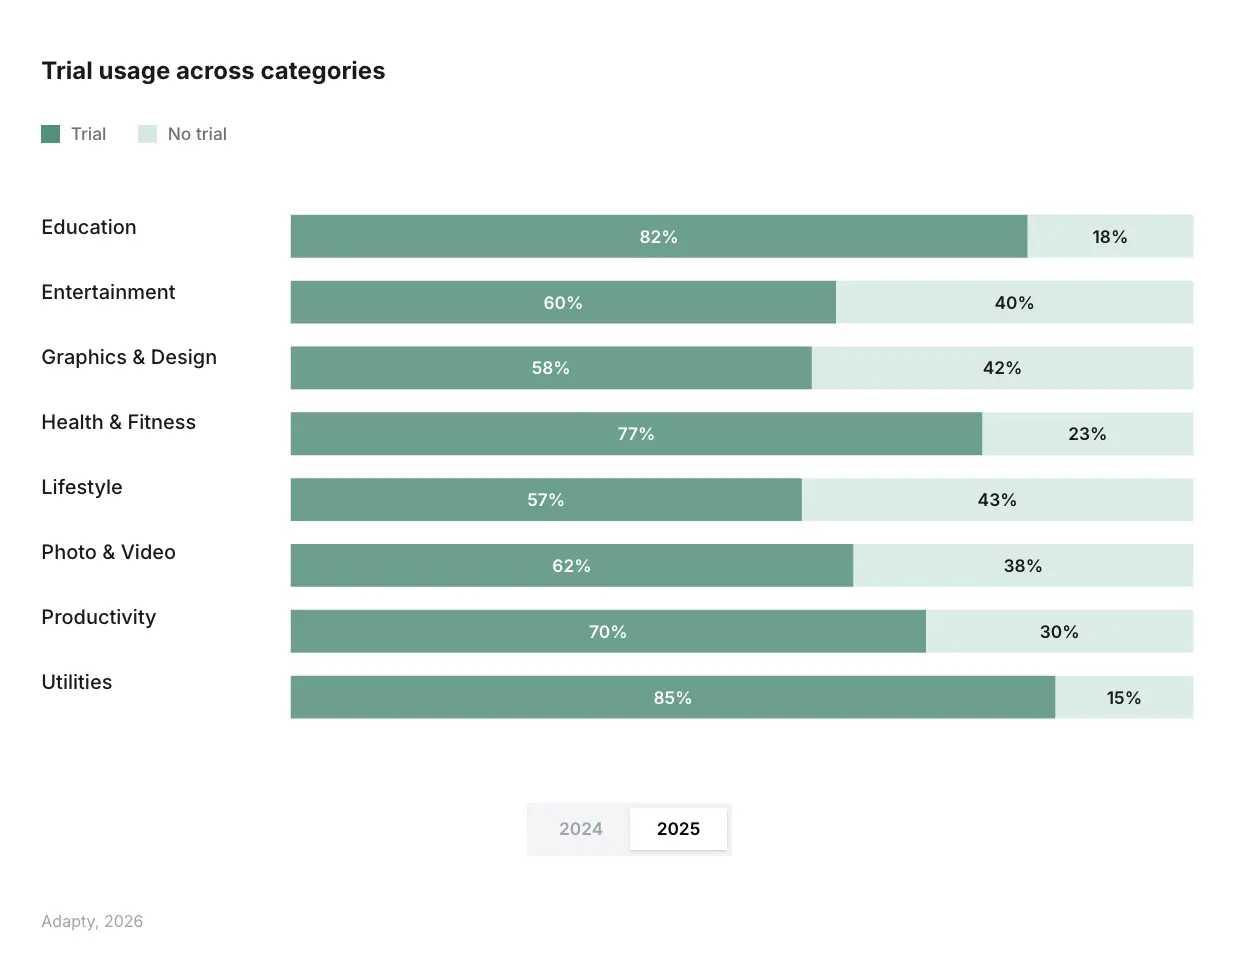
- Trial adoption dropped from 70.7% to 62.3% of apps — the steepest decline of any category. The market is moving away from trials, which opens an opportunity for apps that structure them well.
- Photo & Video leads all categories in trial refund rate at 6.4% globally, spiking to 14.1% in APAC. Refund management is a first-tier monetization problem here.
- Annual LTV in Photo & Video is $42.4 — above the all-category average. Users who commit to annual plans stay.
- Revenue concentration sits at 94.6% for the top 10% — tied with Graphics & Design, and above Health & Fitness (92.6%). There's less room at the top, but the install LTV gap means room to grow.
- The top paywall configuration globally — weekly with a 3-day trial — applies directly here. Photo & Video's refund problem makes trial structure critical, not optional.
Photo & Video is one of the most creative corners of the App Store. It's also one of the most misunderstood places to run a subscription business.
The category has a $0.82 median install LTV — solid, but not at the top of the table. More telling: Photo & Video leads all App Store categories in trial refund rates, at 6.4% globally and 14.1% in APAC. That single figure explains a lot about why the standard subscription playbook — add a free trial, push conversions, optimize the paywall — tends to underperform here.
This article pulls Photo & Video-specific data from Adapty's State of in-app subscriptions 2026 report, which covers $3B in subscription revenue across 16,000+ apps. It covers pricing, LTV, conversion, trial strategy, and paywall setup — filtered to Photo & Video where the data allows. Use it to benchmark your app against the market and find where your assumptions need updating.
Photo & Video is a mid-tier monetizer with a refund problem
Photo & Video lands in the middle of the install LTV table — $0.82 globally, ahead of Graphics & Design ($0.78), Lifestyle ($0.70), and Entertainment ($0.59), but behind the top earners. The gap between Photo & Video and Health & Fitness comes down to user intent at the moment of install.
Someone downloading a fitness app has a defined goal and urgency. Someone downloading a photo editing app may be curious, creative, or just switching tools. The conversion path from install to paid subscriber requires more deliberate design in Photo & Video than in high-intent categories.
North America runs roughly 2x the global install LTV average across most categories. If your Photo & Video app is US-heavy, your benchmarks should sit meaningfully above $0.82.
Trial adoption fell more sharply in Photo & Video than anywhere else
In 2024, 70.7% of Photo & Video apps offered trials. By 2025, that figure dropped to 62.3% — the steepest single-year decline of any category in the SOIS 2026 dataset.
The likely driver: trial refund rates. Photo & Video leads all categories in trial refunds at 6.4% globally. In APAC — where consumer-friendly refund policies in markets like South Korea push rates up — that figure hits 14.1%. For an app generating meaningful subscription revenue, a 14% trial refund rate can erase margin in a single region.
The response from the market has been to pull back from trials altogether. The better response is to structure them differently.
Where trials still work in Photo & Video
Across the full SOIS 2026 dataset, trial users are 8 to 60% better at first renewal than direct buyers, with the biggest gains on weekly plans. The categories where trials add LTV — Utilities, Health & Fitness, Education — share a common mechanic: the core value of the app takes time to demonstrate. A trial gives the user time to build the habit or see the result.
Photo & Video sits in ambiguous territory. A creative tool's value can be immediate (one great edit, one satisfying output) or slow-building (developing skill, establishing workflow). Apps in the latter camp benefit from trials. Apps with immediate-gratification mechanics should think harder about whether a trial adds anything — or just creates a refund window.
The SOIS 2026 conversion funnel benchmarks across all categories:
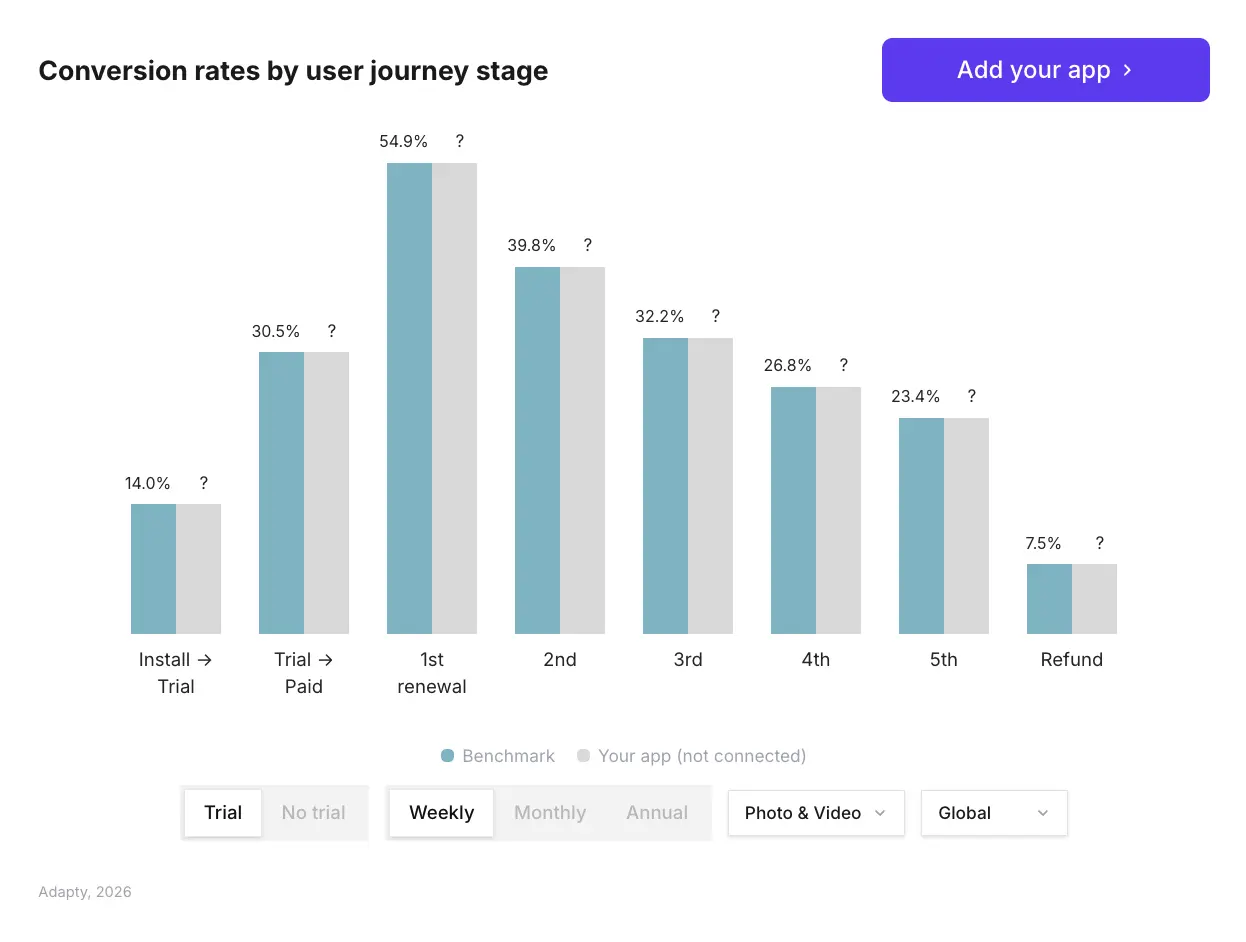
For Photo & Video apps with trial refund rates above the 8.3% global average, the priority is reducing refund exposure before optimizing trial conversion. A well-structured trial that surfaces product value early — and sets expectations clearly before the charge — beats a longer trial that creates more opportunity for buyer's remorse.
Annual plan LTV is strong — and that's the benchmark worth chasing
Annual LTV for Photo & Video is $42.4, above the global category average. The SOIS 2025 data placed it alongside Health & Fitness and Education as a category where users who commit to annual plans tend to stay. That pattern holds in 2026.
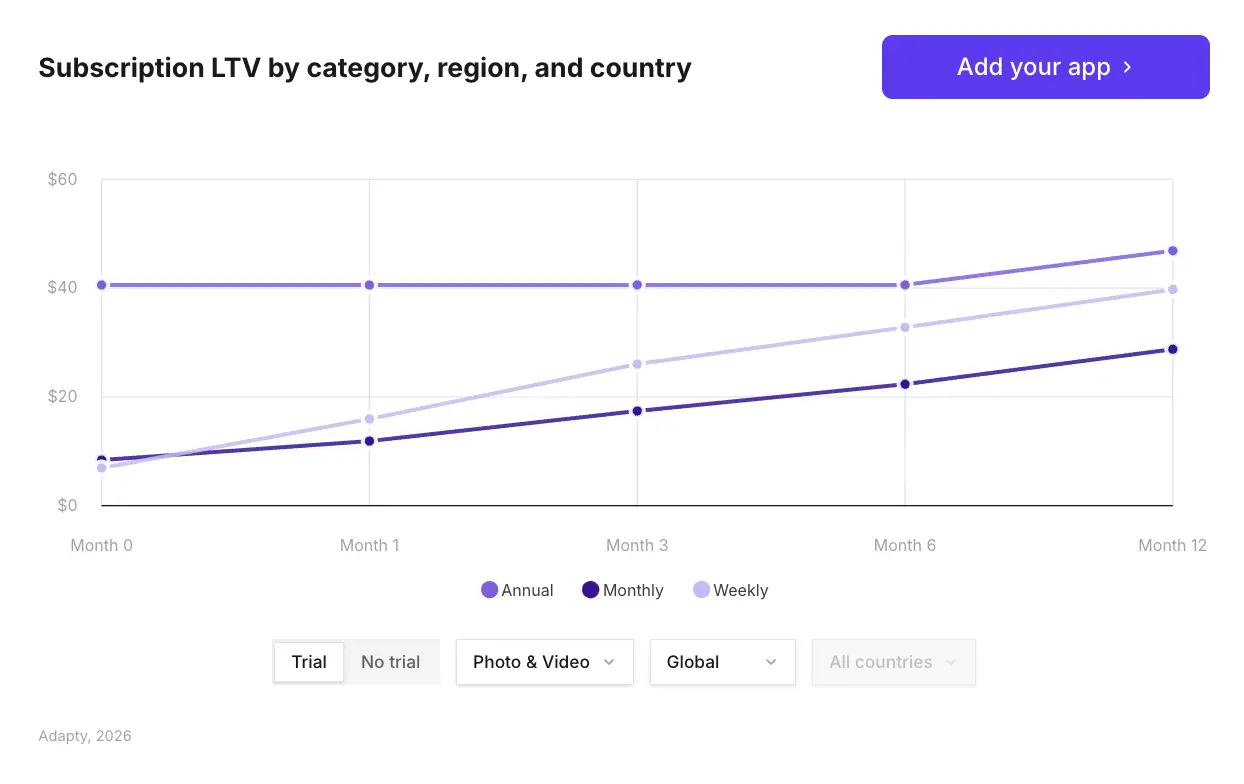
The data points to one thing: your annual cohort is your highest-quality subscribers. Price and position it accordingly.
Across the full dataset, high-priced apps (top 25% by price in their category) earn 3x the LTV of low-priced apps. The effect is consistent: price acts as a quality filter. Users converting at a higher annual price point have already decided the product is worth it. Users converting on a discounted annual plan are making a weaker bet.
What the price buckets mean for Photo & Video
SOIS 2026 divides apps into four price tiers per category: Low (bottom 25%), Lower Mid, Upper Mid, and High (top 25%). LTV compounds as you move up. For weekly plans, the gap between cheap and high-priced apps in APAC specifically is 3.1x — the widest of any region.
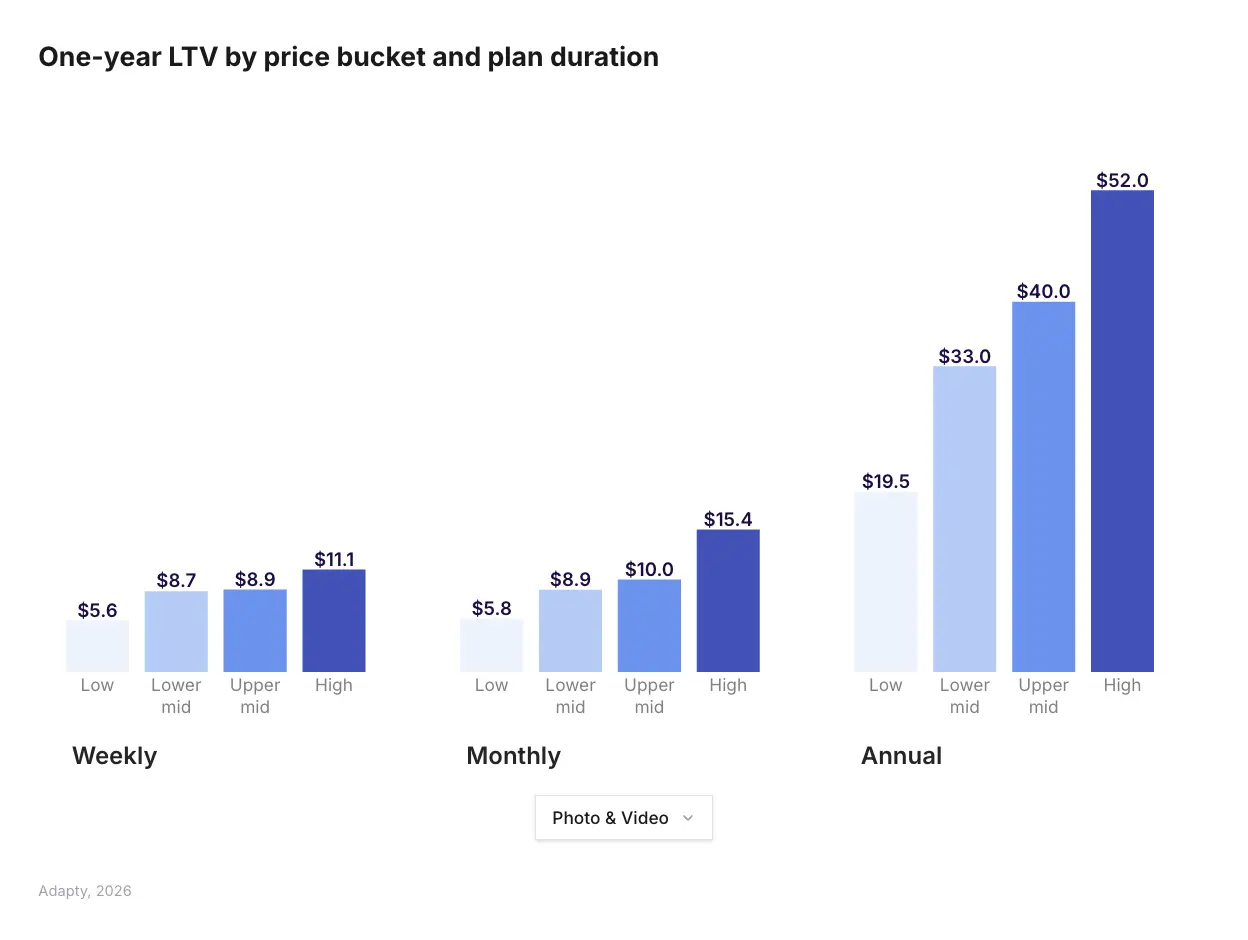
If your Photo & Video app is priced in the bottom half of its niche, the data gives a clear direction: test moving up. The conversion hit is smaller than most assume, and the LTV gain is structural.
Pricing: the regional gap most Photo & Video apps ignore
Global median subscription prices in 2025: $7.48/week, $12.99/month, $38.42/year. Europe overtook North America as the most expensive region — up 18% year over year. European apps now run 29–39% higher than North American ones on annual, monthly, and weekly plans.
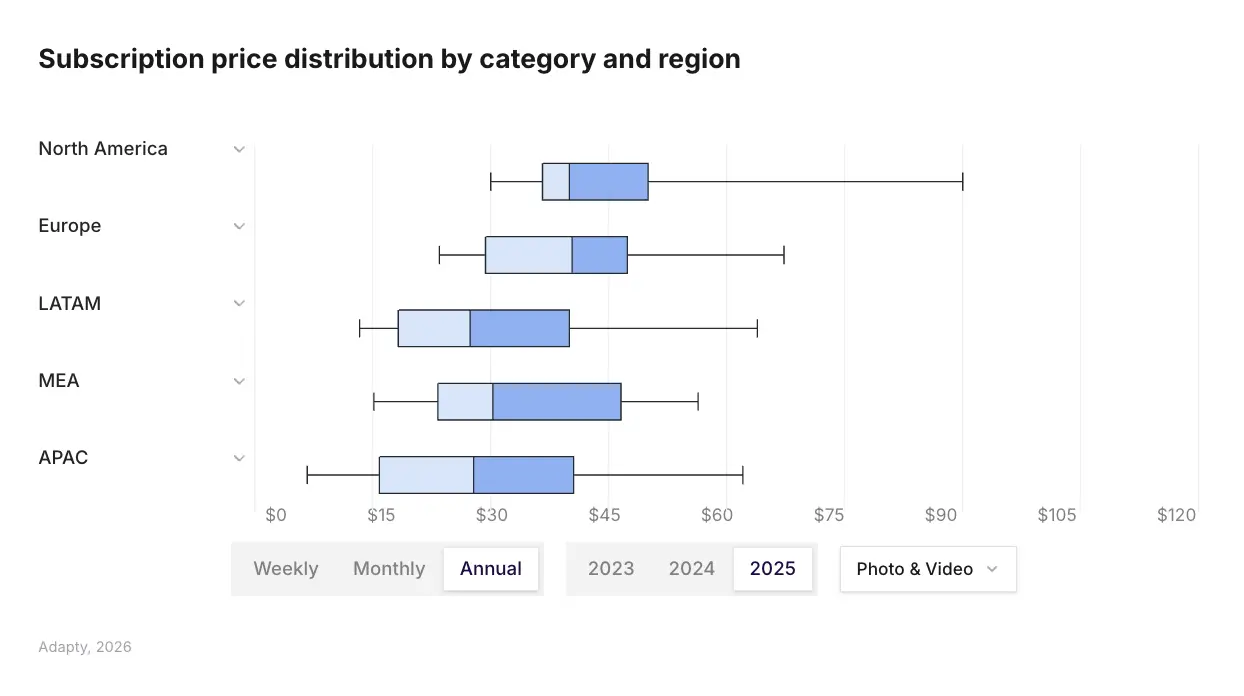
The pricing index shows 4x+ variation across countries for annual plans. Japan leads annual pricing globally. Germany, the UK, and France all index significantly above the US. Turkey, India, and Indonesia sit at the low end.
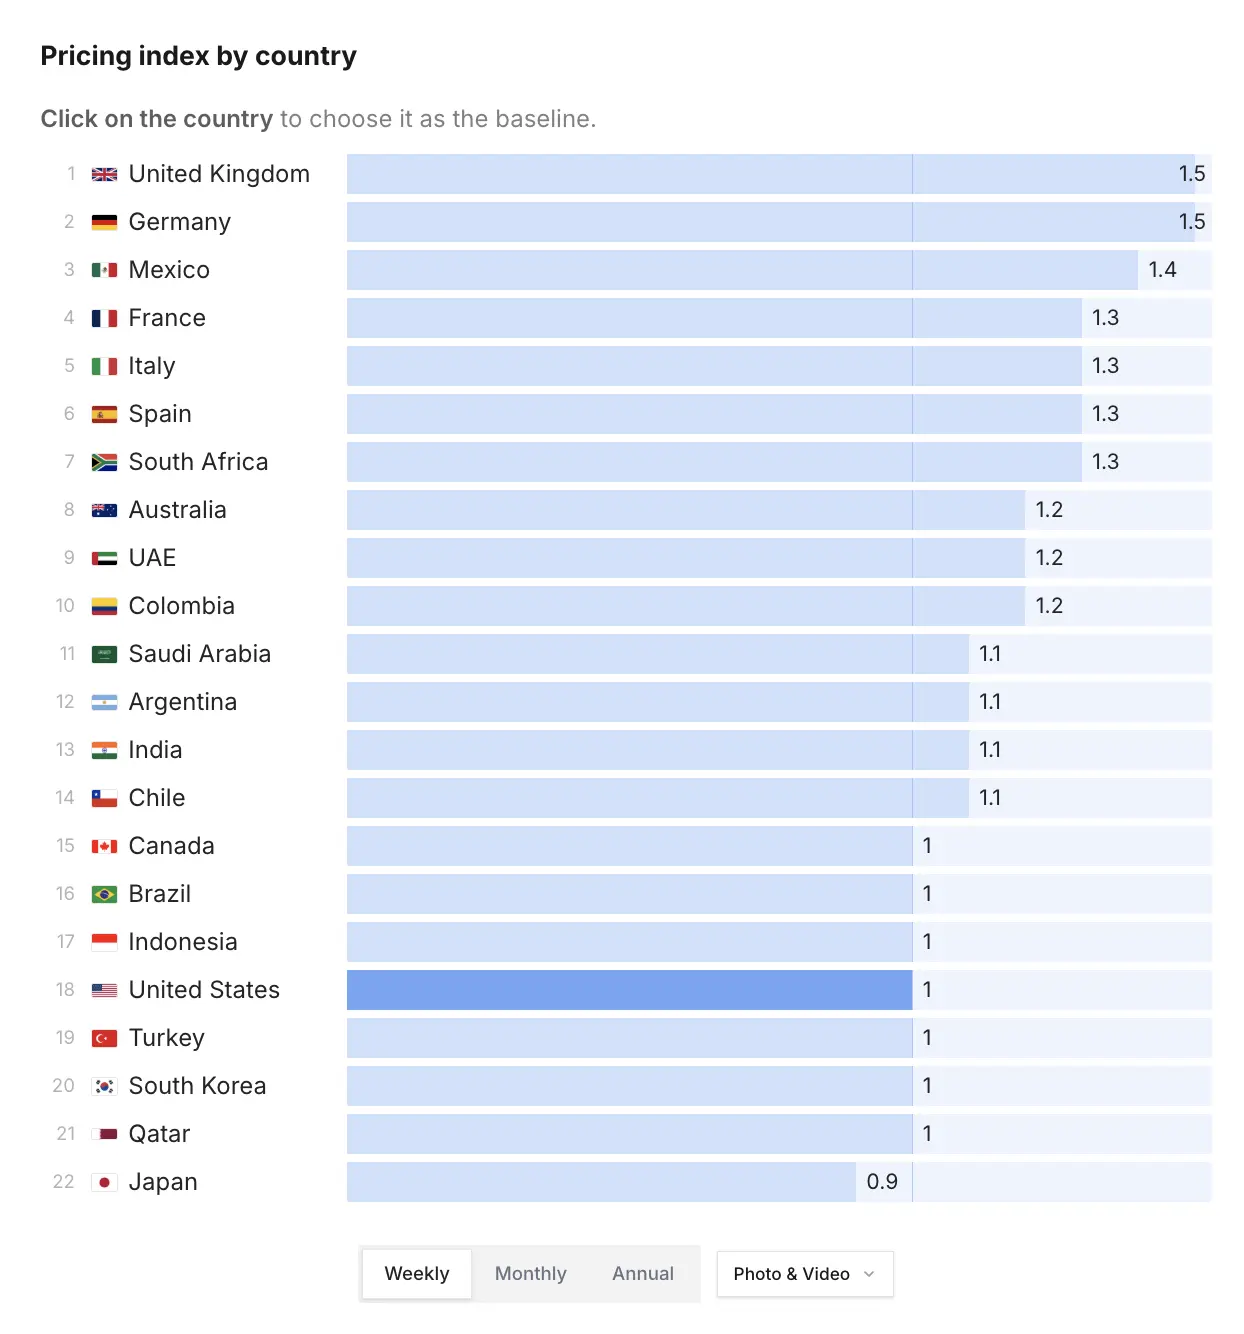
For Photo & Video — a category with strong creative tool usage across developed markets — running a single global price almost certainly means underpricing users in Germany and Switzerland while overpricing users in Turkey and Indonesia. Localization tests have the highest LTV win rate of any experiment type in the dataset: 62.3%. That number makes localized pricing the first thing worth testing.
Discounts: the 90% data point
Nine in ten subscriptions across all app categories sell at full price. Only 14.3% of Education apps use discounts — the highest of any category. Photo & Video follows the broader market pattern: discounts are rare, and full-price subscriptions dominate revenue.
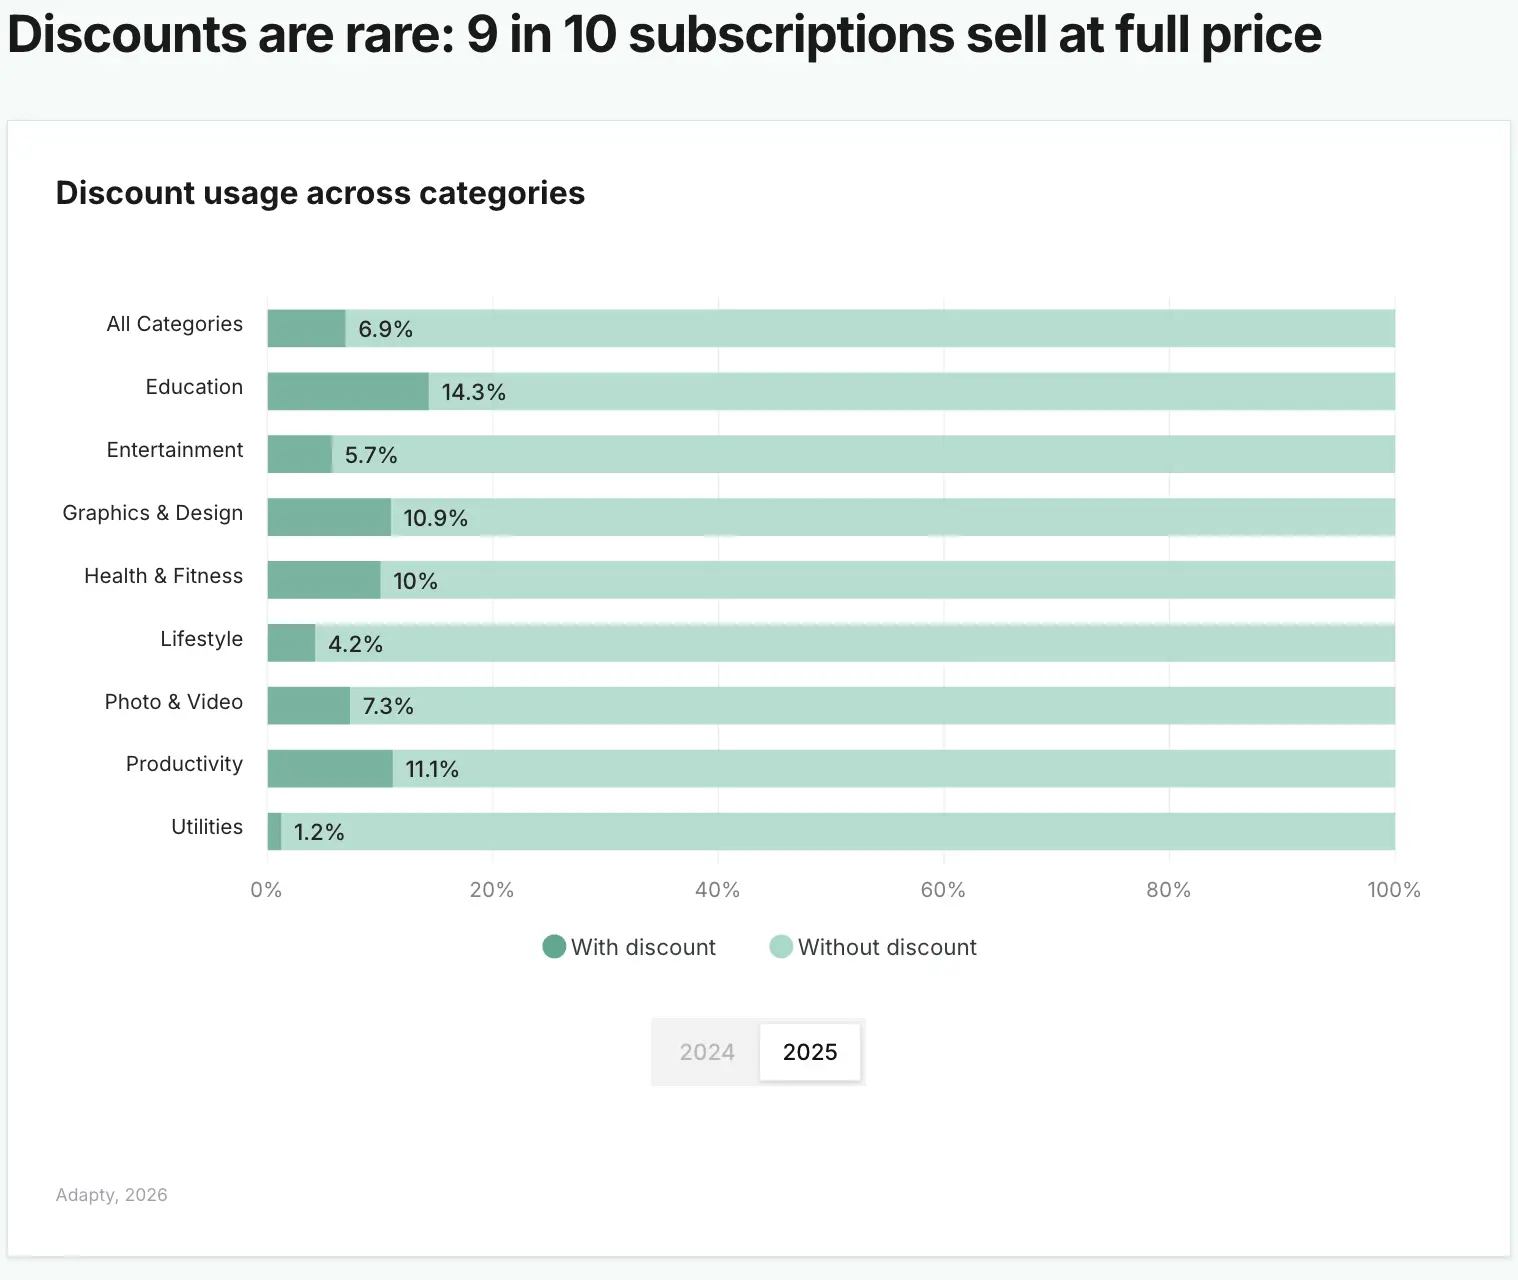
The data doesn't argue that discounts never work. It argues that the default assumption should be full price, and discounts should be reserved for specific moments — cancellation flows, win-back sequences, seasonal campaigns — rather than baked into the standard paywall.
Weekly vs. annual: the plan mix question
Weekly plans now generate 55.6% of all subscription app revenue — up from 43.3% in 2023. That shift is the single most important structural change in subscription monetization over the past two years.
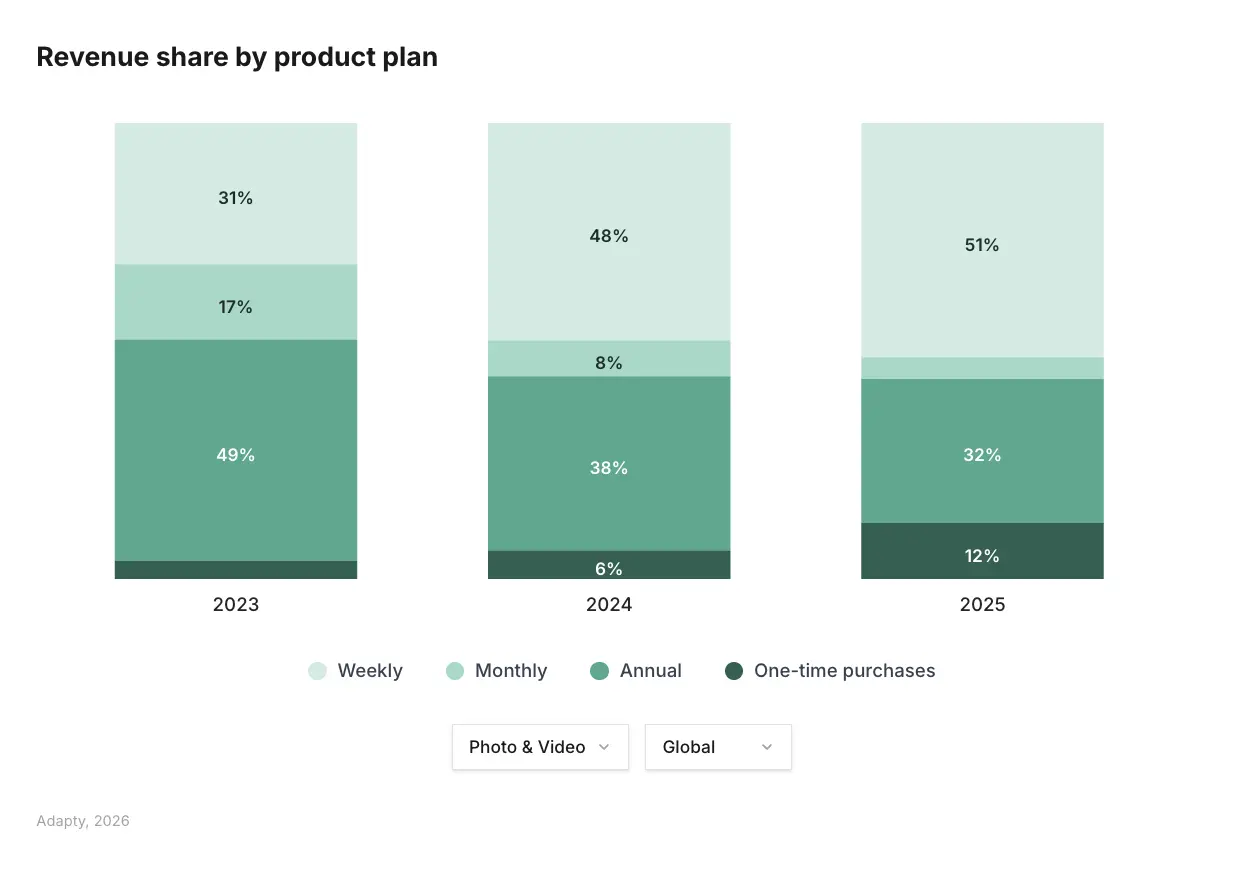
Photo & Video doesn't have Health & Fitness's annual dominance (where annual plans generate 60.6% of category revenue and are growing). Photo & Video likely follows the broader market lean toward weekly — meaning your paywall design should reflect weekly as a primary revenue driver, with annual as the high-LTV secondary offer.
The best-performing paywall configuration in the SOIS 2026 dataset — weekly with a 3-day free trial — generates 1.5x the average LTV of all other setups. For Photo & Video, the trial refund issue makes the structure of that trial critical: 3 days is short enough to limit refund exposure while still giving users time to experience the product.
Conversion timing in Photo & Video
Across all categories, 90% of trial starts happen on Day 0. Users decide in their first session or not at all. Photo & Video follows this pattern — and for a category with a high Day 0 refund problem in APAC, it reinforces the importance of what happens in that first session.
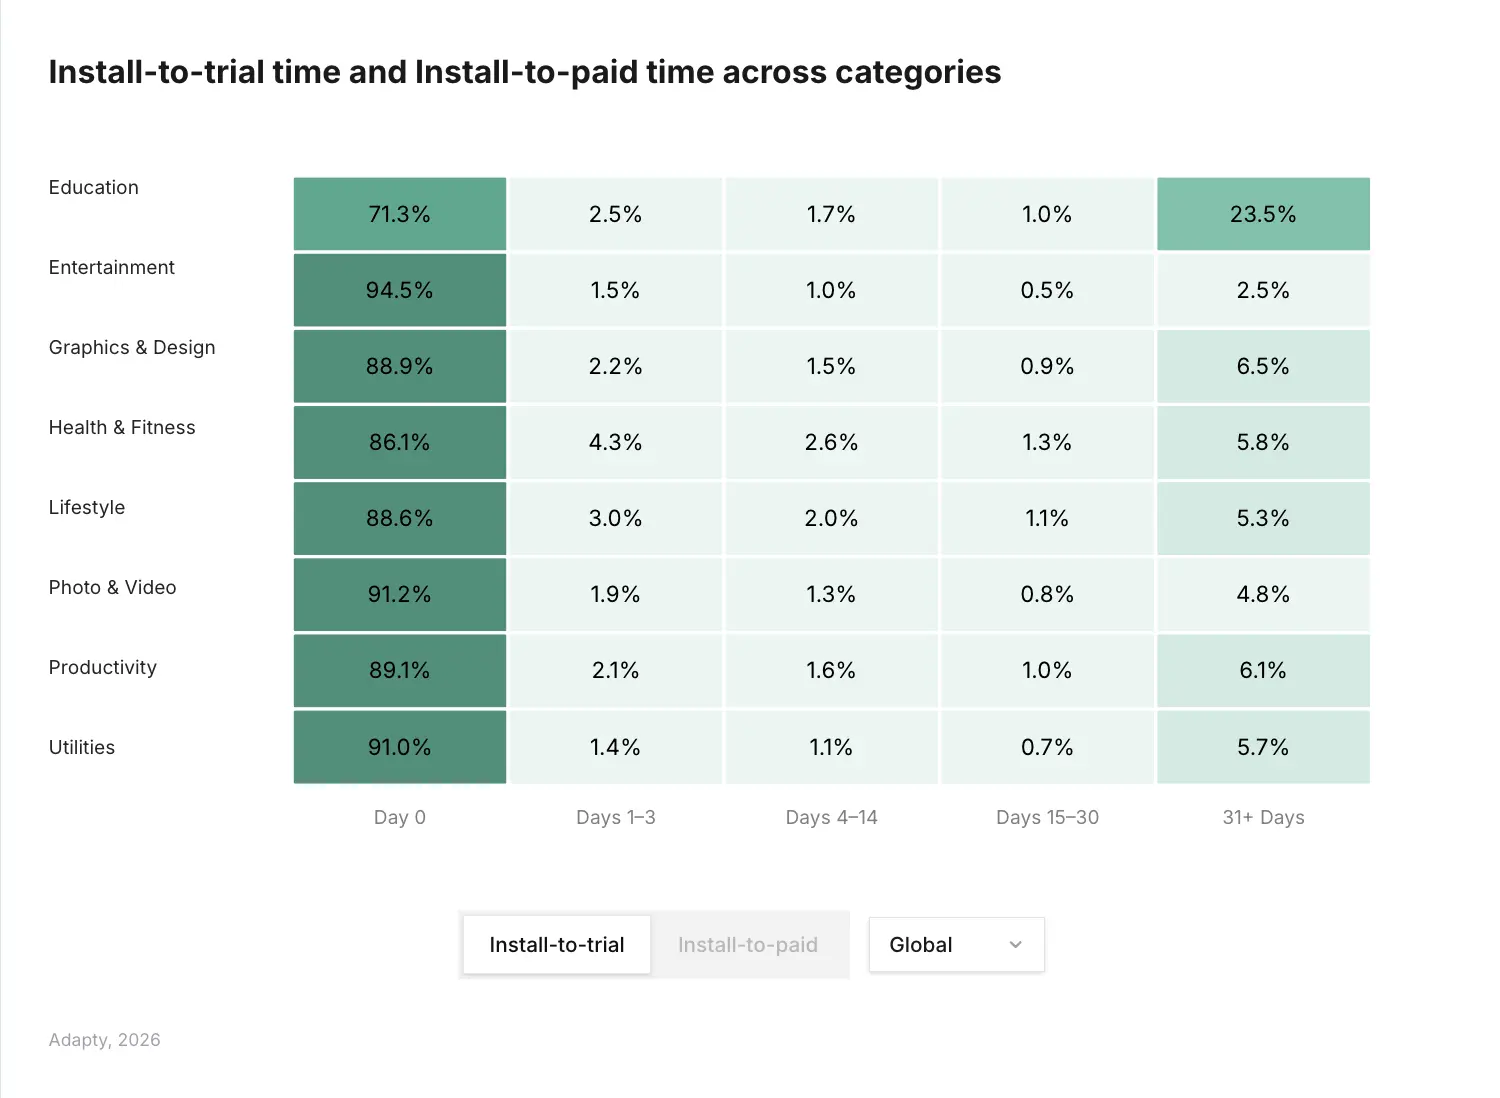
Users who open a photo or video app for the first time either find value immediately or don't come back. Your onboarding flow's job is to make value unmistakable before the paywall appears — not to dump features, but to create a moment where the user sees what the app can do for them specifically.
The SOIS 2026 data shows 44.5% of all purchases happen on Day 0. The remaining 55.5% needed more time. For Photo & Video, the re-engagement path for Day 1–14 users should be tied to something they created or edited in the app — a specific output, not a generic push notification.
Paywall setup: what the experiment data says for Photo & Video
Onboarding paywalls with trials convert best
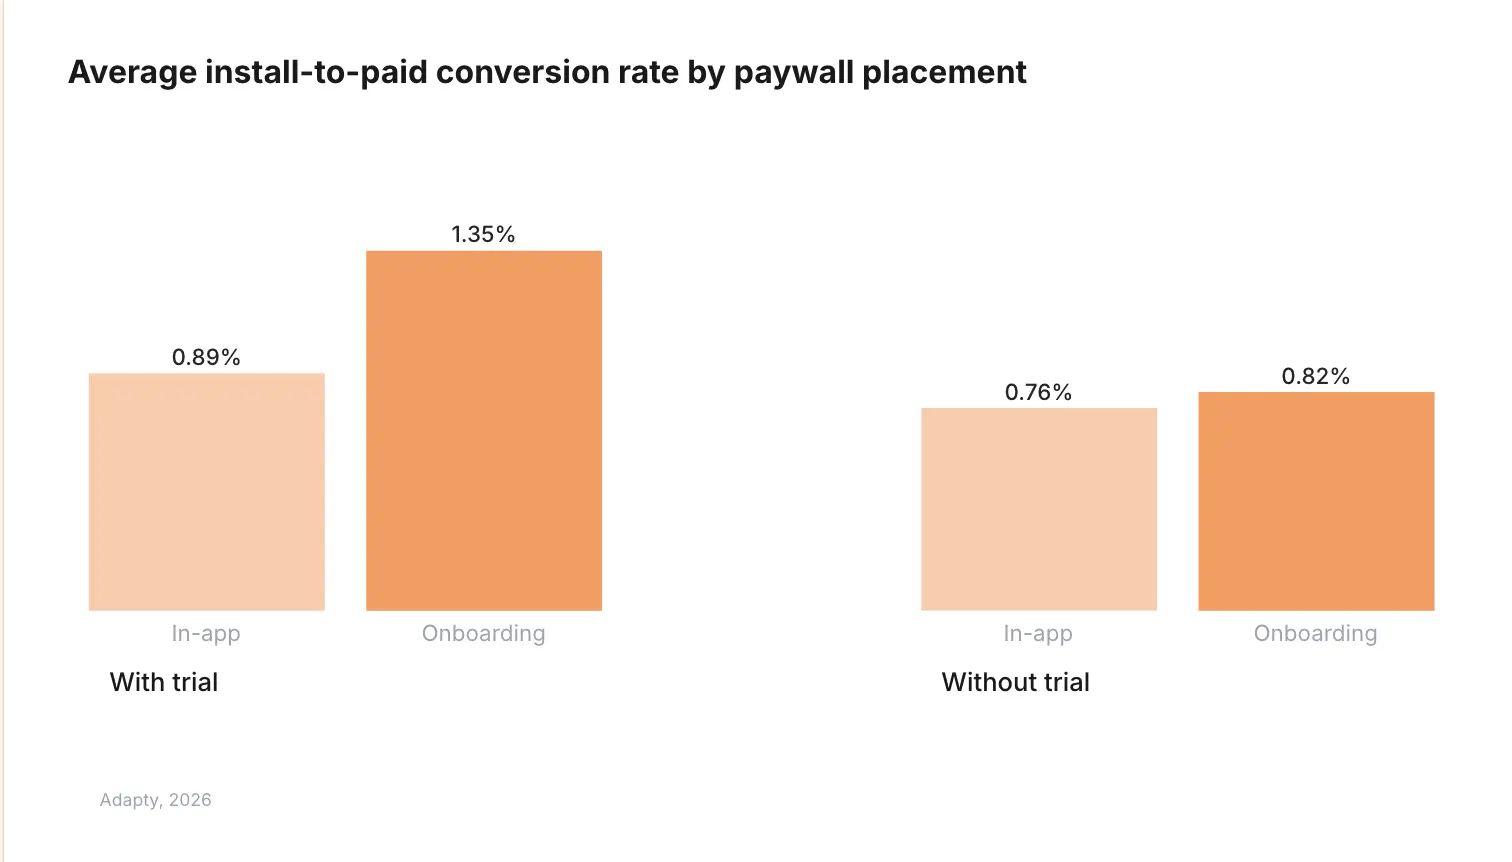
Across all categories, onboarding paywalls with trials convert at 1.78% install-to-paid — the highest of any paywall placement. For Photo & Video, where Day 0 is the primary conversion window, getting paywall placement right in onboarding is the highest-leverage placement decision.
Hard vs. soft paywalls
Hard paywalls produce 21% higher LTV than soft paywalls. Soft paywalls outconvert hard paywalls by nearly 50% on raw conversion rate. The trade-off is selection: hard paywalls filter uncommitted users and attract subscribers who spend 20–33% more than the median.
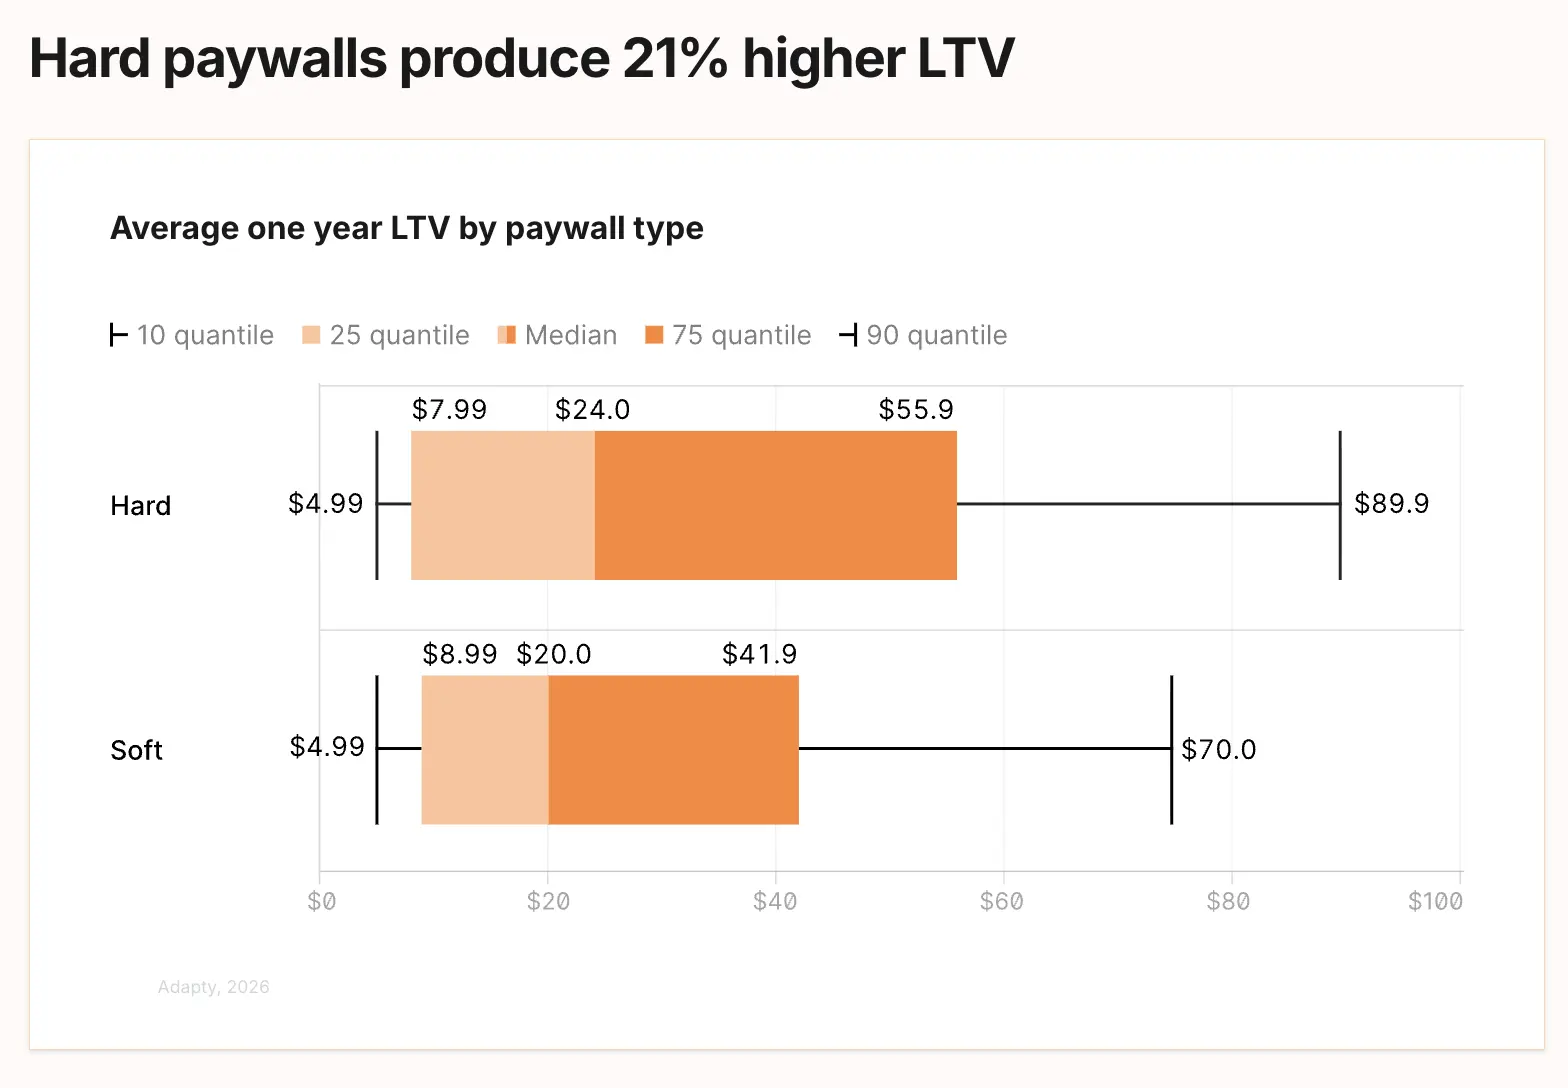
For Photo & Video apps with a strong hook — editing quality, filter uniqueness, output sharing — a hard paywall with a short trial is worth testing. The refund issue in APAC specifically argues for a hard paywall over a soft one: giving users unlimited free access creates no urgency and increases the likelihood of trial-then-refund behavior.
What experiments move LTV
| Experiment Type | % Tests with LTV Uplift | % Tests with CR Uplift |
| Localization | 62.3% | 44.9% |
| Number of Plans | 57.1% | 46.1% |
| Plan Duration | 58.7% | 37.8% |
| Trial Changes | 59.6% | 39.9% |
| Price Changes | 45.5% | 28.3% |
| Visual / Copy Only | 34.6% | 31.4% |
Visual and copy tests have the lowest win rate in the dataset. For Photo & Video teams running paywall experiments, the priority order is clear: localization first, then trial structure, then plan duration. If you're testing headline copy and color schemes while your trial refund rate is above 6%, you're testing the wrong things.
Where Photo & Video sits in the broader market
Revenue concentration
The top 10% of Photo & Video apps capture 94.6% of all category revenue — tied with Graphics & Design, above Health & Fitness (92.6%) and Entertainment (94.0%), but below Lifestyle (97.9%) and Education (96.0%).
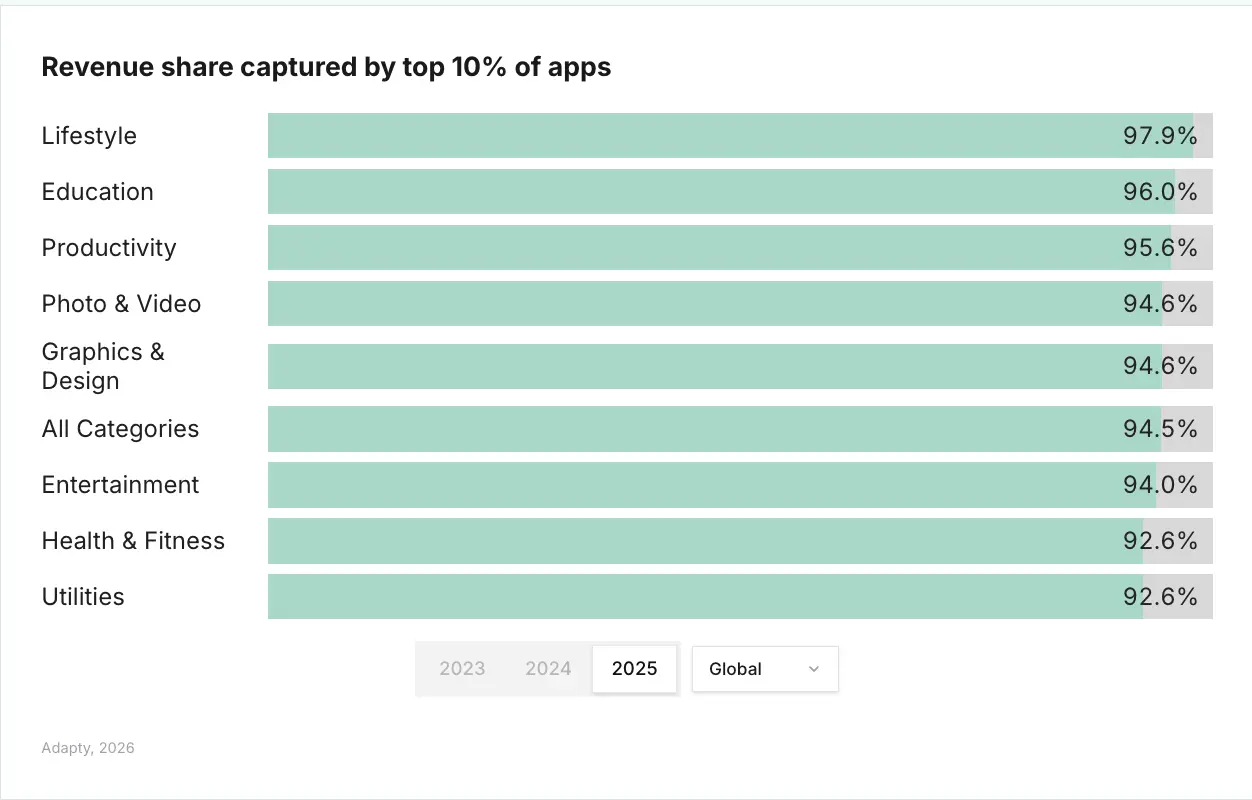
The concentration figure is high but not exceptional. The practical takeaway: Photo & Video is competitive but not structurally dominated the way Lifestyle is. There's still meaningful revenue in the long tail. Apps that differentiate on output quality, workflow, or a specific creative niche have a real path to building sustainable revenue outside the top 10%.
The new app problem
31% more subscription apps were launched in 2025 than in 2024. Median monthly revenue per new app dropped 22%. Newer apps earn roughly 25% less at the median than apps from a few years ago.
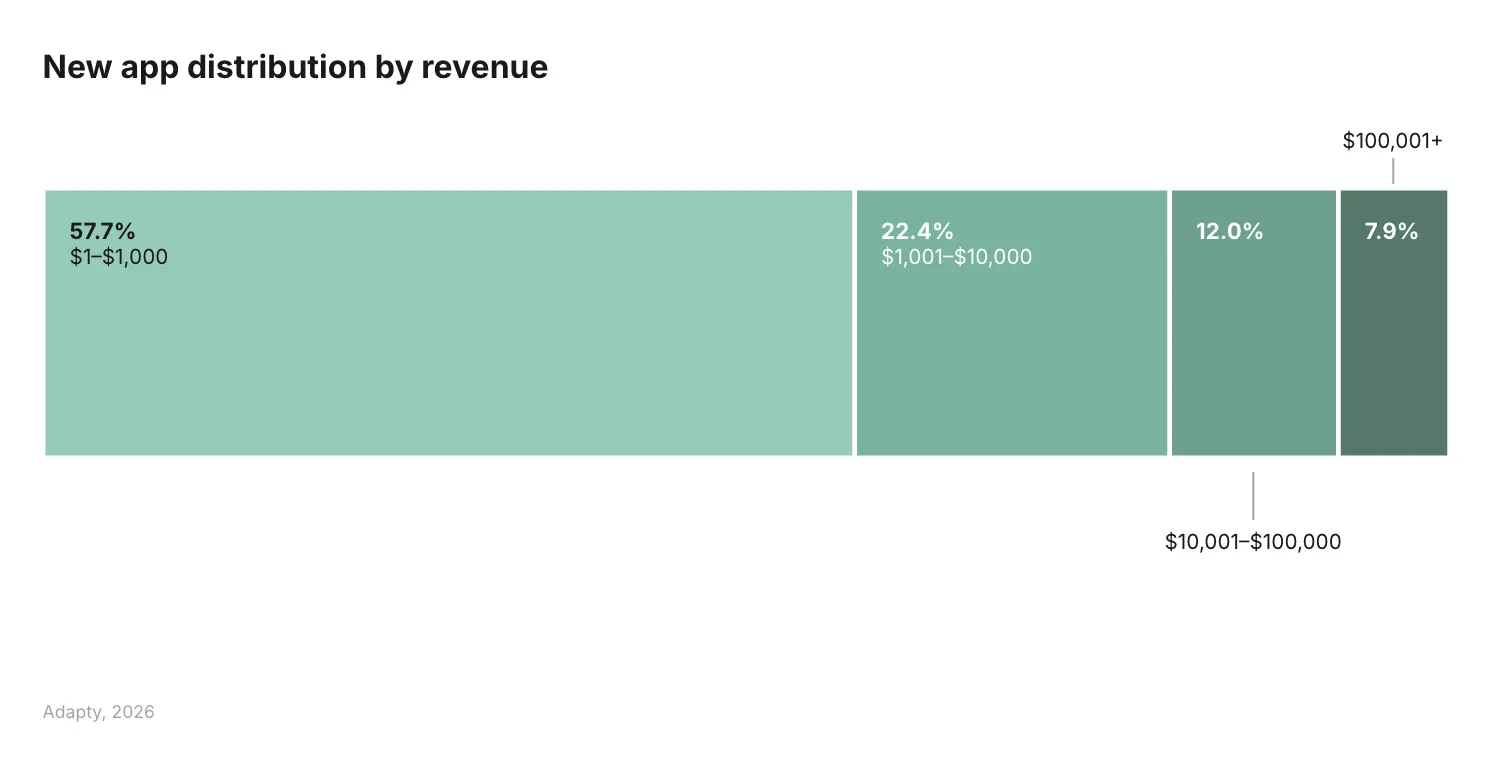
Photo & Video is an attractive category for new entrants — AI-powered editing tools, one-tap filter apps, and video tools have all seen rapid launches. More competition and lower average revenue per new app mean that monetization fundamentals matter more now. Getting pricing, trial structure, and paywall placement right isn't optimization. At this stage of market development, it's table stakes.
iOS vs. Android in Photo & Video
iOS drives 85% of subscription revenue across all categories. Android weekly LTV is 18% lower than iOS. iOS converts 3x better than Android on average, with the gap widest on annual plans (3.6x better on iOS).
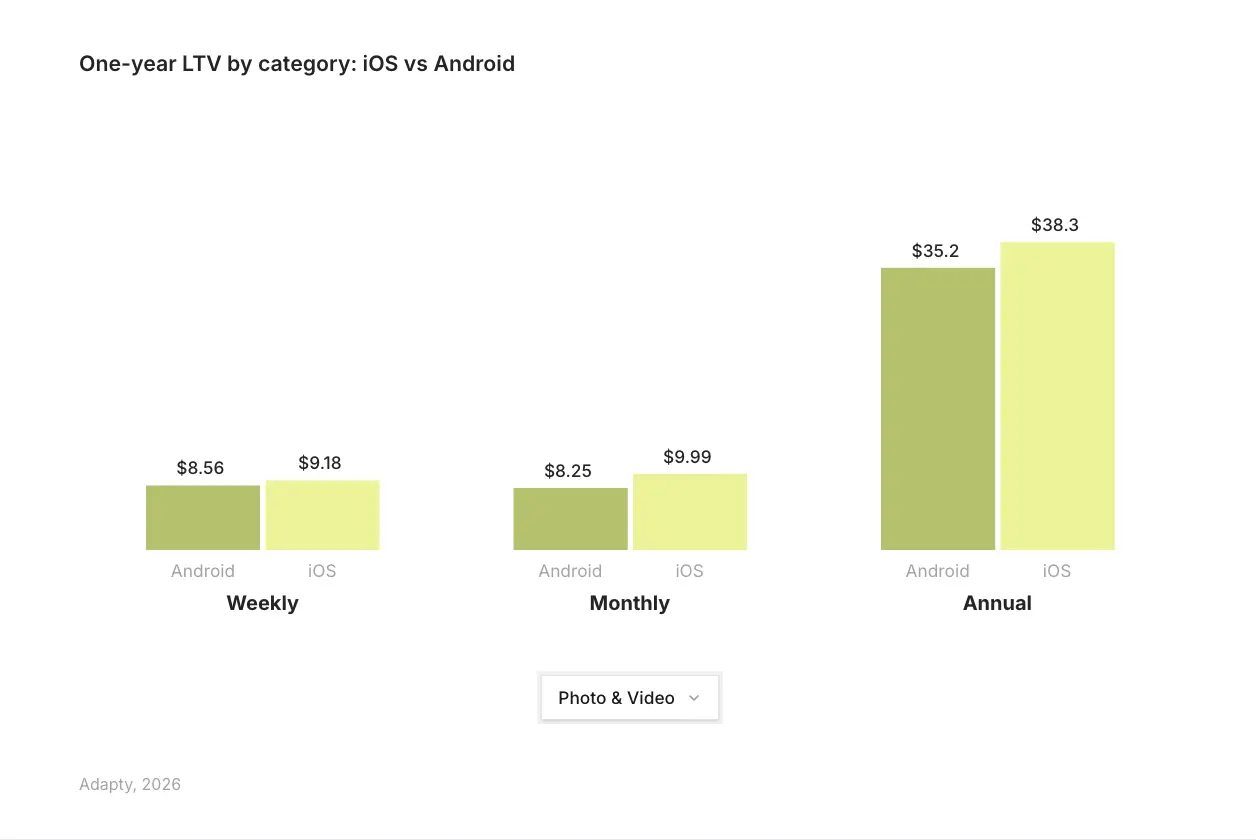
Photo & Video and Lifestyle have been flagged in the SOIS 2026 data as categories where Android's monetization trajectory is improving. If your Photo & Video app runs on both platforms, the standard playbook applies: weekly plans lower the conversion barrier on Android, location-specific pricing matters more for Android users in emerging markets, and hard paywalls are worth testing on Android specifically.
Applying the benchmarks: where to focus
On refunds — prioritize this first
- If your trial refund rate is above 6% globally or above 10% in APAC, fix this before running conversion experiments. Use Adapty's Refund Saver or a structured cancellation flow to intercept refund requests before they hit the store.
- Shorten trial length in high-refund markets. A 3-day trial gives users enough time to experience the product without a long window for buyer's remorse.
- Set expectations at trial start. Users who are surprised by a charge are the ones who refund. Make the billing date and amount visible at the moment of trial opt-in.
On pricing
- Localization has the highest LTV win rate of any experiment type (62.3%). Test country-specific pricing before any other paywall change. The Adapty Pricing Index gives you the reference data to set starting points.
- If you're in the bottom half of prices in your Photo & Video niche, test moving up. High-priced apps earn 3x the LTV of low-priced ones across the full dataset.
- Stop defaulting to discounts. Nine in ten subscriptions in the market sell at full price.
On trial strategy
- If you offer trials, structure them around a specific output. Photo & Video's trial value depends on the user doing something with the app — not just opening it. A trial that ends with the user having created something is more likely to convert than one that ends with them still exploring.
- Test trial length before testing anything else. Trial structure experiments have a 59.6% LTV win rate — higher than price changes, visual updates, or copy tests.
- Consider whether trials make sense for your specific app. If your core value is immediate (a one-tap transformation, a fast output), a hard paywall with no trial may outperform a trial model on LTV.
On plan structure
- Weekly should be your primary revenue engine, consistent with the market. Annual is your highest-LTV cohort — price it accordingly and give it prominent placement on the paywall.
- Test plan duration as an experiment. 58.7% of plan duration tests produce LTV uplift. If you've never tested monthly vs. annual vs. weekly as the default offer, start there.
On paywall and experiments
- Place your paywall in onboarding with a trial. Onboarding paywalls with trials convert at 1.78% — the highest of any placement configuration.
- Run experiments. Teams that test consistently earn up to 40x more revenue than those that don't. The average is 14.7 experiments per active tester. One paywall test per quarter isn't enough.
- Stop starting with visual tests. Localization, trial structure, and plan duration have 2x the LTV win rate of design and copy changes.
Get your benchmarks
The full interactive report is filterable by category, region, and plan type. Find out where you're ahead, where you're behind, and what the top performers are doing differently.