We looked at who finishes the onboarding, how long flows run, what top apps put in them, and what the handoff to the paywall earns in trials and revenue.
of users who open an onboarding finish it eventually (median app)
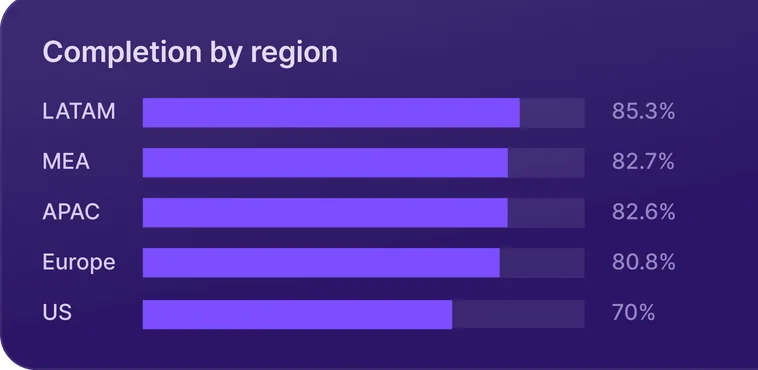
of onboarding opens in the US reach the last screen, the fewest of any region
apps save what users tell them during the onboarding
screens in the median onboarding

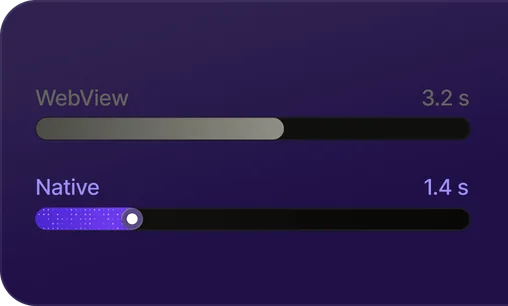
A typical onboarding takes 14 seconds to complete. That’s the time you get to show a new user they picked the right app.
Those seconds decide more than any screen that comes later. Users who finish the onboarding start trials at 14 times the rate of users who skip. The first screen alone loses 10.2% of sessions, five times more than any screen after it.
Many apps already ask users why they came. Half of the top apps personalize the onboarding. Few use the answers when they ask for money: 9% of paywalls mentioned the user’s name, goal or target date.
State of Onboarding 2026 follows new users from the first screen to the first payment, across 5 regions and 7 categories. Use it to find where your flow loses people and what to test first.
From first screen to subscription
We follow users from the first onboarding screen to a paid subscription and look at how much each onboarding open earns.
9 in 10 users finish the onboarding. Most still don’t pay
- Nine in ten users finish the onboarding. That counts users who leave and come back later. The big drop comes after, between the paywall and the purchase.
- Finishing the onboarding unlocks the paywall. 94.7% of users who finish see a paywall within a day, against 1.2% of those who leave early.
- Paying subscribers are a small slice. The median app turns 1.75% of onboarding users into paying subscribers within 30 days.
Share of onboarding users reaching each step, median app
Each step is its own median across apps. Trial and paid within 30 days of the first open; trial step uses apps that offer trials.
Entertainment earns $0.98 per open. Utilities earns $0.24
- An onboarding open is worth real money. The median app earns $0.37 in gross revenue for every user who opens its onboarding.
- US users finish less but pay more. The US earns $0.56 per open, more than twice APAC and MEA, even though US users are the least likely to finish the onboarding (2.1). They convert 2.06% of opens into paid subscriptions, against 0.79–1.30% in other regions.
- High completion doesn’t mean high revenue. Entertainment ($0.98) and Productivity ($0.56) earn the most per open. Utilities, the category with the highest completion, earns the least ($0.24).
Gross revenue per onboarding open, median app
Completion & conversion
We look at how many users finish the onboarding, how many of them pay, where they drop off and how long a flow takes. We break completion down by region, category and country.
US users are the least likely to finish the onboarding
- Most opens end in a finished onboarding. The median onboarding is completed in 79.4% of opens.
- The US trails every other region. US users complete 70.0% of opens, 11–15 points below every other region. That’s the reverse of State of paywalls, where the US converted best.
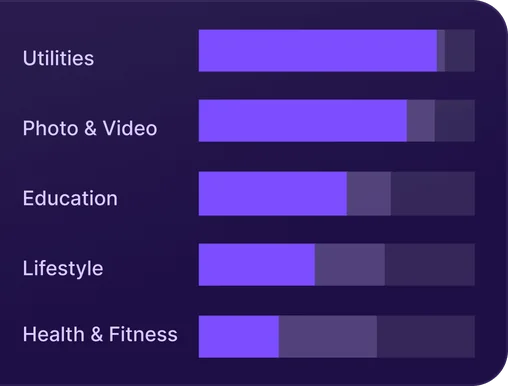
- Long-flow categories lose the most users. Utilities lead at 89.8% and Health & Fitness trails at 65.1%.
Completion rate, median app
The US completes least and converts most
- Low completion doesn’t hold the US back. US users finish the onboarding least often (70.0% of opens, 2.1) but convert the most: 2.06% of opens become paid subscriptions, about twice the rate in Europe (1.04%) and APAC (1.02%).
- Health & Fitness and Entertainment sell the most. They turn 2.38% of opens into paid subscriptions, almost three times as many as Utilities (0.87%).
- Categories that finish least sell most. Health & Fitness completes the fewest opens (65.1%) and sells the most; Utilities completes the most (89.8%) and sells the least. The ranking is close to the reverse of completion (2.1).
New paid subscriptions per onboarding open, median app
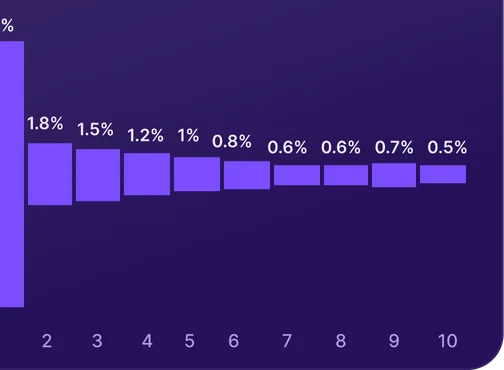
10.2% of sessions end on the very first screen
- The first screen loses the most users. 10.2% of onboarding sessions end there, five times more than on any later screen.
- Drop-off flattens after the opening. From screen 3 on, each screen loses 1.5% or less, and users who get past the opening mostly finish.
- The first screen is the ad’s handoff. If it doesn’t confirm what the creative promised, users leave before the onboarding has started.
Share of users lost on each screen, median app
Share of onboarding sessions that end on each screen; for 11–20, the average per screen.
Long onboarding flows take 12x longer, not just more screens
- Most onboarding flows take seconds. The median onboarding takes 14 seconds to complete.
- Long flows take minutes. Flows with 21+ screens take almost three minutes (172 s).
- Long flows hold users longer per screen. Users spend about 2 s per screen in short flows and about 5.5 s in long ones, where many screens are questions.
Median seconds to complete, by onboarding length
Hungary finishes 31 points more often than Switzerland
- Completion varies widely by country. The median completion rate ranges from 59.8% in Switzerland to 90.9% in Hungary.
- Wealthy and English-speaking markets finish least: Switzerland, Ireland, Denmark, Finland, the US (70.0%), Australia (72.5%) and the UK (76.1%). Latin America and Southeast Asia finish most, at around 90%.
- Completion and value run in opposite directions: Australia earns $1.23 per open and the UK $0.87, while Brazil completes 86.4% and earns $0.26.
Completion rate by country, median app
What this means for your app: Completion & conversion
Benchmark against your category
Completion depends on category more than region. Compare your rate with your category, not the overall median.
Track paid conversion next to completion
Categories with the lowest completion sell the most. High completion on its own doesn’t bring more revenue.
Fix the first screen first
Most drop-off happens on screen 1. Make it confirm what the ad promised.
Read country numbers in context
Low completion in a rich market can still bring the most revenue. The US is the clearest case.
Onboarding length
We count how many screens apps put in their onboarding and compare short and long flows on completion, conversion and revenue.
Health & Fitness flows run 3x longer than Utilities
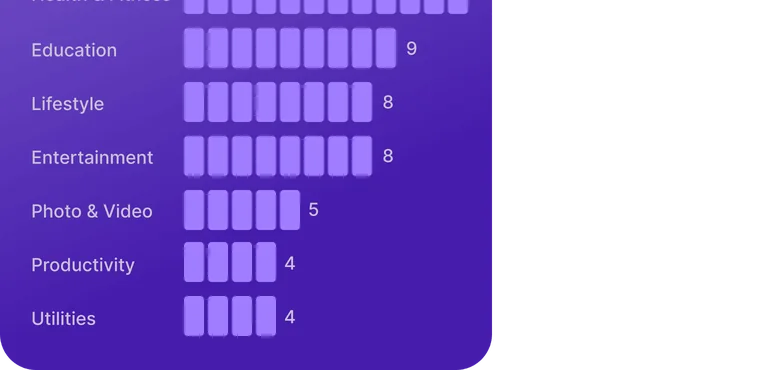
- Most flows are short. The median onboarding has 5 screens. One in four runs 9 or more, and one in ten runs 20 or more.
- Health & Fitness and Education lead on length. Health & Fitness (12) and Education (9) run two to three times longer than Utilities and Productivity (4).
- A personal plan needs questions first. The long categories are the ones that sell a personal plan (Chapter 4).
Screens in the onboarding, median app
Every extra screen costs completion
- Long flows finish far less often. Completion is 89.7% for 1–5 screens and 62.8% for 21+.
- Short and long flows lose users differently. Short flows lose them on the first screen; long flows lose them in the middle, where up to 19.3% leave.
- Users near the end stay for the paywall. Almost nobody leaves on the second-to-last screen: under 1% in every bucket.
Completion by onboarding length, median app
Separate medians; they don’t add up.
Longer flows start fewer trials but sell more subscriptions
- Short flows start the most trials. Trial starts per open fall from 4.95% in 1–5 screen flows to 2.1–2.8% in flows of 11+ screens.
- Paid subscriptions per open move the other way: 1.20% for 1–5 screens, 2.33% for 21+.
- Length doesn’t stop apps from selling. Long flows are mostly Health & Fitness and Education, which sell differently, so this isn’t causal.
Conversion per onboarding open, median app
Apps that offer trials.
Direct purchases plus trial conversions.
The longest onboarding flows earn 4x more per open
- Revenue per open climbs at the top end. A 21+ screen onboarding earns $1.39 per open, about four times as much as a 1–5 screen flow ($0.36).
- Each subscriber is worth more too: $49 after a 21+ screen flow vs. $28 after a short one. Health & Fitness, which runs the longest flows, also sells the most annual plans (5.5).
- Length alone doesn’t pay. Between 1 and 20 screens, revenue per open stays at $0.33–0.48; the gain comes with the long, quiz-led flows of Health & Fitness and Education. Not causal.
Gross revenue by onboarding length, median app
What this means for your app: Onboarding length
Let the product set the length
Apps that build a personal plan run longer flows. If your product doesn’t adapt to the user, keep it short.
Check every question in a long flow
Long flows lose users mid-flow. Keep the questions you use later and cut the rest.
Judge length by revenue per open
Long flows complete less often but earn more per open, so compare revenue per open.
Test length in your own app
Category medians can’t pick the right length for you. Test a shorter and a longer flow and compare revenue.
Onboarding design
We use  ScreensDesign’s library of the top 50 US apps in each category to see how many personalize the onboarding, which screens they include and where the paywall sits. This chapter describes design patterns, not their impact on conversion.
The eight screens top apps add to their onboarding
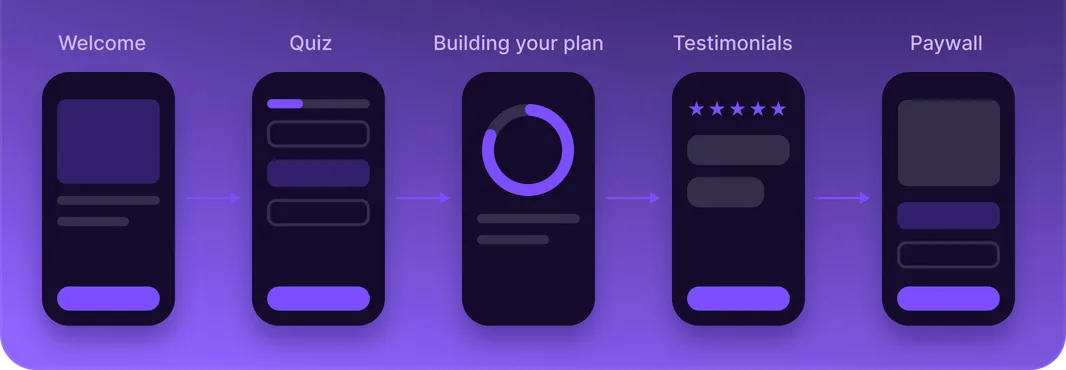
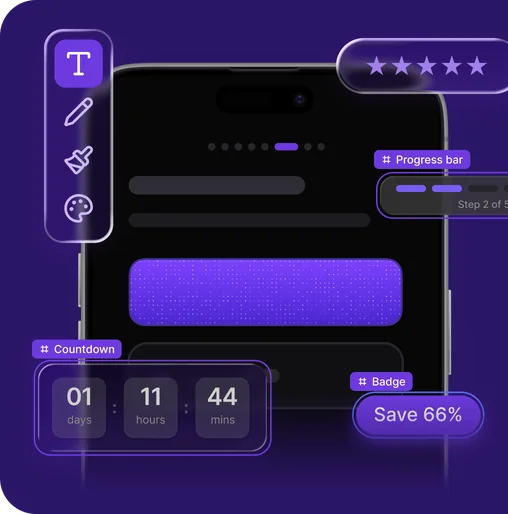
- Each number shows how common a screen is. We went through ScreensDesign recordings of the 50 top-grossing US App Store apps in each of seven categories. Each number is the share of those apps with at least one screen of that type.
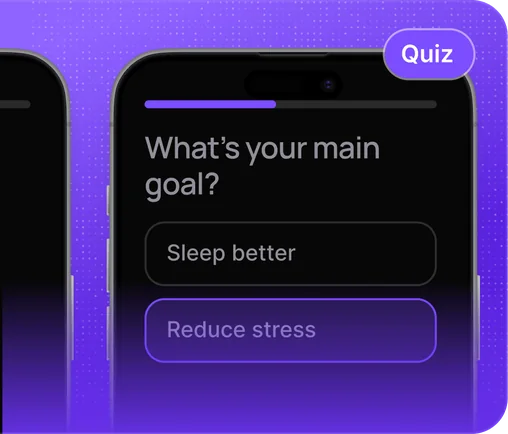
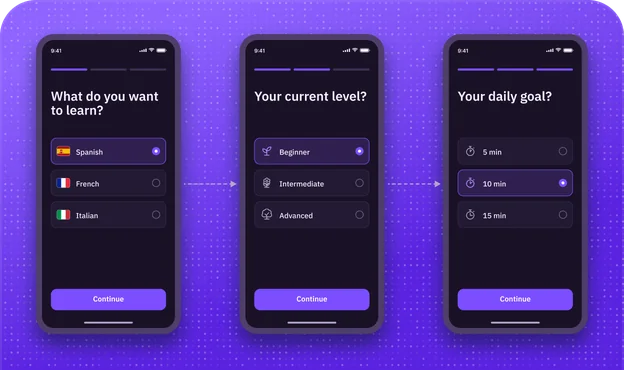
- Apps learn about users mostly through quizzes. 46% of top apps ask questions, the most widespread way to learn about the user.
- The order shown is typical. We didn’t measure the order in which the screens appear.
Anatomy of a top-grossing onboarding
52% of top apps personalize. Few carry it to the paywall
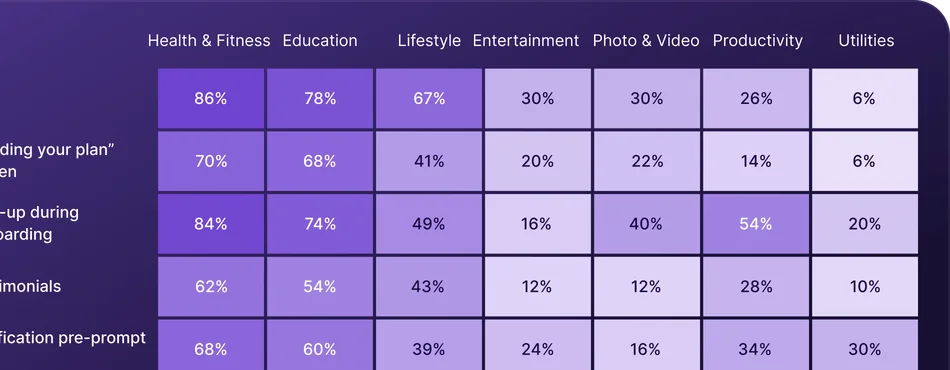
- Personalization depends on the category. 52% of top apps personalize the onboarding with a quiz, a plan-building screen or a screen that plays an answer back. The share falls from 88% in Health & Fitness to 10% in Utilities.
- Many quizzes lead nowhere visible. A third of top apps with a quiz (33%) show no plan-building screen and no screen that plays the answers back. Users answer, then see nothing change.
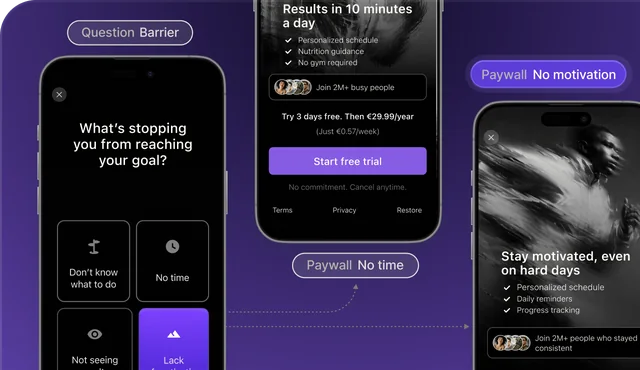
- Answer-based paywalls appear in three categories. In a manual check of 70 top apps, 9% of paywalls showed the user’s name, goal or target date, all in Health & Fitness, Education and Lifestyle.
Top apps that personalize the onboarding
Personalization signals, all 7 categories
Personalizes = has a quiz, a “building your plan” screen or a screen that plays an answer back.
Each category sells a different promise before the paywall
- Health & Fitness and Education sell the plan: a quiz, then a “building your plan” screen (about 70%) and testimonials (54–62%).
- Photo & Video sells the result: before/after screens in 54% of apps and a discount offer in 74%.
- Education explains the trial most: 50% of top apps show a trial timeline, against 10% in Utilities. Lifestyle shows the price per week or day most often (65%).
Share of top apps using each element
Top apps put the paywall last, not first
- Most apps wait until the flow is over. 14 of 20 top apps put the first paywall at the end of the onboarding.
- The plan screen rarely leads to the paywall. Only 2 of 20 show it straight after a “your plan is ready” screen. The screen before it varies: sign-up, social proof, a trial explainer or a privacy prompt.
- One paywall is the norm: only 4–12% of top apps in each category show a second one.
Position of the first paywall
Top apps showing 2+ paywalls
What this means for your app: Onboarding design
Ask questions if you sell a plan
Apps that sell a personal plan ask questions before the price. Utilities mostly skip them.
Show users what their answers changed
Many quizzes lead to nothing the user can see. Add a plan screen or play the answers back.
Put the answers on the paywall
Few paywalls repeat what users said. Put their goal in the headline or on the plan card.
Put the paywall at the end
Most top apps show one paywall, right after the last onboarding screen.
From onboarding to paywall
We compare users who finish with users who leave, and ad traffic with organic traffic. Then we look at how trials and plan choice differ by onboarding length, plan and region.
Finishing the onboarding is the strongest predictor of paying
- Finishers start far more trials. Users who complete the onboarding start trials at 14 times the rate of users who leave (5.47% vs. 0.24%).
- For paid subscriptions the gap is wider still: 2.00% vs. 0.09%.
- This is correlation, not cause. Users who leave early had less intent to begin with, and almost none of them ever see a paywall.
Conversion within 30 days, median app
Ad users finish the onboarding 5 points more often than organic users
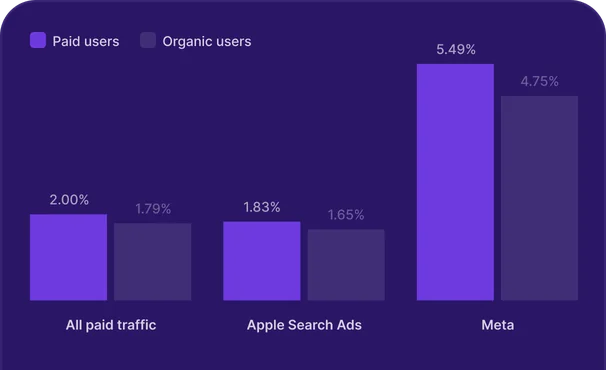
- The gap holds within the same app. Users who arrive from ads finish the onboarding more often than organic users of the same app: +5.0 points for the median app.
- Meta users show the biggest gap: +10.7 points in completion and +1.19 points in 30-day paid conversion for the median app. Apple Search Ads users finish more but convert at the same rate as organic users of the same app.
- Ads deliver intent. The onboarding’s job is to keep it, by continuing the promise that made the user tap.
Paid vs. organic users in the same apps
Longer onboarding flows produce trials that convert better
- Short-flow trials convert least. Trial-to-paid rises from 19.7% in 1–5 screen flows to about 30% in flows of 11+ screens.
- Day-one cancellations drop in long flows. They fall from 59.8% to 36–41%.
- Long flows trade volume for quality. As 3.3 shows, long flows start fewer trials, but those trials are better qualified. One reading: users who answered questions know what they’re paying for.
Trials by onboarding length
US trials convert best; European trials cancel fastest
- Most weekly trials end on day one. 58.8% are cancelled within a day of starting. Monthly trials convert best (26.8%).
- No other region comes close on conversion. 29.1% of US trials become paid, against 17–19% in every other region.
- Most European trials end within a day. 62.2% of trials in Europe are cancelled within 24 hours, the most day-one cancellations of any region.
Trial to paid and day-one cancellations
Weekly plans dominate everywhere except Health & Fitness
- Weekly is the default plan. 62% of apps sell mostly weekly plans to users who went through the onboarding, and the median app’s mix is 71% weekly.
- Health & Fitness leans annual. 35% of apps sell mostly annual plans, more than sell mostly weekly (29%).
- Regions split on plan length. The US has the largest annual share (19% of the median app’s sales); APAC has the largest weekly share (84%).
Share of apps whose users buy mostly weekly or mostly annual plans after the onboarding
What this means for your app: From onboarding to paywall
Get users to the paywall
Almost everyone who finishes sees a paywall. Almost no one who leaves early does.
Carry the ad’s promise to the paywall
Users from Meta ads finish and pay more often than organic users. Repeat the ad’s offer on the first screen and the paywall.
Test the weekly trial
Most weekly trials are cancelled within a day. Test a monthly or annual trial against it.
Measure trial quality, along with volume
Longer flows start fewer trials, but more of them convert. Track trial-to-paid as well as trial starts.
Personalization & testing
We look at how many apps save what users tell them in the onboarding, how many run onboarding A/B tests and how often those tests find a winner.
Only 1 in 5 apps save what users answer
- Most apps let quiz answers go. About one in five apps (19.2%) saves new user attributes during the onboarding, the closest signal of quiz answers being kept.
- Large apps save answers far more often. They do it almost three times as often as small ones (40.9% vs. 15.0%).
- Unsaved answers mean a one-size paywall. The rest ask questions, or don’t, and then show every user the same paywall. In State of paywalls, onboarding personalization lifted ARPU by 13–35%.
Share of apps that write new user attributes during the onboarding
Large apps run 11 onboarding variations a year; most small apps never test
- Testing is still rare. 23.5% of apps ran at least one onboarding A/B test in the year; among large apps, 68.2% did.
- Size decides how much apps test. The median large app went through 11 onboarding variations in a year; the median small app used one.
- Most apps never change their onboarding. 56.5% of apps used a single onboarding variation all year.
Apps with an onboarding A/B test
Onboarding variations used in a year
1 in 6 onboarding tests finds a clear winner on paid conversion
- Few tests find a winner on paid conversion. Only 1 in 6 (16.2%) does, against 3 in 4 on completion.
- The gaps are real money: the best variation beats the worst by 15.5% in paid conversion for the median test.
- Most tests are too small to prove it: the median variation collects 43 paid conversions. “No winner” usually means “not enough data yet”.
Tests with a clear winner, by metric
Gap between the best and worst variation
What this means for your app: Personalization & testing
Save onboarding answers
Most apps don’t save what users answer. Saved answers let you match the paywall to the user.
Start testing the onboarding
Most apps never test the onboarding, while most large apps do. Start with one A/B test.
Size tests for paid conversion
Most onboarding tests are too small to find a winner on paid conversion. Test fewer variations at once.
Give a “no winner” test more time
Variations often differ even when a test has no clear winner. Let it run longer before you drop the idea.
This report is based on onboarding flows built with Adapty. For Chapter 4, we also used ScreensDesign’s library of top US apps. Benchmarks cover the last 12 months, November 2025 to October 2026. The data covers the App Store. Revenue is shown in USD, before store fees, and includes renewals.
Privacy
We only use aggregated, anonymized data. No app, company or user can be identified.
Segmentation
We break results down by region, category, country, onboarding length, plan, traffic source and app size.
Regions, countries and categories
We cover the US, Europe, LATAM, MEA and APAC across 7 major App Store categories.
Data quality
We calculate benchmarks app by app, so the largest apps don’t skew the results.
Statistical approach
Most benchmarks use medians and percentiles. Ad vs. organic comparisons use the same apps for both groups. A test has a clear winner when its best and worst variations differ at p < 0.05.
Onboarding design
For Chapter 4, we used ScreensDesign’s library of the top 50 US apps by estimated revenue in each category. This chapter describes common design patterns, not their impact on conversion.
Every benchmark. One question away.
Use State of onboarding 2026 as a Claude Skill to benchmark your onboarding, check its length, and find your next test.
Add the skillAgainst the report’s benchmarks for completion and onboarding length:
- Completion is below typical. In the median US app, 70.0% of users who open the onboarding complete it.
- Your flow is short for the category. The median Health & Fitness onboarding has 12 screens.
- Longer flows earn more per open. A 21+ screen onboarding earns $1.39 per open, about four times a 1–5 screen flow.
Next test: run a longer flow with a short quiz against your current one and compare revenue per open, not just completion.