State of In-App Subscriptions 2026
State of in-app subscriptions 2026
Compare your app to the market with category-level data based on $3B in subscription revenue.
The report is based on subscription data from 16,000+ apps that processed over $3B in revenue through Adapty. Most of the data comes from the Apple App Store, with Google Play included where we compare stores. The analysis covers 2025. All revenue is gross, in USD.
Privacy
We process all data in batches and apply randomization to protect client privacy and anonymity.
Segmentation
We break down data by region, billing cycle (weekly, monthly, annual), and acquisition (trial vs. direct). Some sections also filter by paywall type and country. We include lifetime subscriptions where applicable.
Regions, countries, and categories
Data quality
Statistical approach
We report medians and percentiles alongside averages, so you can see the full range.
Adapty is a complete
subscription growth platform
Global in-app purchase revenue is on
track to reach $210B in 2026
This time, it's not hype — AI changed the economics. Users spend more time inside apps, teams ship in weeks instead of quarters, and what used to take 10 people now takes 2 founders and a model. Thousands of new apps launch every day — and 95% of subscription revenue still goes to the top 10%.
Breaking in is getting harder. Newer apps already earn roughly 25% less at the median than apps launched just a few years ago. When the market is this concentrated, copying someone's pricing or guessing at trial length is just hoping it works out.
This year's report is fully interactive. You can filter any chart by region, category, and plan duration to see how apps like yours monetize and what you're missing. Based on $3B in subscription revenue across 16,000+ apps. LTV, conversions, pricing structures, market trends, and paywall patterns.
Building is the easy part. Knowing what to price, how to convert, and when to change — that's what this report is for.


LTV insights
Compare LTV performance across subscription plans, regions, and app categories to find where your revenue potential is hiding.
Weekly plans with trials have the highest 12-month LTV
Subscription LTV by category, region, and country
Trials boost LTV for annual subscriptions in Utilities, Health & Fitness, and Education.
In Productivity, Lifestyle, Entertainment, and Graphics & Design, direct buyers are worth more.
Productivity leads across all plans at $46.97, followed by Utilities ($46.30) and Education ($45.10).
Israel, Switzerland, and Qatar generate the highest LTV globally
Top countries by median one-year LTV
Each of the top-3 European countries outperforms the US in median LTV.
Top LATAM countries see 35% lower LTV than top European ones, calling for a distinct regional strategy.
Install LTV varies 2× across categories
Install LTV measures how much revenue a new install generates over 12 months. It is calculated by multiplying the average conversion rate from install by the average LTV for a given segment, then taking the median value for each category.
Median one-year install LTV
In most categories, North American install LTV is roughly 2x the global average.
Health & Fitness has the highest install LTV at $1.20, followed by Utilities at $1.10.

Find your most
profitable users
& double down
on what works
•Track Revenue, MRR, churn, LTV, ARPU,
and 10+ live metrics
•Analyze funnels to see
where users convert or drop
•Use predictive LTV to identify
your most valuable cohorts.
•Filter by country, product, paywall,
attributes

Pricing landscape
See what apps charge by region and category and how price affects LTV and conversion.
European subscription prices jumped by 18% YoY
Subscription price distribution by category and region
Europe overtook North America as the most expensive region on annual, monthly, and weekly.
The biggest price jump is in European Utilities annual plans — up 70.5% over two years.
A median annual plan costs just 3x the price of a monthly plan globally — meaning annual subscribers save 75%.
Subscription prices vary up to 4x across countries
The pricing index shows how much the same subscription costs across countries. A value of 1.0 represents the baseline. For example, if Argentina’s average weekly price is $7.08 and the UK’s is $8.72, the UK is about 20% more expensive, corresponding to an index value of 1.2.
Pricing index by country
Click on the country to choose it as the baseline.
Annual Health & Fitness has the widest pricing gap: Germany is 4.4× higher than Turkey.
No single country leads across all plan types: Japan tops annual ($54.59) Germany monthly ($17.19), and the UK weekly ($8.72).
Test, personalize, and iterate without app updates
•A/B test pricing, paywalls, and onboarding
•Ship changes instantly, no app release needed
•Run unlimited variants with early winner detection
•Segment by behavior or subscription status

High-price apps earn 3× the LTV of low-price apps
We divided apps into four price buckets based on their category: Low (bottom 25% of prices), Lower mid (25-50%), Upper mid (50-75%), and High (top 25%). We then calculated the average LTV for apps in each price bucket.
One-year LTV by price bucket and plan duration
In Health & Fitness, expensive annual plans earn 4.5x more per user than cheap ones.
In APAC, the gap between cheap and expensive weekly apps is the biggest of any region — 3.1x.
Weekly plans convert 2-7x better than annual plans
We divided apps into four price buckets: Low (bottom 25%), Lower mid (25-50%), Upper mid (50-75%), and High (top 25%) within each category. We then calculated average conversion rates for apps in each bucket.
Conversion rate by price bucket and plan duration
Monthly conversion drops ~53% as prices move from low to mid range. Monthly plans are the most price-sensitive.
For weekly plans, higher-priced apps convert into purchase better. Price alone isn't what stops users from subscribing.

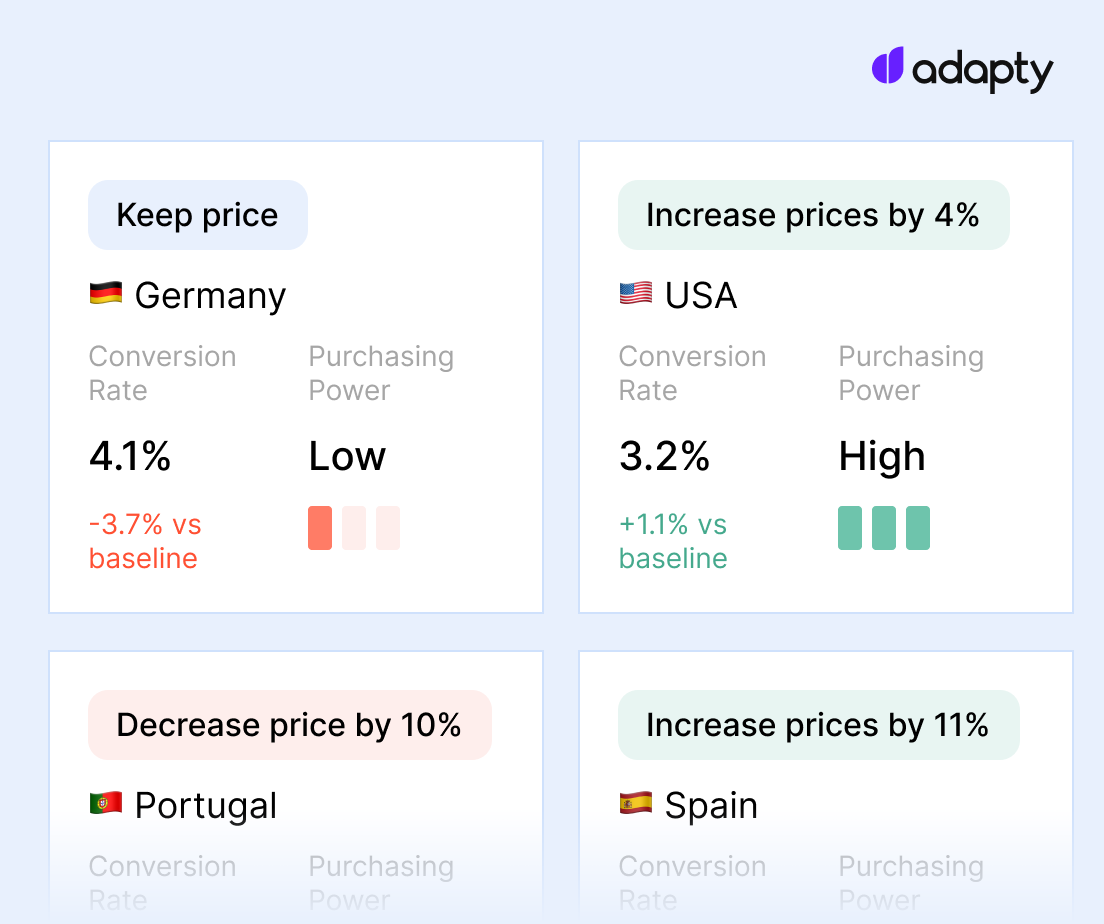
Pricing Index explains the market. Price Radar shows your position inside it
Compare your pricing to apps in your exact sub-niche, country by country.

Conversion highlights
Benchmark the data on conversions, renewal performance, overall retention, and refunds across regions and categories.
Trials boost first renewals by up to 60%
Install-to-trial and install-to-paid benchmarks are computed as app-level conversion rates (trials or purchases divided by installs) within each segment, then aggregated as the average of per-app rates. Because subscription duration is not known at install when multiple plans are offered, these benchmarks are calculated across all durations and the same value is repeated for each duration bucket.
Conversion rates by user journey stage
Trial
Paid
renewal
Trial users retain 8–60% better at 1st renewal, depending on plan type — with the biggest gains on weekly plans.
North American users are both more willing to start trials and more likely to convert — with an install-to-trial rate of 14.5%, compared to 7.6–10.2% elsewhere.
Trials boost one-year retention by 43% on weekly plans
Retention by plan duration and trial strategy
Productivity retains best overall, with an average of 14% of users staying after one year.
On annual plans alone, Utilities lead in one-year retention at 22.1%.
Higher-priced weekly tiers retain 12% better at first renewal
We divided apps into four price buckets: Low (bottom 25%), Lower mid (25-50%), Upper mid (50-75%), and High (top 25%). We then analyzed renewal rates across these buckets to see where users are most price-sensitive.
Renewal rate by price bucket
Entertainment monthly has the most extreme price-retention gap — low-priced apps retain 2× better than high-priced ones.
European monthly subscribers are the most price-sensitive at renewal. Low-priced apps see 40% higher first-renewal rates than high-priced ones.
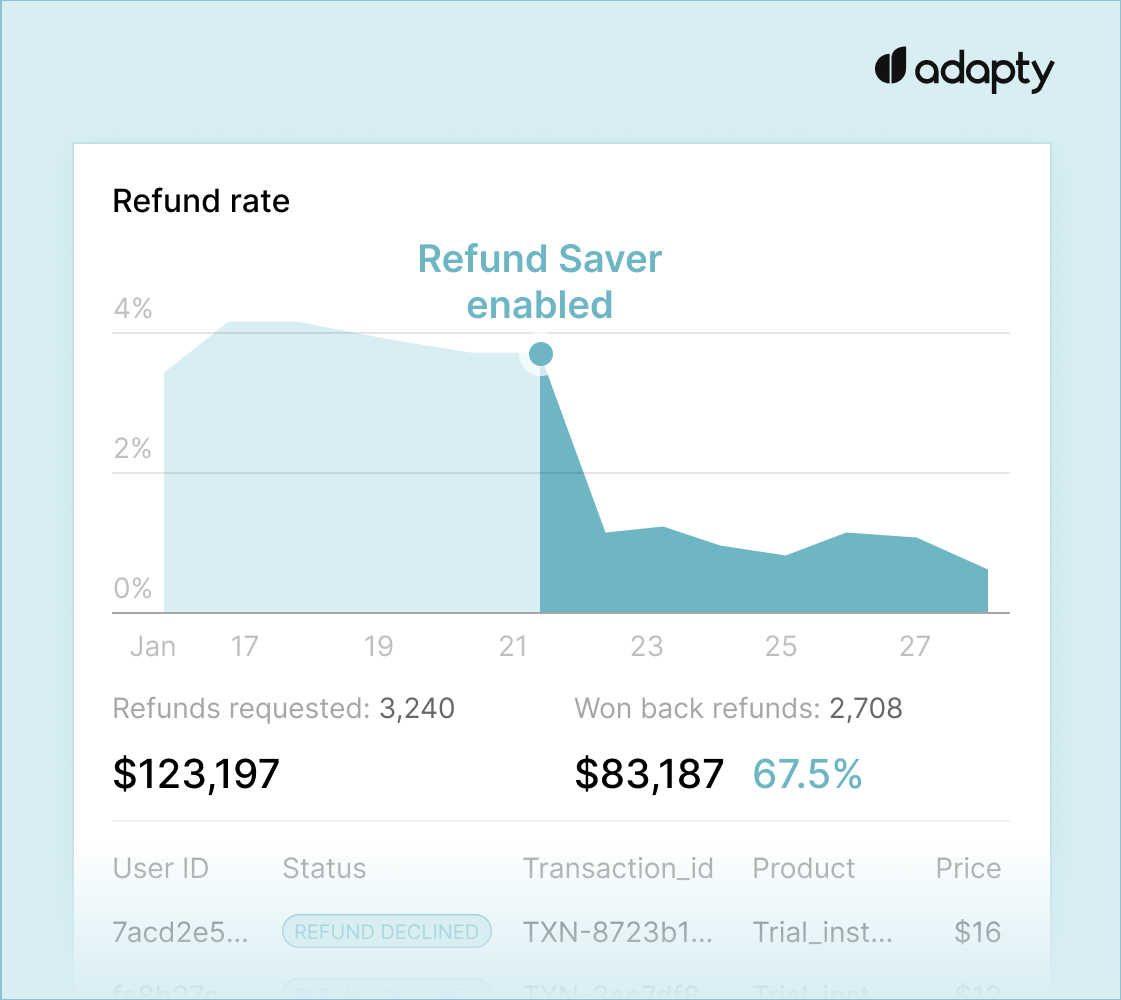
MEA as the lowest refund rates overall (2.5% non-trial, 3.1% trial), bottoming out in Entertainment — the lowest of any category-region-cohort combo.
Photo & Video leads in trial refunds at 6.4% globally, spiking to 14.1% in APAC. This is driven largely by Korea's “consumer-friendly” refund policies.

Reduce refund losses
by up to 50%
Automatically intercept refund requests
and recover lost revenue without any
code, workflows, or support overhead.
For many apps, the recovered revenue
alone is enough to cover Adapty’s cost.

Market trends
See the revenue by region and category. Which markets are growing fastest, how concentrated earnings are, and how apps monetize differently across segments.
North America still drives over half of subscription revenue
Subscription revenue share by region
North America’s share dropped 3 percentage points since 2023. Europe held steady.
Japan, Mexico, and Turkey are among the fastest-growing app markets.
Lifestyle is the hardest app category to compete in
Revenue share captured by top 10% of apps
The top 10% of apps earn 95% of all app revenue, with Lifestyle leading by concentration globally with 97.93%.
In 2025, 31% more apps launched but they earn less
New app launches vs. median revenue per app, 2024–2025
Number of new apps
Adapty, 2026
Median monthly revenue per new app
Hidden spacer
The number of subscription apps grew 31% in a year. Newer apps’ median monthly revenue is 22% lower.
8 in 10 new apps never break $10K. Only 7.9% reach $100K.
New app distribution by revenue
58% of new apps earn under $1K in their first year. Only 8% break $100K.
Weekly subscriptions now generate 56% of all app revenue
Revenue share by product plan
Weekly plans continue to solidify their dominance globally, with their share jumping to 55.6% in 2025.
One-time purchases, including consumables and lifetime subscriptions, are growing steadily — from 6.4% in 2023 to 10.3% in 2025.
Health & Fitness is the only category where annual plans not only dominate but continue to grow their share.
7 in 10 apps offer trials — the share is stable over time
Trial usage across categories
Adapty, 2026

Utilities increased trial usage faster than any other category, going from 78.0% to 84.7%.
Share of apps with trials in Photo & Video went from 70.7% to 62.3%. This is the steepest drop of any category.
Discounts are rare: 9 in 10 subscriptions sell at full price
Discount usage across categories
Education apps are the most likely to drop the price: 14.3% of them offer discounts.
Utilities rarely discount: only 1.2%, the lowest of any category.
90% of trial starts happen on Day 0
Install-to-trial time and Install-to-paid time across categories
44.5% of all purchases happen on Day 0 — meaning 55.5% of users needed more time to commit.
In Health & Fitness, users either buy on Day 0 or on Days 4–7, highlighting the success of trials there.

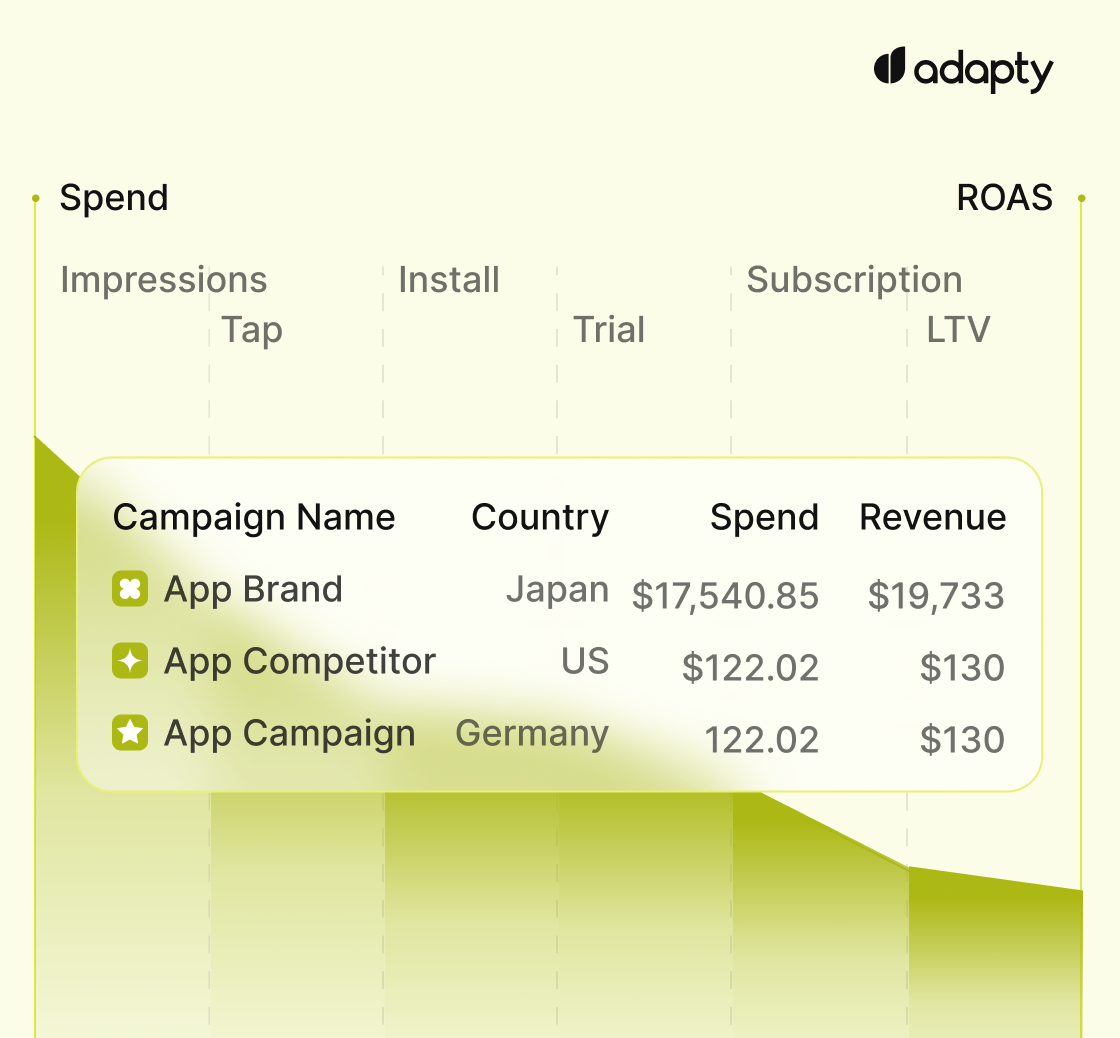
Stop optimizing for installs. Start
optimizing for revenue
Adapty tracks paid acquisition down to
subscriptions, LTV, and ROAS — so you
see which channels pay back and which
don't.

Paywalls &
experiments
Compare paywall setups by LTV, see how experiments affect conversions, and understand where placement matters.

Weekly paywalls with trials outperform every other setup
Top-performing and underperforming paywall setups
LTV
LTV
rate
rate
Weekly plans with trials bring in 1.5x the average LTV of all other paywall setups.
Localization tests drive the largest LTV uplift
Experiment type and its impact
LTV Uplift
CR Uplift
Changing plans, trials, or duration improves LTV more than updating visuals or copy.
Price tests rarely improve conversion (28% win rate) but lift LTV 46% of the time.
Teams that experiment can make up to 40x more revenue
Experiment count and revenue correlation
The average number of experiments per tester is 14.7 — the apps that test don't stop at one.
Onboarding paywalls with trials convert the best
Average install-to-paid conversion rate by paywall placement
Onboarding paywalls with trials convert the highest at 1.78% on average.
Hard paywalls produce 21% higher LTV
Average one year LTV by paywall type

The lowest-spending users pay about the same either way. The difference appears at the top — hard paywall users spend 20-33% more than the median.
Soft paywalls outconvert hard paywalls by nearly 50%

Build, test, and ship
onboarding & paywalls
without app updates
Control your paywalls and onboarding from one place. No releases, no engineering queue.
- Build onboarding and paywalls with drag-and-drop, publish instantly.
- Choose from 50+ templates or AI-generated variants.
- A/B test copy, layouts, pricing, and full flows.
- Localize with AI or manual import/export.

iOS vs.
Android
Explore how the two platforms differ in LTV and conversion rates by categories and regions.

iOS drives 85% of app subscription revenue
Share of revenue generated by Android and iOS apps
iOS generates 5.6x more subscription revenue than Android — but with Android growing, the gap may not last forever.
Android users pay almost as much as iOS
One-year LTV by category: iOS vs Android
Weekly plans show the biggest relative gap. Android weekly LTV is 18% lower than iOS.
iOS converts 3x better than Android
Average install-to-paid conversion rate: iOS vs Android
On annual plans, iOS converts 3.6x better than Android. The gap is consistent across all plan types.

Scale Apple Ads ROAS from click to paywall without MMPs
- Track keyword-level ROAS and connect each ad to the paywall that converts best.
- Link Apple Ads directly to subscription revenue.
- One SDK, no MMP — full-funnel attribution in under an hour.
State of AI apps
See how AI apps stack up against total app averages in conversions, LTV, and retention. This section focuses on apps identified as AI-powered tools.

AI apps convert into trial 2x worse than an average app
Median install-to-paid conversion rate: AI apps vs. apps on average
Despite losing on trial conversions, AI apps get 14% more direct purchases than average.
AI apps make the most money on annual plans with trials
Subscription LTV: AI apps vs. apps on average
Annual plans with trials are where AI apps pull ahead — $66.70 vs $49.92 one-year LTV compared to all apps.
Offering trials on annual plans boosts one-year LTV by 35% compared to direct purchases.
AI apps have 70% higher install LTV than an average app
Median install LTV: AI apps vs. apps on average
AI apps have 70% higher install LTV than an average app — $1.44 vs. $0.84.
AI apps retain fewer subscribers than average
Retention rate: AI apps vs. apps on average
AI apps retain worse across almost every metric, losing 20% more annual + trial subscribers by year's end.
AI apps churn faster but charge more per user — so LTV still comes out ahead.
AI apps saw nearly 700% revenue growth in Lifestyle
Revenue growth of AI apps by category, 2025 vs. 2024
Lifestyle AI apps lead with 691% YoY revenue growth, followed by Graphics & Design at 202% and Utilities at 174% — creative and productivity categories are driving the bulk of AI monetization.
Act on revenue signals before the data is final
Adapty's AI spots trends in revenue and LTV early — so you don't wait weeks to know what's working.
- Predict revenue and LTV at the cohort level.
- Spot A/B test winners before full statistical significance.
- Get A/B test ideas based on real data.
- Generate paywall variants tailored to your audience.
- Localize paywalls across markets automatically.

Web paywalls
See how conversion, retention, and LTV differ between in-app and web paywalls
Early data: web paywalls have become available in the US in mid-2025.

In-app paywalls convert 45% better than web
Install-to-paid conversion rate
In-app paywalls still convert better —
1.60% vs 1.10%. But web paywalls skip the
30% App Store commission, so the
revenue per conversion can still be higher.
Web paywall retention starts high and drops fast
Retention rate: web vs. in-app paywalls
Web paywalls retain better at Month 1
(64.5% vs 46.2%) but drop faster — by
Month 6, in-app retains 30% vs web's
20%.
Web paywalls don't close the LTV gap, even without fees
Average LTV: web vs. in-app paywalls
Without App Store fees, web LTV is still
$4 lower than in-app — $35.8 vs $40.1.
Lower retention offsets the commission
savings.

Partner agencies
Trusted partners we work with
to help apps grow faster

173tech
A London-based analytics agency founded by the team behind Bumble's data function — from day one to a $3B exit. They help consumer apps and subscription businesses build the infrastructure, attribution models, and dashboards needed to turn data into growth decisions.

Grovix
Grovix accelerates mobile app growth through expert ASO, user acquisition strategies, and SDK integrations. They help enhance visibility, optimize user engagement, and drive measurable results for lasting success.

Aperture
A growth agency helping apps scale through smart ad strategy. They’ve worked with brands like Your Juno and Mindful Mamas — cutting CAC by 77% and boosting install rates by 131%. Founded by Hannah Parvaz, named App Marketer of the Year.

Perceptycs
Founded by Nathan Hudson, a two-time Head of Growth, Perceptycs helps early-stage apps find product-market fit and scale to Series B through full-funnel growth strategy and paid acquisition.

OtherWayAround
An AI-powered growth agency blending performance, ASO, and creative strategy to help apps scale sustainably. Known for their sharp execution and high-performing campaigns across all stages of the funnel.

Yodel Mobile by NP Digital
The leading global app marketing agency, named App Marketing Agency of the Year. With 18+ years of experience and 300+ apps launched — including Tinder, Gymshark, and B&Q — they combine ASO, paid UA, and creative services to drive measurable, long-term growth.

Wuzzon
The leading app growth agency in the Benelux, founded in 2007 and specializing in subscription apps. They cover the full funnel — ASO, performance marketing, and subscription optimization — with deep experience across fintech, e-commerce, and mobility.

All The Way UA
A UA consultancy that has taken apps from $0 to $100k+/month in profitable ad spend — repeatedly. What sets them apart: they also build clients' in-house UA teams, transferring all strategies, playbooks, and know-how so growth doesn't depend on the agency forever.

Elemental Growth
A growth advisory firm by Phil Carter — ex-Faire and Quizlet product leader and creator of the Subscription Value Loop framework. He helps Seed–Series C subscription apps define strategy, optimize paywalls, and build scalable growth systems. Clients include Perplexity and Chess.com.

App Masters
A mobile app marketing agency focused on cost-effective strategies to drive growth. Founded by Steve P. Young, they work with chart-topping apps and startups alike. Services include ASO, monetization, and UA.

Alper Taner
A full-stack app growth consultant with 13+ years in mobile and 60+ apps across health, utility, e-commerce, and dating. Specializes in performance marketing audits, ASO, and conversion funnel optimization.

5 takeaways
from the
report
Turns out, weekly is just... better
Two years ago, weekly plans made up 43.3% of app revenue. Now it's 55.5%. Add a trial, and LTV grows from $7.40 to $54.50 over the year — a 636% increase no other configuration comes close to.
Worth checking if your paywall is keeping up.
Europe got expensive — in a good way
Two years ago, European and North American subscription prices were basically the same. Today, European prices run up to 40% higher, and that's not just the dollar weakening. European users are genuinely willing to pay more. Good news for developers who are still conservative on prices in Europe.
The top 10% of apps now earn
95% of all revenue
This concentration grew from 92.7% in 2023. This is a harsh reality where new developers either find a strategy to break into the top 10%, or they're left fighting for breadcrumbs.
Utilities + trials = a money
machine
Utilities lead all categories in long-term LTV, with a typical user bringing in $68.90 in the first year. The catch: trials must be present. Utilities lead all categories in retention, and the logic is simple: if a tool solves a user's problem well enough, they stick with it.
Most apps earn less than $1k a year. Many earn nothing at all
Among new apps with at least some revenue, 57.7% bring in between $1 and $1,000 a year. It hits differently knowing zero-earners aren't even counted here.
Building an app has never been easier. Growing one is a different problem entirely.