Funnel analysis is the process of measuring how users progress through a defined sequence of steps toward a specific goal — such as completing a purchase, subscribing to an app, or finishing onboarding. At each step, some users continue forward while others drop off. By quantifying these transitions, funnel analysis reveals exactly where friction occurs, how severe each drop-off is, and which stages offer the highest-leverage opportunities for improvement. It is one of the most widely used methods in product analytics, marketing, and mobile app growth.
How funnel analysis works
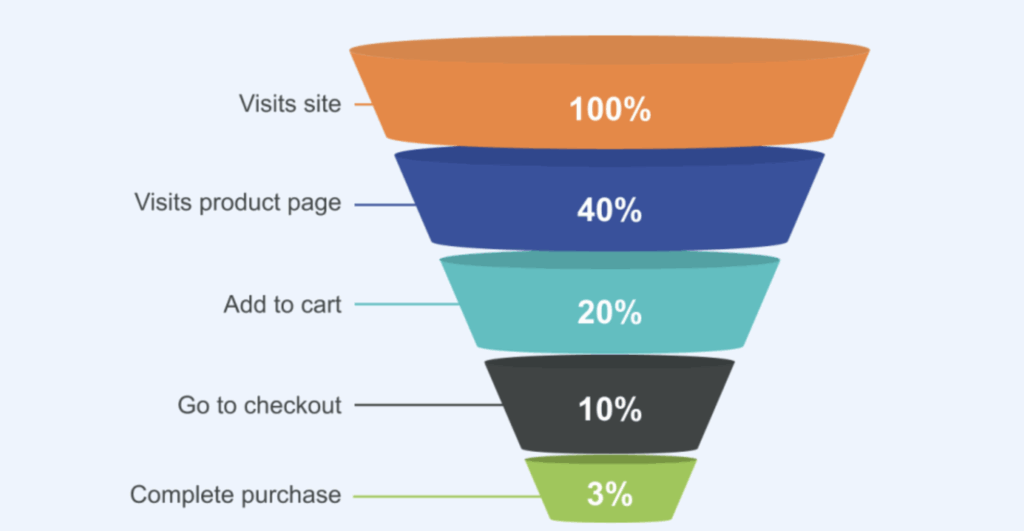
Every funnel analysis follows the same core logic. You define a sequence of events that represent the ideal user path, instrument those events in your analytics tool, and then measure how many users complete each step within a given time window. The result is a visualization — typically a narrowing bar chart — that shows absolute counts and conversion rates at each stage.
The three essential data points behind any funnel are: who performed an action (a user or session identifier), what they did (the event name), and when they did it (a timestamp). With these in place, you can calculate stage-to-stage conversion rates, cumulative conversion from entry to goal, and drop-off percentages between each step.
Most analytics platforms let you set a conversion window — the maximum time a user has to complete the entire funnel. Shorter windows surface issues faster, while longer windows accommodate products with slower decision cycles. The counting unit also matters: you can measure unique users, sessions, or accounts depending on your business model.
Key metrics in funnel analysis
| Metric | Definition | Why it matters |
|---|---|---|
| Stage-to-stage conversion rate | Percentage of users who move from one step to the next | Pinpoints the exact step where the largest drop-off occurs |
| Overall (cumulative) conversion rate | Percentage of users who complete the entire funnel from entry to goal | Provides a top-level KPI for the journey’s effectiveness |
| Drop-off rate | Percentage of users who exit the funnel at a given step | Highlights friction points that need investigation |
| Average time between steps | Mean duration users spend transitioning from one step to the next | Reveals hesitation or confusion at specific stages |
| Average time to complete | Mean duration from funnel entry to goal completion | Benchmarks the overall speed of the user journey |
| Segmented conversion rate | Conversion rate broken down by user segment (device, country, cohort) | Uncovers differences in behavior across audiences |
Common types of funnels
Different business contexts call for different funnel structures. Below are the most common funnel types used across web, mobile, and SaaS products.
Marketing and acquisition funnels
These track the path from first exposure (an ad impression, search result, or social media post) through to a defined acquisition event such as an app install or account signup. Marketing funnels help teams evaluate channel performance and allocate budgets to the sources that drive the highest-quality users.
Activation and onboarding funnels
After a user installs an app or creates an account, the onboarding funnel measures how many reach the “aha moment” — the point where they experience the product’s core value. Steps typically include account creation, profile setup, first key action, and feature discovery. Steep early drop-offs in onboarding funnels often indicate UX issues or unclear value communication.
Conversion and purchase funnels
Conversion funnels track the sequence leading to a transaction — viewing a product, adding it to a cart, entering payment details, and completing checkout. For subscription apps, this might be seeing a paywall, starting a free trial, and converting to a paid plan. Research suggests that roughly 70% of e-commerce carts are abandoned, making this funnel type one of the most studied and optimized.
Retention and re-engagement funnels
Rather than measuring a single journey, retention funnels track whether users return and repeat valuable actions over time. They often intersect with churn rate analysis and cohort-based measurement to show how engagement evolves after initial conversion.
Funnel analysis for mobile apps
Mobile app funnels deserve special attention because user journeys on mobile are more constrained and drop-off rates are typically higher than on web. Day-one churn across mobile apps averages around 75%, which means funnel optimization has an outsized impact on growth.
A typical mobile subscription app funnel includes stages like app install, onboarding completion, paywall view, trial start, and paid subscription. Each stage presents distinct optimization levers. For example, the transition from paywall view to trial start is heavily influenced by paywall design, pricing, and the clarity of the value proposition. You can explore how app funnels work in detail for more context on mobile-specific analysis.
| Funnel stage (subscription app) | Typical benchmark | Optimization focus |
|---|---|---|
| App store impression → install | 20–40% depending on category | App store listing, screenshots, ratings |
| Install → onboarding complete | 40–60% | Onboarding flow length, value preview, permissions requests |
| Onboarding complete → paywall view | 60–90% | Paywall placement timing and trigger logic |
| Paywall view → trial start | 5–15% | Paywall design, pricing, trial offer clarity |
| Trial start → paid subscription | 18–50% (opt-in vs. opt-out trials) | In-trial engagement, activation emails, value demonstration |
How to set up a funnel analysis
Step 1: Define the goal
Start with a single, measurable outcome — the macro conversion you want to optimize. For a subscription app this might be “user subscribes to a paid plan.” For an e-commerce app it could be “user completes checkout.” Clarity here prevents scope creep and keeps the analysis actionable.
Step 2: Map the steps
Identify the 4–7 key actions a user must take between entry and goal. Each step should correspond to a discrete, trackable event. Avoid adding too many micro-steps (which obscure the signal) or too few (which hide where users struggle). A SaaS example might look like: landing page → sign-up started → sign-up completed → onboarding checklist → activation event → trial → paid.
Step 3: Instrument events
Ensure each step fires a named event in your analytics platform with consistent naming conventions and a reliable user identifier. Inconsistent event names — like having both “signup_success” and “signed_up” — can distort funnel data significantly.
Step 4: Set the conversion window
Choose a time frame that reflects your product’s natural cadence. A 7-day window works well for apps with short decision cycles, while a 30-day window may be more appropriate for SaaS products or high-consideration purchases.
Step 5: Analyze and segment
Run the funnel and look for the largest absolute drop-offs. Then segment by device, country, acquisition channel, or user cohort to understand whether the problem is universal or limited to a specific group. Segmented analysis often reveals that an overall 30% drop-off is actually a 50% drop-off on Android and only 10% on iOS, which changes the diagnosis entirely.
Optimizing funnel performance
Once you have identified the highest-impact drop-off points, the next step is to form hypotheses and test them systematically.
Use A/B testing at friction points
A/B testing is the most reliable method for validating funnel improvements. Change one variable at a time — button copy, form length, paywall layout — and measure its effect on the stage-to-stage conversion rate. Avoid evaluating tests by conversion rate alone; revenue metrics like ARPU often tell a more complete story.
Simplify or remove steps
Every additional step in a funnel introduces friction. If a step exists for business reasons rather than user value, consider whether it can be removed, postponed, or combined with another step. Reducing onboarding from five screens to three, for example, can meaningfully lift completion rates.
Investigate qualitative signals
Funnel charts tell you where users drop off but not why. Pair quantitative funnel data with qualitative methods — session recordings, heatmaps, user surveys, and support tickets — to understand the root cause behind drop-offs. A broken link, a confusing form field, or a slow-loading screen can each produce identical drop-off patterns.
Monitor continuously
Funnels shift as products evolve. Re-run your analysis weekly or monthly. Set up alerts for sudden changes in step-level conversion rates, and version your event taxonomy so deprecated events do not silently break your reporting.
Funnel analysis vs. related methods
| Method | Focus | Key difference from funnel analysis |
|---|---|---|
| Funnel analysis | Sequential step completion toward a goal | Measures a predefined, ordered path |
| Path analysis | All routes users actually take through a product | Explores open-ended journeys without a fixed sequence |
| Cohort analysis | Behavior of user groups over time | Groups users by shared characteristic (e.g., install week) rather than step sequence |
| Retention analysis | Whether users return and repeat actions | Tracks repeat engagement over time, not single-journey completion |
| Attribution analysis | Which channels or campaigns drive conversions | Assigns credit to touchpoints rather than measuring step-by-step progression |
These methods complement rather than replace each other. A common workflow is to identify a bottleneck with funnel analysis, segment it using cohort analysis, investigate causes with path analysis and session recordings, and then test fixes via A/B experiments.
Common mistakes in funnel analysis
Even with good tools, funnel data can mislead if the setup is flawed. Here are the most frequent pitfalls:
Skipping micro-steps hides friction. If a multi-field form is tracked as a single “form submitted” event, you cannot tell whether users abandon at field two or field eight. Break complex interactions into their meaningful sub-steps.
Using inconsistent event definitions distorts metrics. When signup events are named differently across platforms or app versions, your funnel will either double-count or under-count users. Maintain a shared event taxonomy and deprecate old events cleanly.
Setting conversion windows that are too short underreports completions. If users typically need 14 days to convert but your window is set to 7, your funnel will look worse than it actually is. Align the window to your product’s natural decision cycle.
Ignoring segments masks the real story. An overall 25% conversion rate might consist of a 40% rate for organic users and a 10% rate for paid traffic. Always break funnels down by meaningful dimensions before drawing conclusions.
Optimizing for conversion rate alone can be counterproductive. A higher conversion rate achieved through aggressive discounting may reduce revenue per user. Evaluate funnel changes against revenue metrics like ARPU and LTV, not just step-level percentages.