The percentage of users who stop using your mobile app over a specific time period. Churn rate is the inverse of retention rate and serves as a critical health indicator for any app business. For subscription apps, tracking churn is essential since even small reductions in churn can significantly impact revenue and customer lifetime value (LTV).
What is churn rate?
Churn rate, also known as attrition rate, measures the percentage of users who stop using your mobile app over a specific period. In the context of mobile applications, churn represents users who disengage from your app—whether they uninstall it completely, cancel their subscription, or simply stop opening and interacting with it.
This metric is essentially the inverse of app retention. While retention rate shows you how many users continue engaging with your app, churn rate reveals how many are slipping away. For subscription-based apps, churn specifically tracks users who cancel or fail to renew their subscriptions.
There are two main types of churn that mobile app developers and marketers should understand:
- Voluntary churn occurs when users deliberately choose to leave—they uninstall the app, cancel their subscription, or consciously stop using the service.
- Involuntary churn happens due to factors outside the user’s direct control, such as failed payment processing, expired credit cards, technical issues, or subscription lapses the user may not even realize are occurring.
Understanding which type of churn is affecting your app is crucial for implementing the right solutions. While voluntary churn often requires improvements to your app’s value proposition or user experience, involuntary churn can frequently be addressed through better payment retry logic and proactive user communication.
Why is churn rate important?
Churn rate serves as a reliable indicator of both customer satisfaction and overall business health, making it one of the primary KPIs for mobile app companies. Tracking this metric helps you understand how many users are leaving your app and, more importantly, why—providing insights into how “sticky” your app really is.
The financial impact of churn extends beyond just lost revenue from departing users. When you lose a customer, you also forfeit all the resources invested in acquiring them in the first place, including marketing expenses, advertising costs, and onboarding efforts. This makes reducing churn significantly more cost-effective than constantly acquiring new users to replace lost ones.
Churn rate directly informs your understanding of customer lifetime value (LTV) and helps set appropriate budgets for acquiring new users through customer acquisition cost (CAC). By analyzing the LTV-to-CAC ratio, you can gauge your spending efficiency. If this ratio approaches 1:1, your acquisition costs are essentially eliminating any value gained, leaving you with minimal or no profit.
Here are additional reasons why monitoring churn is essential for app success:
- Improves customer retention: Retaining existing users is far more cost-effective than acquiring new ones. Research shows that reducing churn by just 1% can lead to substantial savings and revenue improvements over time.
- Determines product-market fit: High churn rates may signal a mismatch between your app and your target audience, indicating the need for adjustments to better meet user expectations and needs.
- Boosts customer lifetime value: Churn directly impacts LTV since long-term users provide more value to your business. Enhancing LTV justifies higher spending on user acquisition while maintaining profitability.
- Reveals user experience issues: Persistent churn often points to underlying problems such as poor onboarding, confusing navigation, technical bugs, or missing features that users expect.
How to calculate churn rate?
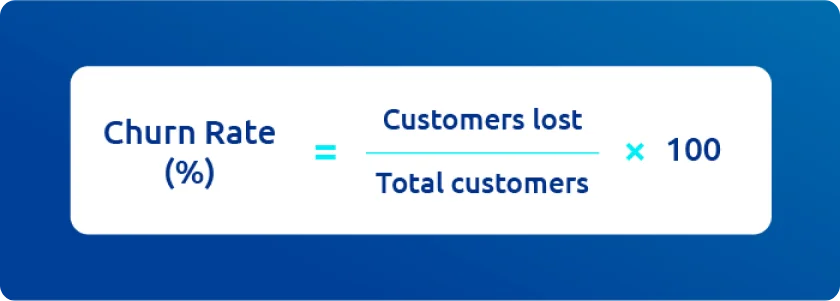
Calculating churn rate requires tracking the number of users at the beginning and end of a specific period. The basic formula is straightforward:
| Churn Rate = (Users Lost During Period / Total Users at Start of Period) × 100% |
By measuring your app’s churn rate regularly, you can track and improve your app’s user satisfaction and stickiness over time. The time frame you choose for measurement depends on your app’s usage patterns and business model.
Monthly churn rate example for apps
Monthly churn rate provides a close look at month-to-month changes in user retention. This timeframe is particularly useful for subscription apps and helps identify short-term trends quickly.
Example: Suppose your app starts the month with 10,000 users and ends with 8,500 users.
Monthly Churn Rate = ((10,000 – 8,500) / 10,000) × 100% = 15%
A 15% monthly churn rate means you lost 15% of your user base during that month. For subscription apps, this would quickly compound into significant losses if not addressed.
Annual churn rate example for apps
Annual churn rate reveals year-over-year growth trends and is useful for understanding long-term patterns and seasonal variations in user behavior.
Example: Your app’s user count at the beginning of the year is 50,500, and by year-end, it has dropped to 45,000.
Annual Churn Rate = ((50,500 – 45,000) / 50,500) × 100% = 10.89%
This indicates your user base decreased by approximately 11% over the course of the year.
It’s important to note that when calculating churn during periods of rapid growth, traditional formulas can become less accurate. If new users are joining faster than users are leaving, the overall churn rate may appear to be decreasing even when retention issues persist. In such cases, consider using probability-based churn calculations that treat churn as a daily probability rather than a static monthly or annual percentage.
Mobile app churn rate benchmarks
Understanding how your app compares to industry standards helps contextualize your churn metrics and set realistic improvement goals. Mobile app churn rates are typically measured at several key intervals after installation.
1. Day-one churn rate
Day-one churn rate indicates the percentage of users who never return after their initial session—essentially measuring how many users you lose within the first 24 hours.
The average day-one retention rate across mobile apps is approximately 25%, meaning roughly 75% of users churn after their first day. This benchmark emphasizes the critical importance of making a strong first impression through effective onboarding and immediately demonstrating value.
2. Day-seven churn rate
This metric reveals user engagement patterns over the first week, showing how many users remain interested beyond their initial curiosity.
Industry benchmarks indicate an average day-seven retention rate of around 10-11%, meaning approximately 89-90% of users churn within the first week. This steep drop-off highlights the challenge of maintaining user interest during the critical early period.
3. Day-thirty churn rate
Day-thirty churn rate provides insights into medium-term user engagement and habit formation.
For most app categories, the average 30-day retention rate falls between 4-6%, with shopping and e-commerce apps averaging around 5.6%. News and magazine apps tend to perform better, sometimes achieving retention rates above 9%, while education apps often struggle to maintain even 2% of users at this stage.
4. Three-month churn rate
This metric measures the percentage of users who persist after the crucial three-month mark, providing insights into long-term retention potential.
The global average for three-month retention is approximately 29%, implying that about 71% of users disengage during this period. Users who remain active beyond three months are significantly more likely to become long-term, loyal users.
5. App abandonment rate
App abandonment rate specifically measures users who completely stop using an app after only a single session—they download, open once, and never return.
Research indicates that the app abandonment rate is around 25%, underscoring the challenge of making a lasting impression from the very first interaction. This metric is closely related to day-one churn but focuses specifically on single-session users.
Factors influencing mobile app churn rates
Multiple factors contribute to why users leave mobile apps. Understanding these factors helps you prioritize improvement efforts:
| Factor | Description | Impact level |
| Poor onboarding experience | Lengthy tutorials, confusing interfaces, or lack of guidance frustrate new users | High |
| Lack of perceived value | Users don’t see benefits that match their expectations or needs | High |
| Technical issues | Crashes, bugs, slow loading times, and glitches erode trust | High |
| Complex navigation | Difficulty finding features or completing basic tasks | Medium-High |
| Excessive notifications | Too many or irrelevant push notifications annoy users | Medium |
| Aggressive monetization | Intrusive ads or premature payment requests | Medium |
| Competition | Better alternatives in the market lure users away | Medium |
| Target audience mismatch | Attracting users who don’t match your ideal customer profile | Medium |
| Poor customer support | Unresolved issues and lack of help options | Medium |
| Missing expected features | App doesn’t deliver what users anticipated | Medium |
What is a good churn rate?
Achieving zero churn is an unattainable goal for any mobile app—some level of user attrition is simply inevitable. The average app loses approximately 77% of its daily active users within the first three days after installation.
For most mobile apps, an annual churn rate between 4% and 7% is generally considered manageable and healthy. However, what constitutes a “good” churn rate varies significantly by industry, app category, and business model:
- Subscription apps typically aim for monthly churn rates below 5%, with rates under 3% considered excellent.
- Gaming apps often experience higher acceptable churn due to the nature of casual gaming behavior.
- Utility apps may tolerate higher churn if they serve specific, occasional needs.
- Social and communication apps generally require lower churn to maintain network effects.
The most meaningful benchmark is your own historical data. Track your churn rate over time and focus on consistent improvement rather than comparing against external benchmarks that may not reflect your specific market conditions.
When evaluating your churn rate, consider these questions:
- How does your current churn compare to previous periods?
- Are there seasonal patterns affecting your metrics?
- How does churn vary across different user segments?
- What’s the churn rate for users who complete onboarding versus those who don’t?
- How does churn differ between acquired users from various channels?
How to reduce churn rate?
Reducing churn requires a multi-faceted approach that addresses the various reasons users disengage. Here are proven strategies for improving retention and minimizing user loss.
1. Optimize your onboarding experience
The onboarding process is where most users churn, making it your highest-priority optimization area. A well-designed onboarding flow should guide new users to experience your app’s core value as quickly as possible.
Focus on showcasing your app’s primary benefits immediately, reducing the number of steps required to get started, and ensuring users reach their “aha moment” within the first session. Consider using progressive disclosure to introduce advanced features gradually rather than overwhelming new users with too much information upfront.
Interactive tutorials, contextual tooltips, and personalized walkthroughs can significantly improve early engagement. Track where users drop off during onboarding and continuously test improvements to those specific points.
2. Personalize the user experience
Modern app users expect personalized experiences tailored to their preferences and behavior patterns. Generic, one-size-fits-all approaches no longer suffice in a competitive marketplace.
Leverage behavioral data such as usage patterns, feature preferences, search history, and in-app actions to customize each user’s experience. This includes personalized content recommendations, relevant push notifications, customized offers, and adaptive user interfaces that highlight features most relevant to each user.
Segment your users into meaningful cohorts and develop targeted engagement strategies for each group based on their characteristics and behaviors.
3. Use push notifications strategically
Push notifications can be powerful re-engagement tools, but they require careful implementation. Poorly timed or irrelevant notifications are a leading cause of app uninstalls.
Send notifications at optimal times based on individual user behavior patterns, not arbitrary schedules. Ensure every notification provides genuine value—whether that’s relevant content updates, personalized offers, or timely reminders about incomplete actions.
Allow users to customize their notification preferences and respect those choices. Quality always trumps quantity; a few well-targeted notifications outperform frequent generic ones.
4. Implement effective re-engagement campaigns
Proactive re-engagement reaches users before they fully disengage. Monitor user activity patterns to identify those showing early signs of churn, such as decreased session frequency, shorter session lengths, or reduced feature usage.
For at-risk users, implement targeted campaigns that might include special offers, personalized content recommendations, feature highlights they haven’t explored, or simple check-in messages. In-app notifications can prompt users who haven’t visited recently about new content or features.
Consider implementing win-back campaigns for users who have already churned, offering incentives to return and addressing the potential reasons for their departure.
5. Leverage cohort analysis for insights
Cohort analysis divides users into groups based on shared characteristics or acquisition dates, allowing you to identify patterns that correlate with higher or lower retention.
Compare cohorts to discover which acquisition channels bring the most engaged users, which onboarding variations produce better retention, how product changes affect different user segments, and which user behaviors predict long-term engagement.
Key questions to explore through cohort analysis include:
- Which acquisition channels deliver users with the highest retention?
- What actions do retained users take in their first session?
- How quickly do successful users complete key activation events?
- Which features correlate with long-term engagement?
6. Continuously improve app performance
Technical issues are a significant driver of churn. Users have little patience for apps that crash, load slowly, or behave unpredictably.
Regularly audit your app’s performance, including load times, memory usage, battery consumption, and crash rates. Prioritize fixing user-reported bugs promptly—responsiveness to issues demonstrates that you value user feedback.
Monitor your app store ratings and reviews for patterns in technical complaints, as these often reveal problems affecting larger numbers of users who don’t report issues directly.
7. Collect and act on user feedback
Direct user feedback provides invaluable insights into why users churn and what improvements would keep them engaged.
Implement multiple feedback channels: in-app surveys (timed appropriately), app store review responses, support ticket analysis, and direct user interviews when possible. Ask churned users specifically why they left when you can reach them.
Most importantly, act on the feedback you receive and communicate those improvements back to users. When users see their suggestions implemented, they feel valued and become more invested in your app’s success.
Final thoughts
Churn rate is one of the most critical metrics for mobile app success, directly impacting revenue, growth potential, and long-term sustainability. While some level of churn is inevitable, understanding why users leave and implementing targeted strategies to address those reasons can dramatically improve your retention rates.
The key to reducing churn lies in a comprehensive approach: optimizing the onboarding experience to hook users early, personalizing engagement to maintain relevance, leveraging data and cohort analysis to identify at-risk users, and continuously improving your app based on user feedback and performance metrics.
Remember that reducing churn is not a one-time effort but an ongoing process of measurement, analysis, and optimization. By treating churn reduction as a core business priority and systematically addressing the factors that drive users away, you can build a more sustainable and profitable mobile app business.