ARPPU, or Average Revenue Per Paying User, measures the average revenue generated by users who actually make payments within your app. Unlike ARPU which includes all users, ARPPU focuses exclusively on paying customers – providing a clearer picture of how much value your monetizing users deliver. This metric is essential for subscription apps, freemium games, and any business where only a portion of users convert to paying customers.
What is ARPPU?
ARPPU stands for Average Revenue Per Paying User. It calculates the average amount of revenue generated by each user who makes a purchase, subscription payment, or other monetary transaction within a specified time period. By isolating paying users from the broader user base, ARPPU provides precise insight into how much your monetizing customers are worth.
Originally designed for subscription-based services, ARPPU has become a cornerstone metric across mobile gaming, SaaS applications, freemium apps, and e-commerce platforms. It helps businesses understand if their pricing structure is effective and how much loyal, paying customers are willing to spend.
The critical distinction is that ARPPU excludes non-paying users entirely. In freemium models where conversion rates typically range from 2-5%, this focus on paying users eliminates the noise created by the non-paying majority and reveals the true revenue potential of your monetization strategy.
For detailed implementation guidance, see Adapty’s ARPPU documentation.
| Characteristic | Description |
|---|---|
| User base | Only users who made at least one payment |
| Time frame | Typically monthly, but can be daily, weekly, or custom |
| Revenue sources | Subscriptions, IAP, one-time purchases |
| Primary focus | Monetization depth and pricing effectiveness |
| Best suited for | Freemium apps, subscription services, mobile games |
| Excludes | Non-paying users, ad revenue (unless combined) |
Why is ARPPU important?
ARPPU serves as a critical indicator of monetization health and customer value. Here’s why this metric matters:
| Benefit | Description | Business impact |
|---|---|---|
| Revenue insight | Shows how much paying users actually spend | Validates pricing models and monetization strategies |
| Customer valuation | Identifies high-value user segments | Enables precise resource allocation and targeting |
| Pricing validation | Indicates if pricing resonates with customers | Guides pricing optimization decisions |
| Whale identification | Helps identify and nurture top spenders | Maximizes revenue from highest-value users |
| Strategy optimization | Informs pricing, promotions, and IAP design | Drives revenue growth through data-driven decisions |
| Investor communication | Key KPI for demonstrating monetization efficiency | Attracts investment and builds confidence |
How to calculate ARPPU?
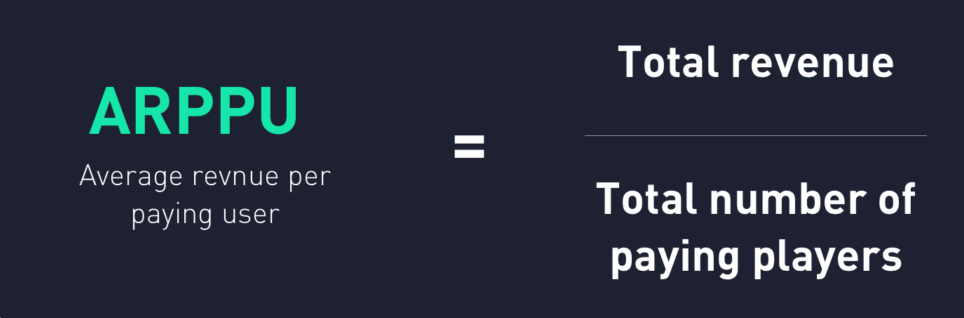
The ARPPU formula is straightforward:
| ARPPU = Total Revenue During Period X ÷ Total Number of Paying Users During Period X |
Basic calculation example
| Component | Value | Notes |
|---|---|---|
| Total monthly revenue | $50,000 | From subscriptions + IAP |
| Total paying users | 1,000 | Unique users who made at least one payment |
| ARPPU | $50.00 | Average revenue per paying user |
Time period considerations
| Time period | When to use | Considerations |
|---|---|---|
| Daily ARPPU | Testing promotions, A/B testing | High variability; same user counted each day they pay |
| Weekly ARPPU | Short-term trend analysis | Smoother than daily; captures weekly patterns |
| Monthly ARPPU | Standard reporting, benchmarking | Most common period; captures subscription cycles |
| Quarterly ARPPU | Strategic planning, investor reports | Smooths seasonal fluctuations |
Subscription app ARPPU calculation
For subscription-based apps, include Monthly Recurring Revenue (MRR) components:
| Revenue component | Include in ARPPU? | Notes |
|---|---|---|
| New subscribers | Yes | First-time paying users at full price |
| Existing subscribers | Yes | Ongoing monthly payments |
| Upgraded subscribers | Yes | Users moving to higher tiers |
| Discounted annual plans | Yes (monthly portion) | Prorate annual payments to monthly |
| Trial conversions | Yes (when first payment occurs) | Count from first actual payment |
| Refunds | Subtract | Reduce revenue by refunded amounts |
Key benefits of ARPPU
ARPPU offers several advantages for understanding and optimizing monetization:
1. Isolates monetization effectiveness
By focusing exclusively on paying users, ARPPU removes the dilution effect of free users. This provides a clear view of how well you’re monetizing the users who have already shown willingness to pay—your most valuable segment.
2. Validates pricing strategy
ARPPU directly reflects whether your pricing resonates with customers. A high ARPPU indicates that paying users perceive significant value and are willing to spend. A declining ARPPU may signal pricing issues or decreased perceived value.
3. Identifies whale potential
In gaming and freemium apps, a small percentage of “whale” users often generate the majority of revenue. ARPPU helps you understand the spending capacity of your paying segment and whether you’re capturing maximum value from high spenders.
4. Enables precise LTV prediction
ARPPU combined with retention data provides more accurate Lifetime Value (LTV) predictions for paying users. This is more actionable than LTV calculations that include users who never convert.
5. Guides acquisition strategy
By tracking ARPPU by acquisition source, you can identify which channels bring the highest-value paying users—not just the most users. This enables smarter budget allocation and higher ROI.
ARPPU vs. Related metrics
Understanding how ARPPU relates to other revenue metrics helps you choose the right KPI for each situation.
| Metric | Full name | Formula | User base | Time focus | Primary use |
|---|---|---|---|---|---|
| ARPPU | Average Revenue Per Paying User | Revenue ÷ Paying Users | Paying only | Period-based | Monetization depth |
| ARPU | Average Revenue Per User | Revenue ÷ All Users | All users | Period-based | Overall monetization |
| ARPDAU | Average Revenue Per Daily Active User | Daily Revenue ÷ DAU | Active users | Daily | Daily monetization tracking |
| LTV | Lifetime Value | Total user revenue over lifetime | All users | Lifetime | Long-term user value |
| MRR | Monthly Recurring Revenue | Sum of all recurring payments | Paying subscribers | Monthly | Subscription business health |
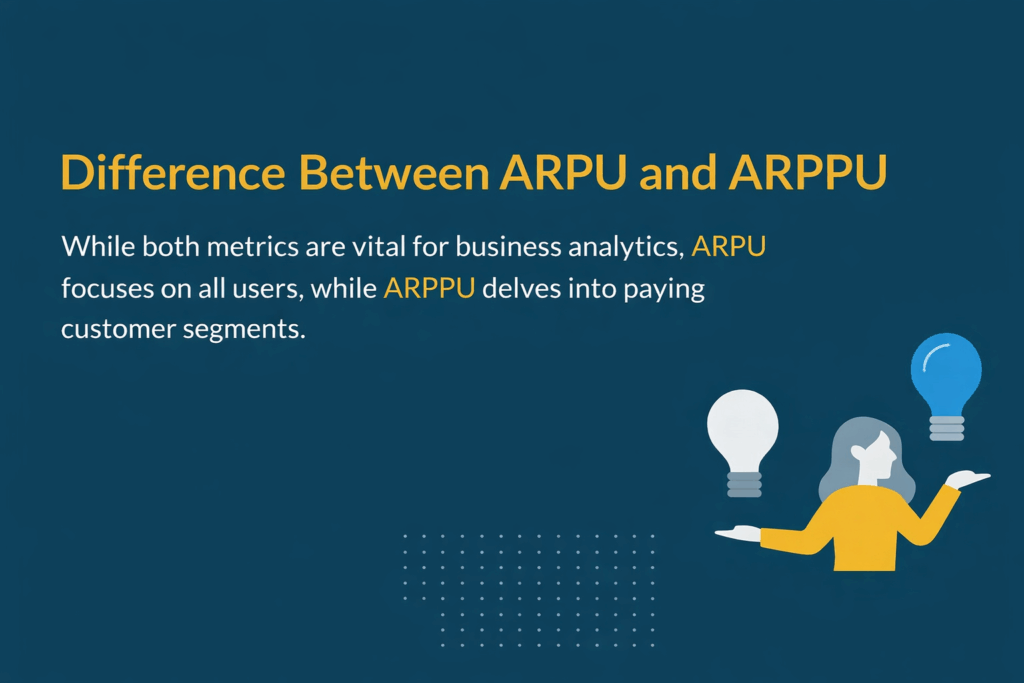
ARPPU vs. ARPU: Key differences
| Aspect | ARPPU | ARPU |
|---|---|---|
| Includes | Paying users only | All users (paying + non-paying) |
| Free users | Excluded | Included (dilutes average) |
| Ad revenue | Typically excluded | Often included |
| Best for | Pricing optimization | Overall monetization health |
| Sensitivity | Highly sensitive to pricing changes | Sensitive to conversion rate changes |
Example comparison:
- Total revenue: $10,000
- Total users: 10,000
- Paying users: 200 (2% conversion)
- ARPU: $10,000 ÷ 10,000 = $1.00
- ARPPU: $10,000 ÷ 200 = $50.00
The 50x difference shows why these metrics serve different purposes.
What is a good ARPPU for a mobile app?
ARPPU varies significantly by app category, business model, and market. Here are industry benchmarks:
| App category | Typical monthly ARPPU | Notes |
|---|---|---|
| Mobile gaming (casual) | $5 – $20 | IAP-focused, varies by genre |
| Mobile gaming (mid-core) | $15 – $50 | Higher engagement and spending |
| Mobile gaming (hardcore/strategy) | $30 – $100+ | Dedicated players, high IAP |
| Social casino | $20 – $70 | High whale concentration |
| Dating apps | $15 – $40 | Subscription + premium features |
| Streaming/Media | $8 – $15 | Subscription-based |
| Fitness apps | $10 – $25 | Subscription-based |
| Productivity/SaaS | $20 – $100+ | Depends on B2B vs. B2C |
| E-commerce apps | $30 – $80 | Transaction-based |
Factors affecting ARPPU
| Factor | Higher ARPPU | Lower ARPPU |
|---|---|---|
| Platform | iOS (typically 1.5-2x higher) | Android |
| Geography | North America, Western Europe, Japan | Emerging markets |
| App maturity | Established apps with loyal users | New apps building user base |
| Monetization model | Multiple revenue streams | Single revenue source |
| User engagement | High engagement, daily use | Casual, occasional use |
| Pricing tiers | Multiple tiers with upsell paths | Single pricing option |
How can you increase ARPPU?
Improving ARPPU requires strategies focused on maximizing value from paying users:
Strategy 1: Optimize pricing structure
| Tactic | Description | Expected impact |
|---|---|---|
| Tiered pricing | Offer multiple price points (Basic, Pro, Premium) | Captures different willingness-to-pay levels |
| Usage-based pricing | Charge based on consumption or seats | Aligns price with value received |
| Price point testing | A/B test different price levels | Finds optimal price-to-conversion balance |
| Annual discounts | Offer discounts for longer commitments | Increases upfront revenue, improves retention |
| Dynamic pricing | Adjust prices based on segments or behavior | Maximizes revenue per segment |
Strategy 2: Remove revenue ceilings
Don’t cap spending potential for your highest-value users:
| Approach | Implementation | Benefit |
|---|---|---|
| Premium tiers | Add higher-priced plans with exclusive features | Captures whale spending |
| Add-ons and extras | Offer additional purchases beyond base subscription | Incremental revenue |
| Consumable IAP | Repeatable purchases (credits, coins, boosts) | No spending ceiling |
| Customization options | Personalized features at additional cost | Higher perceived value |
Strategy 3: Convert non-payers to payers
| Tactic | Description | Notes |
|---|---|---|
| First-purchase incentives | Discounts or bonuses for initial purchase | Reduces friction to first payment |
| Limited-time offers | Time-sensitive deals creating urgency | Drives immediate conversion |
| Trial extensions | Offer extended trials for engaged users | Builds habit before paywall |
| Feature teasers | Show value of premium features before purchase | Demonstrates ROI of upgrading |
Strategy 4: Nurture and retain whales
Your top spenders deserve special attention:
| Approach | Implementation |
|---|---|
| VIP programs | Exclusive benefits, early access, recognition |
| Personal outreach | Dedicated support, feedback sessions |
| Exclusive content | Content or features only for top spenders |
| Community building | Private groups, events for high-value users |
Strategy 5: Personalize offers
| Personalization type | Example | Impact |
|---|---|---|
| Behavioral targeting | Recommend IAP based on in-app behavior | Higher conversion, larger purchases |
| Segment-specific pricing | Different offers for different user segments | Optimized pricing per segment |
| Predictive offers | AI-driven recommendations | Increased relevance and conversion |
| Dynamic bundles | Customized package recommendations | Higher average transaction value |
Strategy 6: Maximize delivered value
| Approach | Result |
|---|---|
| Continuous feature improvement | Higher perceived value, justifies pricing |
| Premium-exclusive content | Clear differentiation from free tier |
| Better onboarding for payers | Faster time-to-value, higher satisfaction |
| Proactive support | Reduced churn, higher lifetime spend |
What are the limitations of using ARPPU?
While ARPPU is valuable, it has important limitations to consider:
Ignores conversion rate impact
Increasing ARPPU through higher prices may reduce conversion rates. A doubled ARPPU with halved conversions yields similar total revenue but with a smaller, more concentrated customer base—which may increase risk.
Doesn’t reflect total revenue potential
ARPPU focuses only on paying users and ignores the revenue potential from converting more free users. A business with low ARPPU but high conversion may outperform one with high ARPPU but low conversion.
Time period sensitivity
ARPPU varies significantly based on the time period measured. A user making one purchase per month will appear in monthly ARPPU but not in daily ARPPU on days they don’t purchase. Ensure consistent time periods when comparing.
Excludes ad revenue
Traditional ARPPU focuses on direct user payments and excludes advertising revenue. For apps with significant ad monetization, this provides an incomplete picture. Consider tracking ARPPU and ad revenue separately.
Can mask whale dependency
A high ARPPU driven by a few whale users creates concentration risk. If those whales churn, revenue drops dramatically. Analyze ARPPU distribution, not just the average.
Doesn’t account for acquisition costs
ARPPU doesn’t reflect how much it cost to acquire paying users. High ARPPU from expensive acquisition channels may be less profitable than moderate ARPPU from organic sources.
Mitigation strategies
| Limitation | Mitigation |
|---|---|
| Ignores conversion | Track ARPPU alongside conversion rate |
| Incomplete picture | Monitor ARPU for overall monetization |
| Time sensitivity | Use consistent time periods; track trends |
| Excludes ads | Track separate metrics for ad revenue |
| Whale dependency | Analyze revenue distribution and concentration |
| Ignores costs | Calculate ROI using ARPPU minus CAC |