Avatarify
Feeld
Highlights
- 12 A/B tests across 5 apps in 3 months
- MRR up 28% over the testing period
- One non-marketer ran the entire process
AppDevLabs builds subscription apps: utilities, sports, and media. Five apps in the portfolio. The top one or two get attention. The others run on whatever pricing was set at launch — sometimes months ago, sometimes longer.
The portfolio was generating tens of thousands in MRR across five apps. Three months later, after 12 experiments and zero new hires, MRR was up 28%.
That’s not unusual for a small studio. One person handles analytics, pricing decisions, and experiments across all five apps. The flagship gets optimized. The rest sit at prices nobody has had time to question, generating less than they could, every day. The team knew it. They just didn’t have a plan for what to do about it.
The problem with running five apps and optimizing one
The team already used Adapty’s A/B testing. The problem was deciding what to test, on which app, and in what order.
With five apps across different categories, each with its own audience and competitive landscape, the number of possible experiments was large. Raise prices on the utilities app? Add a tier to the entertainment app? Change the paywall layout on the media app? Every decision required competitive research the team didn’t have time to run.

So the experiments didn’t happen. Or they happened slowly, one at a time, on whichever app someone had a hunch about. The portfolio sat.
From blank page to prioritized experiment queue
Autopilot gave the team a starting point for each app: a short list of what to test first, ranked by expected impact, with the reasoning behind each recommendation.
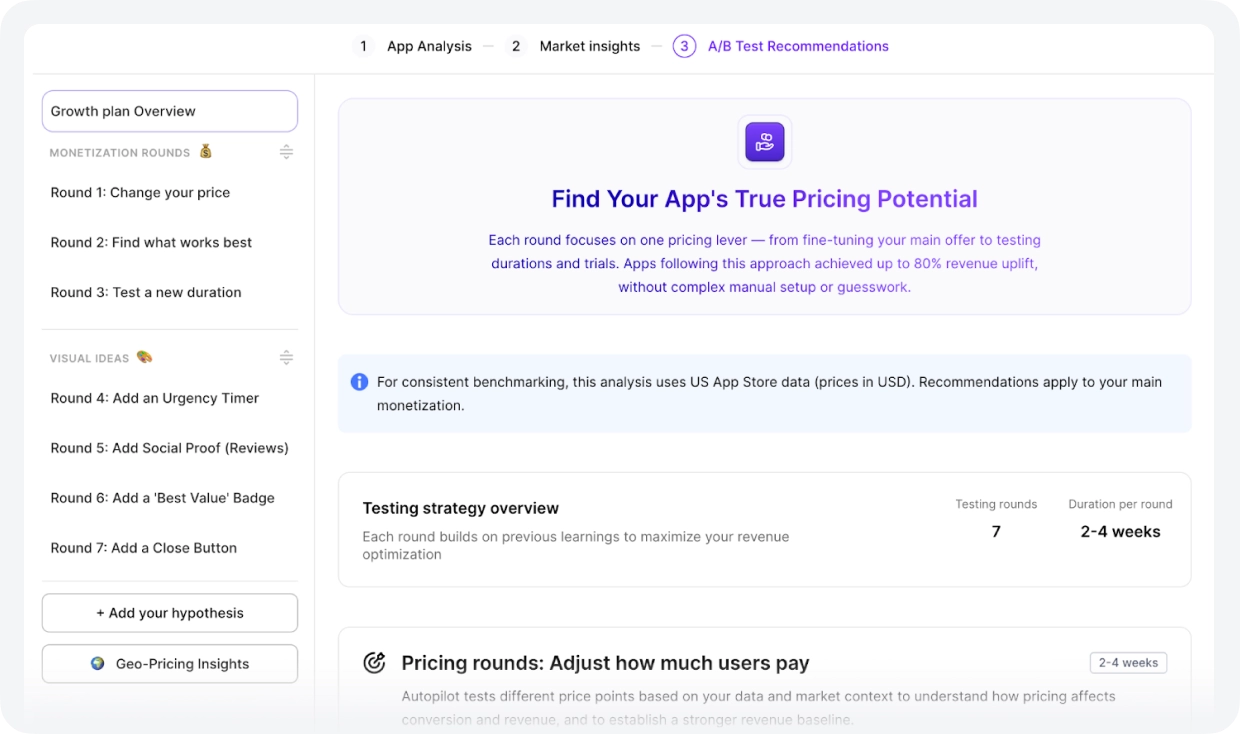
To build that list, Autopilot analyzed each app’s current pricing, benchmarked it against competitors in the same category, and compared performance against industry averages. The output was specific to where each app sat in its market.
Two things changed immediately. The team stopped manually researching what similar apps charge. And experiments stopped stalling between rounds — finish one test, get the next recommendation. For one person running five apps, that second part matters as much as the first.
The studio’s role shifted. Instead of figuring out what to test, they approved recommendations and shipped. Autopilot handled the analysis, the benchmarking, and the sequencing. AppDevLabs made the calls.
What three months of portfolio-wide testing looked like
Over December 2025 through February 2026, the team ran 12 A/B tests across five apps. One person managed the entire process. The flagship entertainment app went through three full sequential rounds, each building on the previous winner.
Of the 8 tests that reached statistical significance, 5 were wins. 63% — strong for pricing work, where even small moves can hurt conversion.
The more important number: Autopilot gave a different recommendation for every app. One needed a 67% price increase. Another needed a cut. A third needed a new tier. That’s not something a studio can figure out manually across five apps without a dedicated analyst per app — the competitive research alone would take weeks. Autopilot ran it continuously, in the background, and surfaced what each app actually needed.

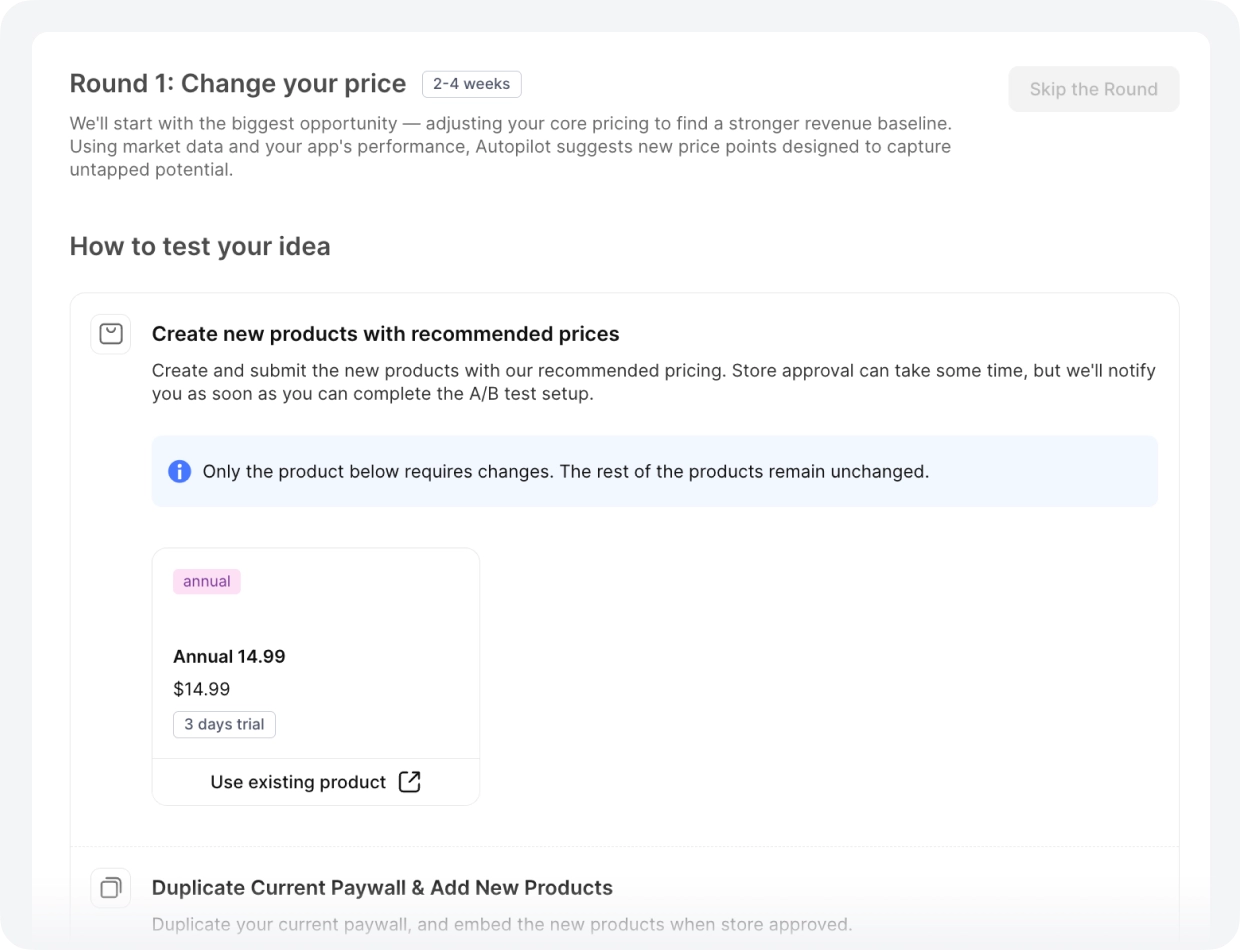
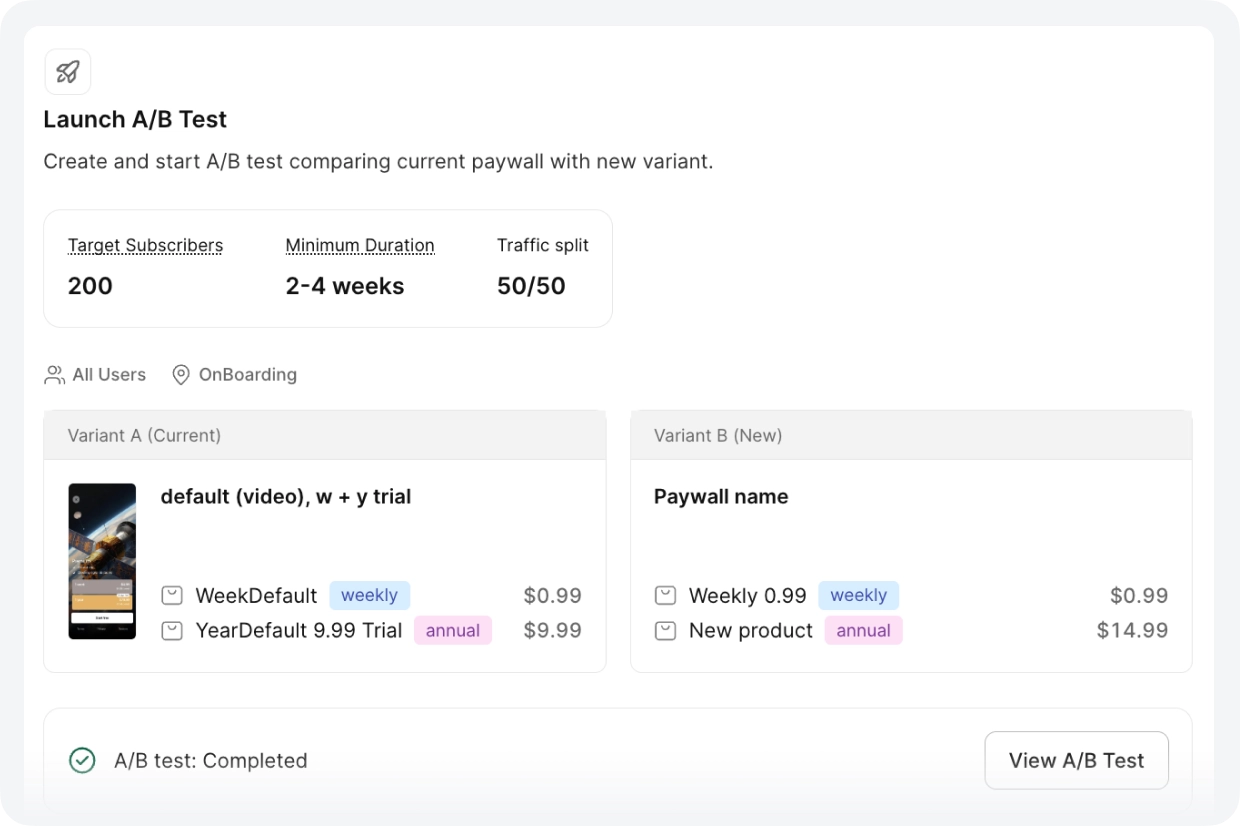
Flagship entertainment app (~$30K MRR): $10 sitting on every annual transaction
The app’s annual plan was priced at $14.99. Autopilot’s competitor analysis showed the category average sat at $24.99. The team was collecting $10 less per subscriber than the market would support. They tested $24.99. Conversion held. The price increase stuck.
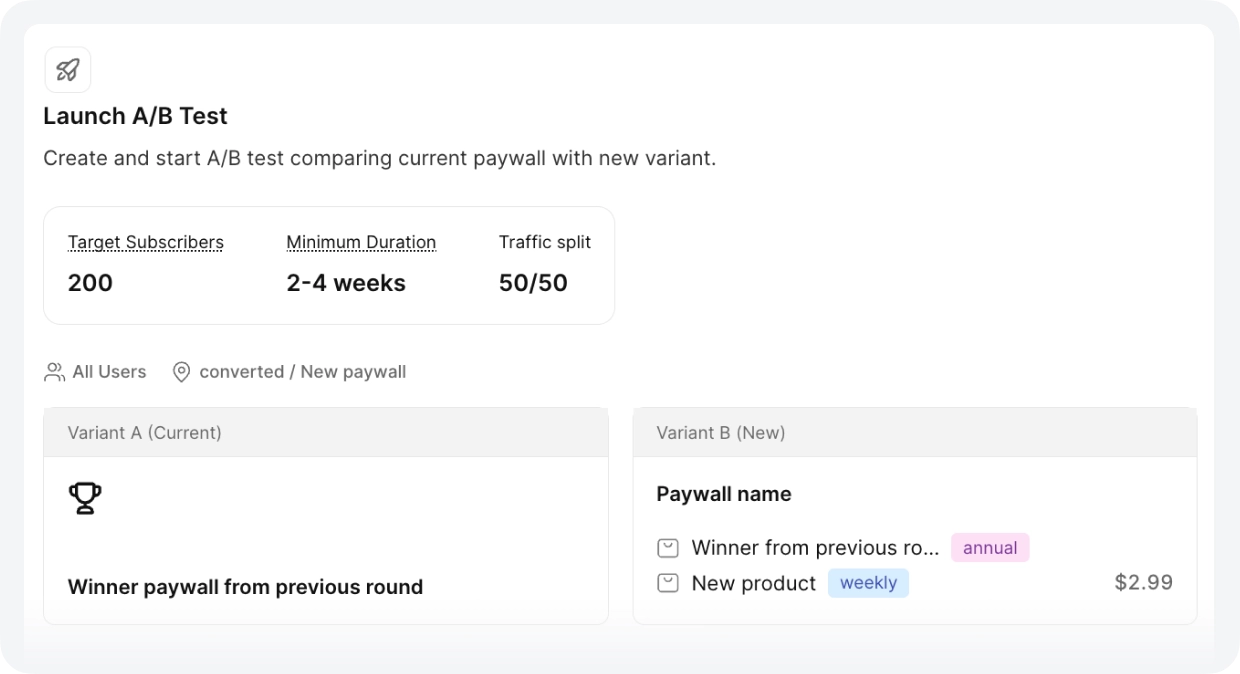
Same app: users were choosing weekly when the team assumed annual
After the annual win, Autopilot recommended adding a $3.99 weekly plan. The team ran the test with a 79/21 split between annual and weekly. But the more useful finding was what happened next: whenever the weekly price changed, annual purchases moved in the opposite direction.
Utilities app: underpriced by $5 against every competitor
At $9.99/year in a category where competitors charged $14.99, this app left $5 on every annual transaction. Autopilot flagged it. The team tested $14.99 — a 50% increase. The test won at 99% probability. Conversion didn’t move.
Media app: overpriced, and Autopilot said so
At $19.99/year, this app sat above the category average. The recommendation went the other direction: test $14.99. More users subscribed at the lower price, and total revenue increased. 406 purchases, 95% probability to be best.
Same media app: why the team stopped assuming prices travel across markets
A weekly price increase from $1.99 to $2.99 in Europe. The same change failed for the entertainment app in the UK. The team now runs separate tests by market rather than applying one global price, because the data shows the gap between what European and UK users will pay isn’t predictable from first principles.
The iterative approach
No single test made the difference. The cadence did. Each completed experiment fed into the next: the winner became the new baseline, Autopilot generated a new challenger. The flagship went through three rounds in three months — a new weekly tier, then annual pricing adjustments, then paywall ordering experiments. Each round built on the last.
For one person managing five apps, the gap between experiments is the real bottleneck. Not running the test and deciding what comes next. Autopilot closed that gap.
Same logic, different market, different outcome
After the first wins, the team used Adapty’s segmentation to run different prices in different geographies. The U.S. was the primary testing ground. When a result landed there, the team ran a comparable test for UK or European audiences. Sometimes the outcome held. Sometimes it didn’t.
Running separate tests by country lets the team price each market on its own data, without betting the portfolio on a single global assumption.
What a one-person operation can run in three months
AppDevLabs didn’t hire a growth team. They didn’t bring in a pricing consultant. They connected Autopilot to the workflow they already had, and it handled the parts that were keeping experiments from happening: competitive analysis, benchmarking, and deciding what to test next.
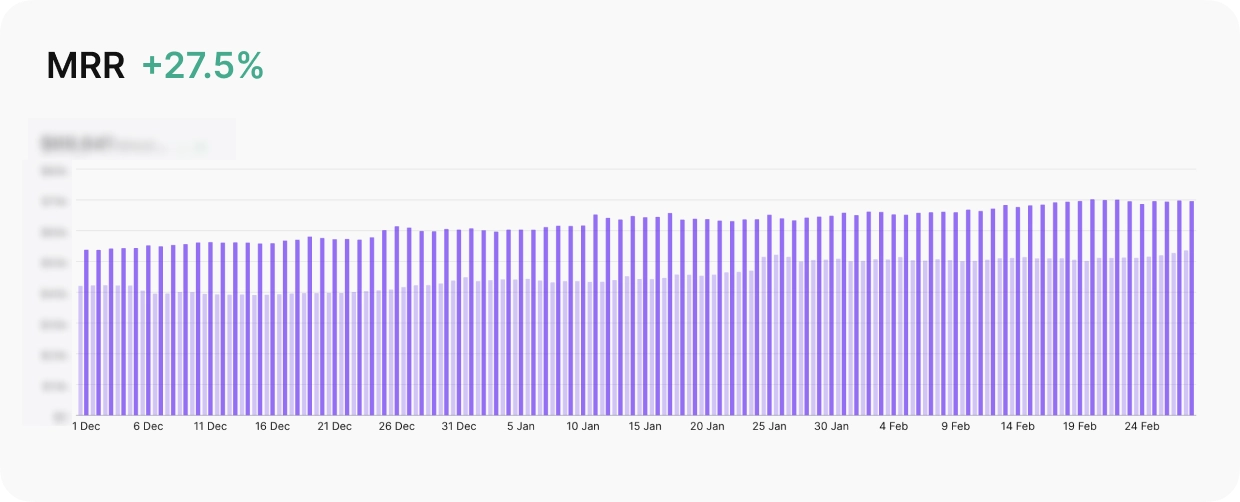
up 27.5% across three months of testing.
The team approved. The results came in. Twelve experiments across five apps, 63% of them winners. MRR up 28% over the testing period. All managed by one person who isn’t a marketer.