In-app subscription benchmarks for Utilities apps

TL;DR:
- Utilities leads all categories in 12-month LTV with trials at $68.90 — the highest of any category in the report
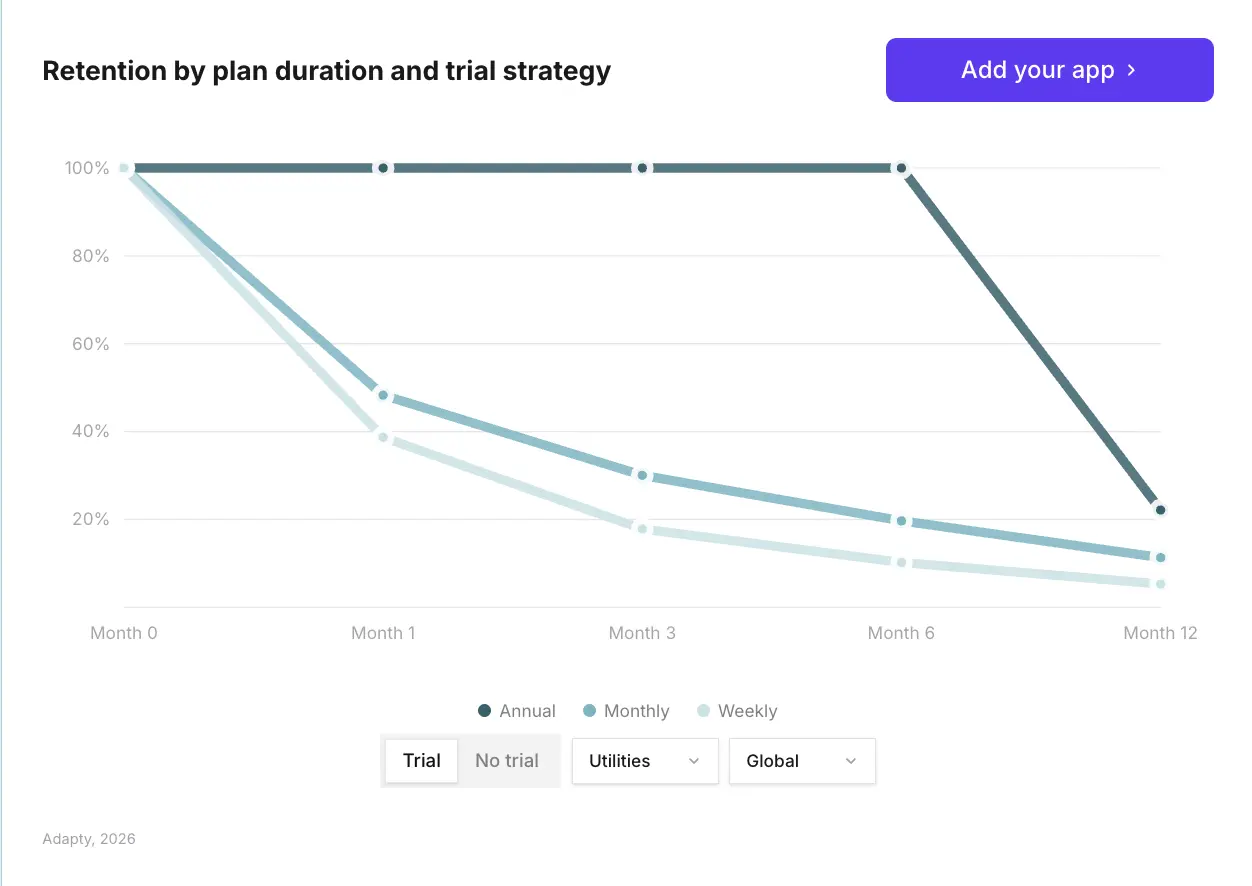
- Weekly plans drive the majority of Utilities revenue — and Utilities leads in one-year retention on annual plans at 22.1%
- Trial adoption in Utilities grew faster than any other category — from 78.0% to 84.7% in one year
- European Utilities annual plans saw a 70.5% price increase over two years — the largest pricing jump of any category-region combination in the report
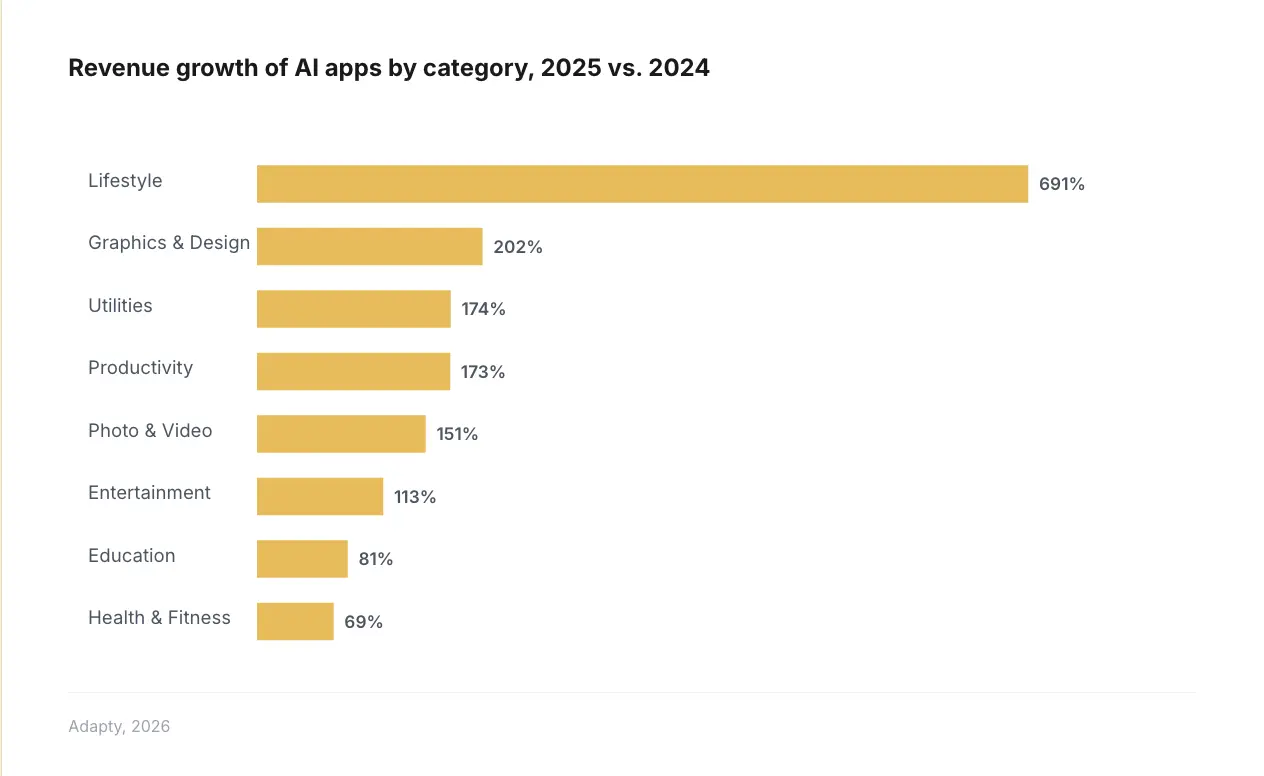
- Utilities AI apps grew revenue 174% YoY — the third fastest of any category
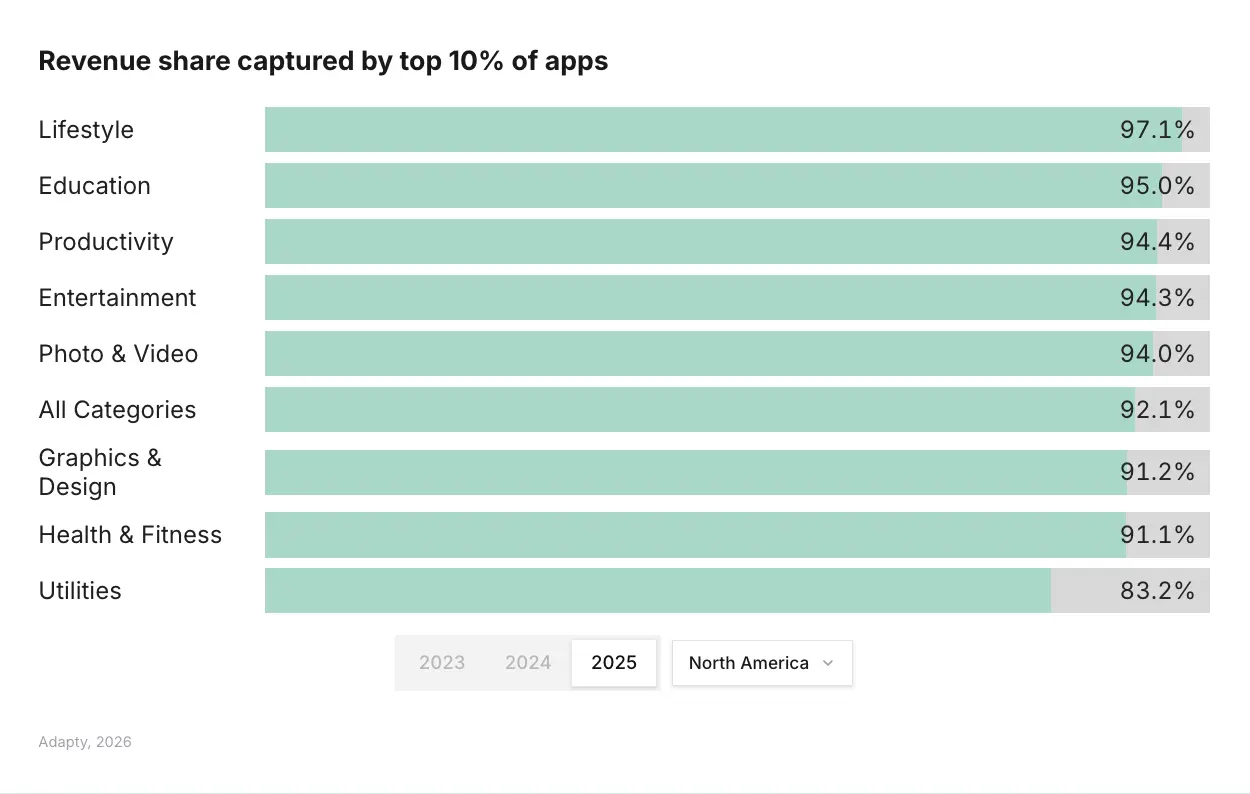
- Utilities ranks among the least concentrated categories: 92.6% of revenue goes to the top 10%, vs. 97.9% in Lifestyle
Utilities is one of the most commercially reliable categories in the app store. Users come with a specific problem, the app solves it, and they stay. That behavioral pattern shows up clearly in the numbers: Utilities leads all categories in first-renewal retention at 58.1% and tops the 12-month LTV chart for trial users at $68.90.
The category is also evolving fast. Trial adoption grew faster here than anywhere else in 2025. European pricing jumped 70.5% over two years on annual plans. AI-powered Utility apps are up 174% YoY. If you build or grow a Utility app, the benchmarks below are your baseline.
How does Utilities LTV compare to other categories?
Utilities ranks second overall in average 12-month LTV across plans at $46.30 — directly behind Productivity ($46.97) and ahead of Education ($45.10). Install LTV, which measures revenue generated per new install over 12 months, sits at $1.09 for Utilities, making it the second-highest category globally alongside Education.
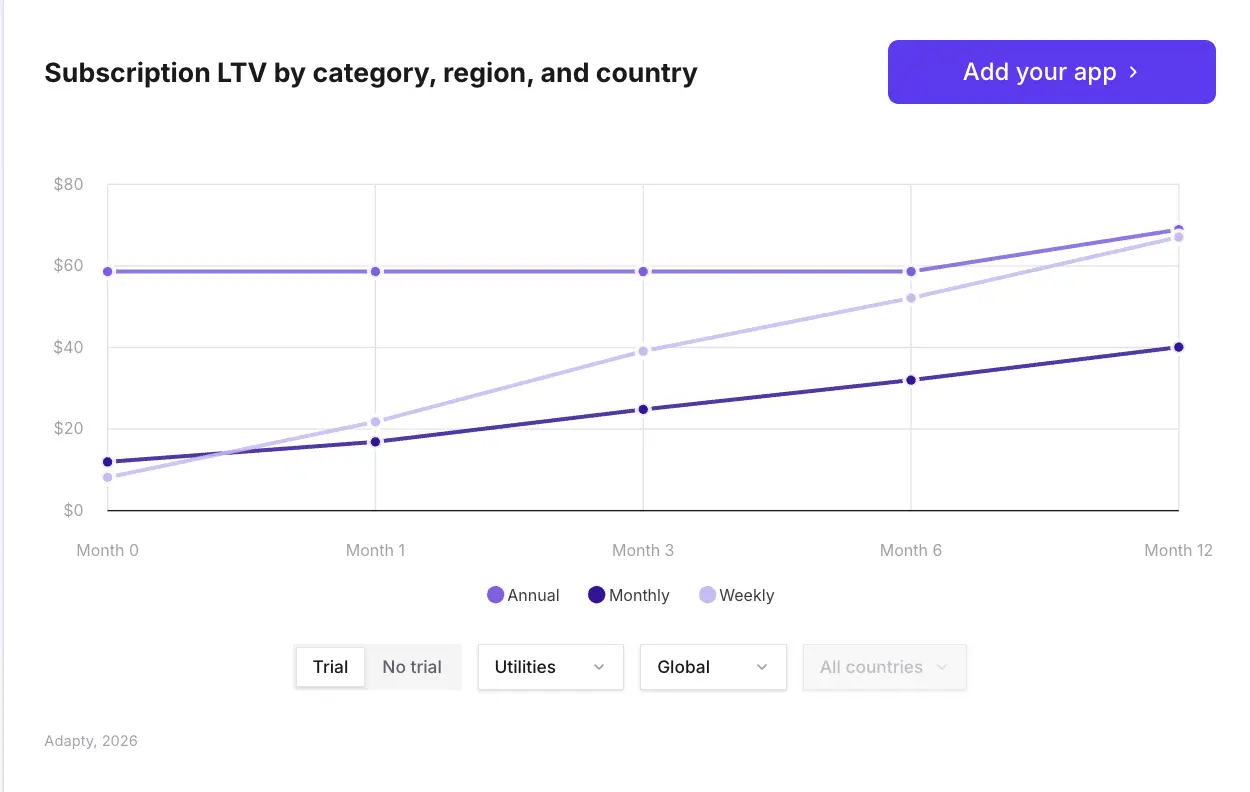
The trial effect in Utilities is unusually strong. Trial subscribers in the category generate $68.90 in 12-month LTV — the highest trial LTV of any category in the report. The logic is straightforward: Utility apps solve a concrete problem. Users who try the product and find it useful have a strong reason to stay. For a full breakdown of when trials help versus hurt across categories, see free trial vs. direct purchase: what $3B in app revenue says.
| Metric | Utilities benchmark (2026) |
| Average 12-month LTV (all plans) | $46.30 |
| Trial subscriber 12-month LTV | $68.90 |
| Install LTV (12-month global median) | $1.09 |
| First-renewal retention | 58.1% (category leader) |
| One-year retention on annual plans | 22.1% (category leader) |
North American install LTV runs roughly 2x the global average across most categories, and Utilities is no exception. If your Utility app is already performing in the US, the LTV floor is considerably higher than what global medians suggest.
What do Utility apps charge — and how is pricing shifting?
Utilities annual plans in Europe went up 70.5% over two years. That is the largest pricing increase of any category-region combination in the entire SOIS 2026 report. European prices for subscriptions across the market jumped 18% YoY in 2025, overtaking North America as the most expensive region — but nowhere did that shift land harder than Utility annual plans.
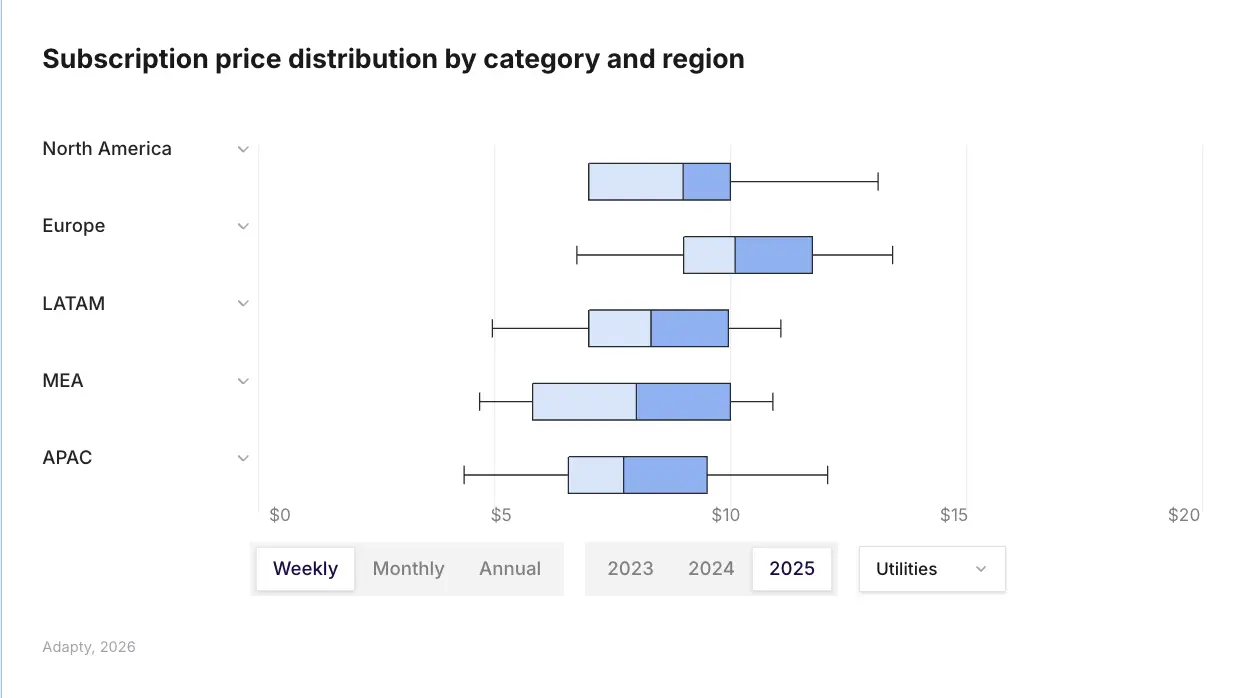
The global median for weekly plans sits at $7.48, monthly at $12.99, and annual at $38.42 — but those medians mask significant category-level variation. Utilities and Photo & Video apps charge considerably more for long-term access, with annual plans priced at roughly 6x the weekly rate on average. For context, a median annual plan globally costs just 3x the monthly price, meaning annual Utility subscribers get a proportionally larger discount on per-month cost than subscribers in most other categories.
Key pricing signal
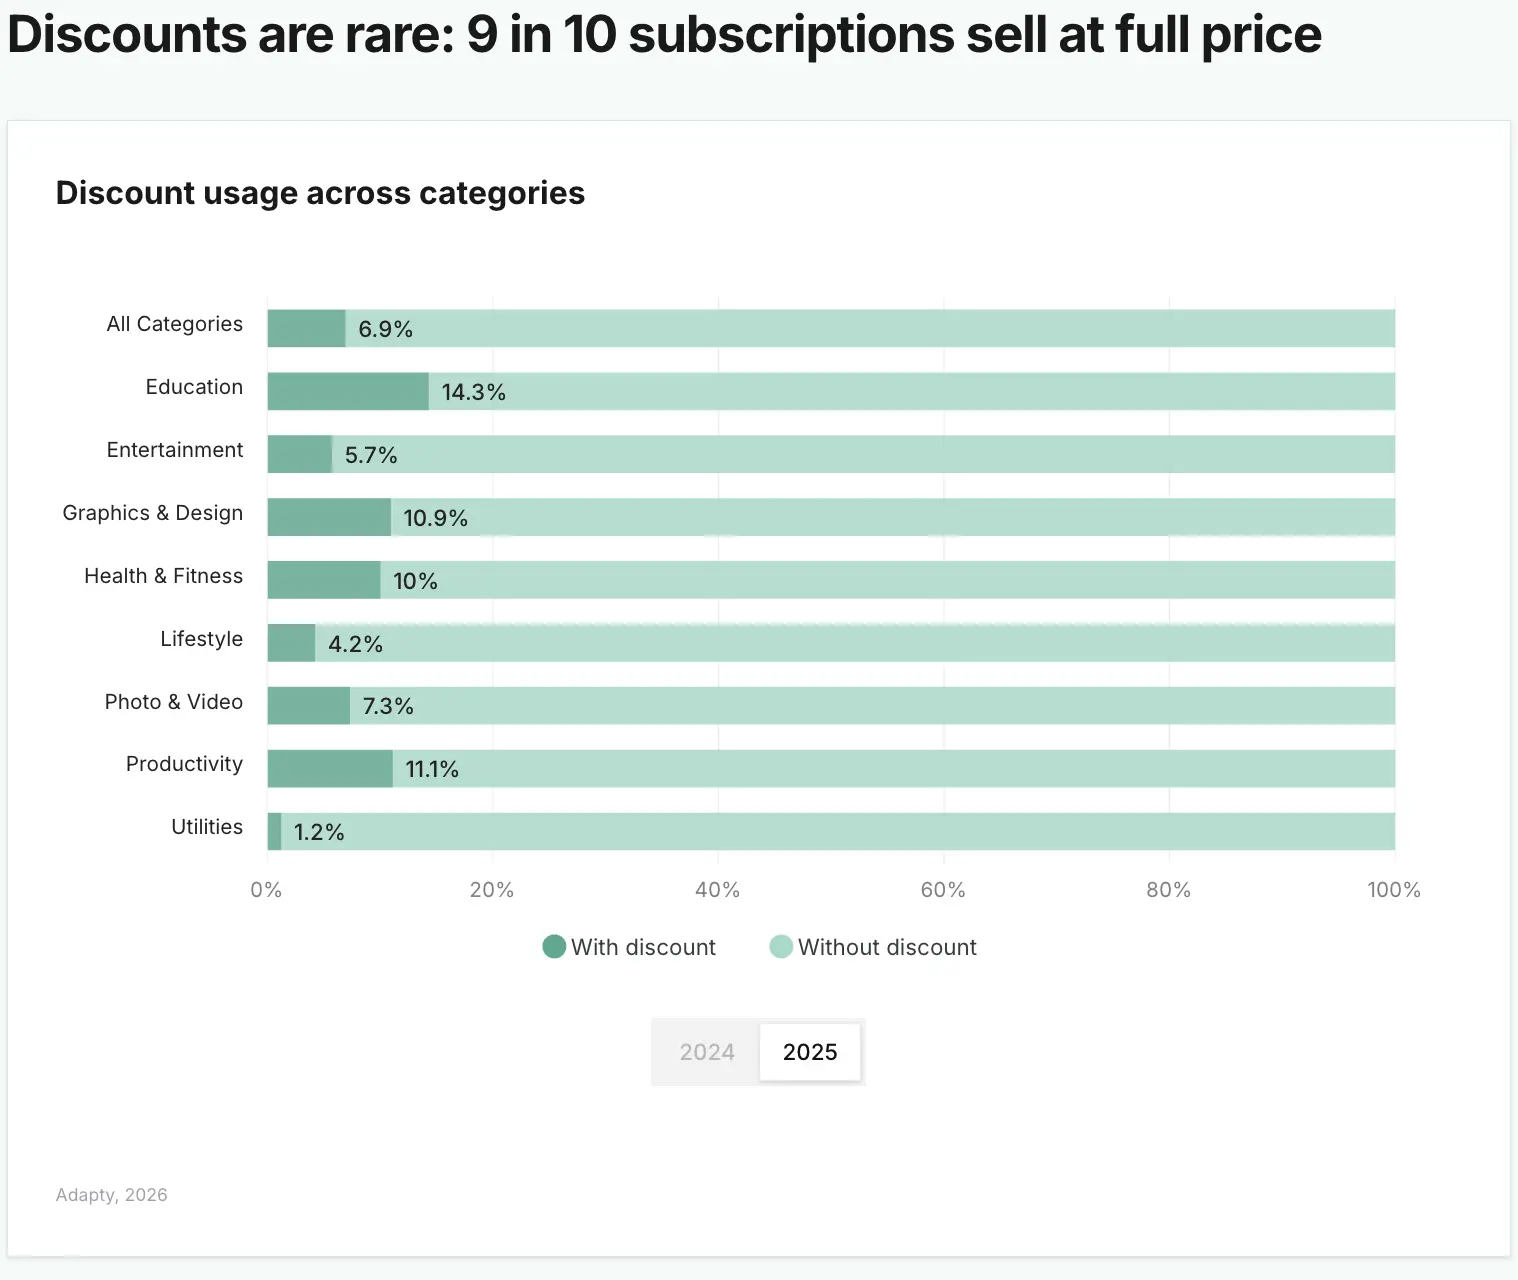
Utilities apps rarely discount. Only 1.2% of Utility apps use discount pricing — the lowest rate of any category in the report. The category's retention data suggests most users don't need a discount to stick around. If you build in Utilities, the data supports full-price monetization over promotional pricing.
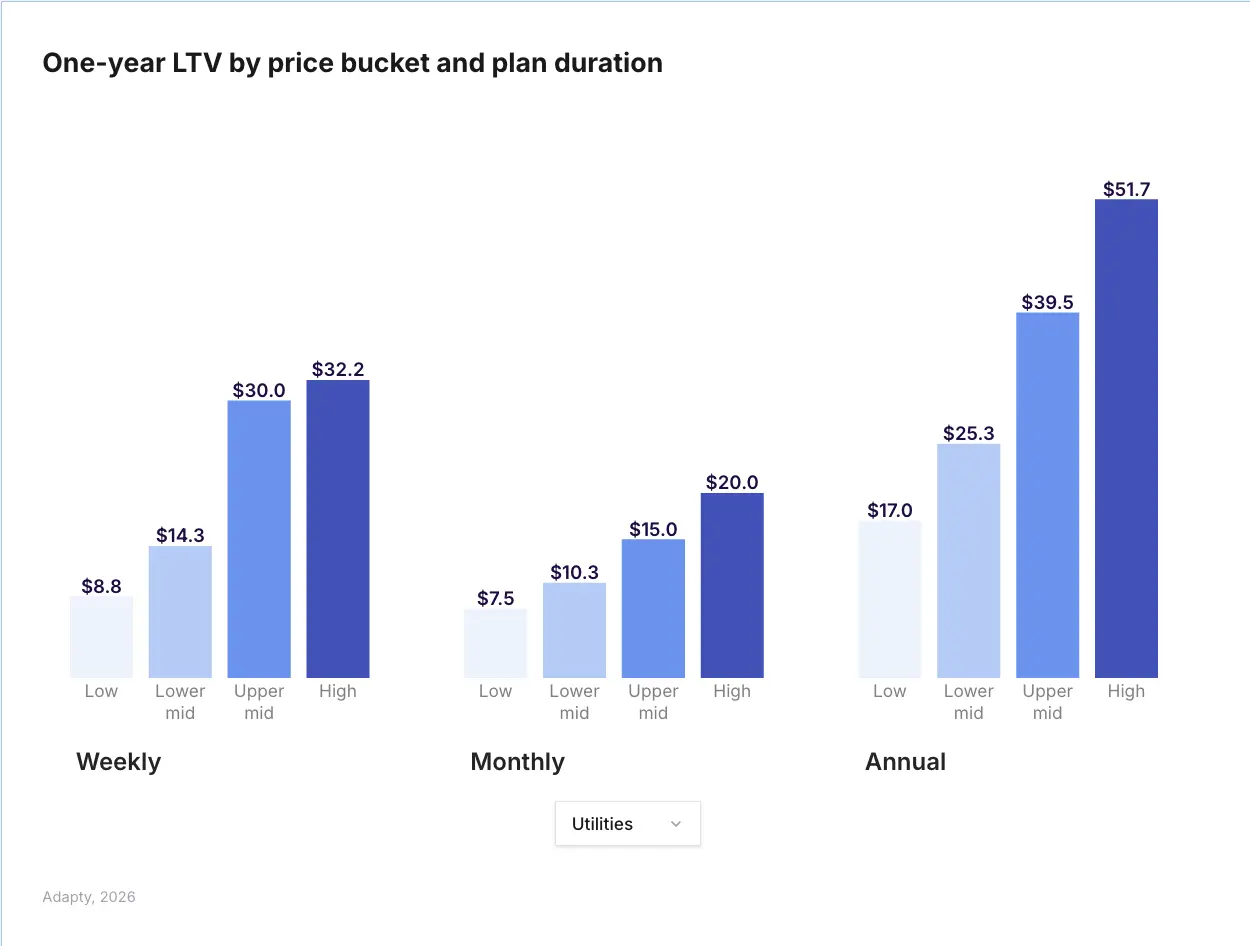
The high-price / high-LTV relationship holds strongly in Utilities. Apps in the top pricing quartile generate 3x more LTV than apps in the bottom quartile on weekly plans, and the pattern holds across monthly and annual plans too. Charging more in Utilities does not appear to hurt conversion or retention — the category's users are outcome-focused and will pay for a tool that solves their problem.
Do weekly or annual plans work better for Utility apps?
Weekly plans now generate 55.6% of all subscription revenue across the market, up from 43.3% two years ago. Utilities, alongside Productivity and Photo & Video, are leading that shift — these are the categories where weekly plans now drive the majority of revenue. For a data-driven breakdown of how each plan type performs on LTV, conversion, and retention, see weekly, monthly, or annual: which subscription plan to offer.
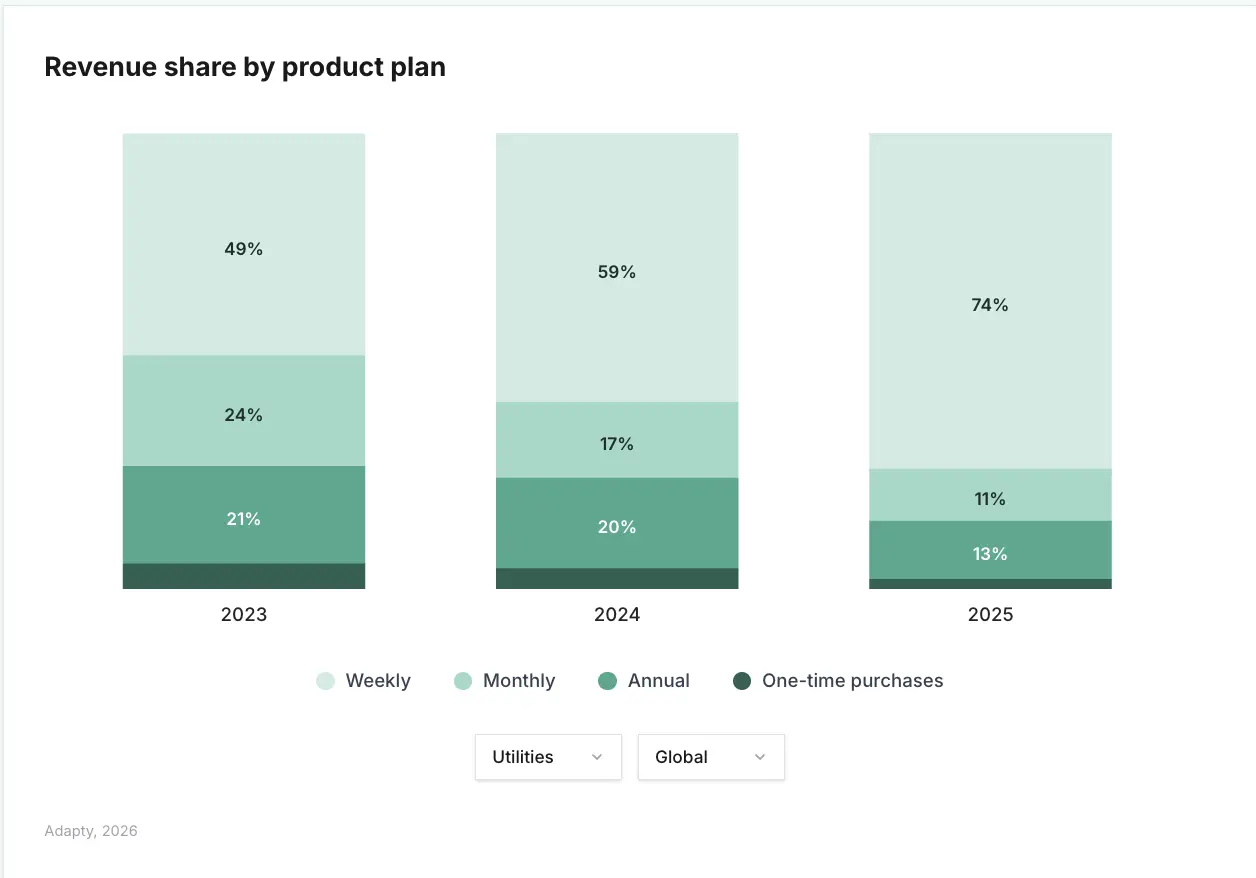
Annual plans tell a different story for Utilities than for most categories. Utilities leads all categories in one-year retention on annual plans at 22.1%. For users who commit to an annual subscription in a Utility app, the retention curve is the strongest in the market. The category logic holds: a useful daily tool earns that kind of long-term commitment.
| Plan type | Utilities revenue pattern |
| Weekly | The majority of revenue — consistent with the overall market trend |
| Annual | 22.1% one-year retention — highest of any category |
| Monthly | Solid baseline but weaker long-term retention than annual |
| One-time purchases | Growing market-wide (6.4% → 10.3%) |
One-time purchases and lifetime subscriptions are growing across the market — from 6.4% of revenue in 2023 to 10.3% in 2025. Utility apps have historically been candidates for this model given their tool-based nature. The full category-level breakdown is available in the interactive SOIS report.
Should Utility apps offer free trials?
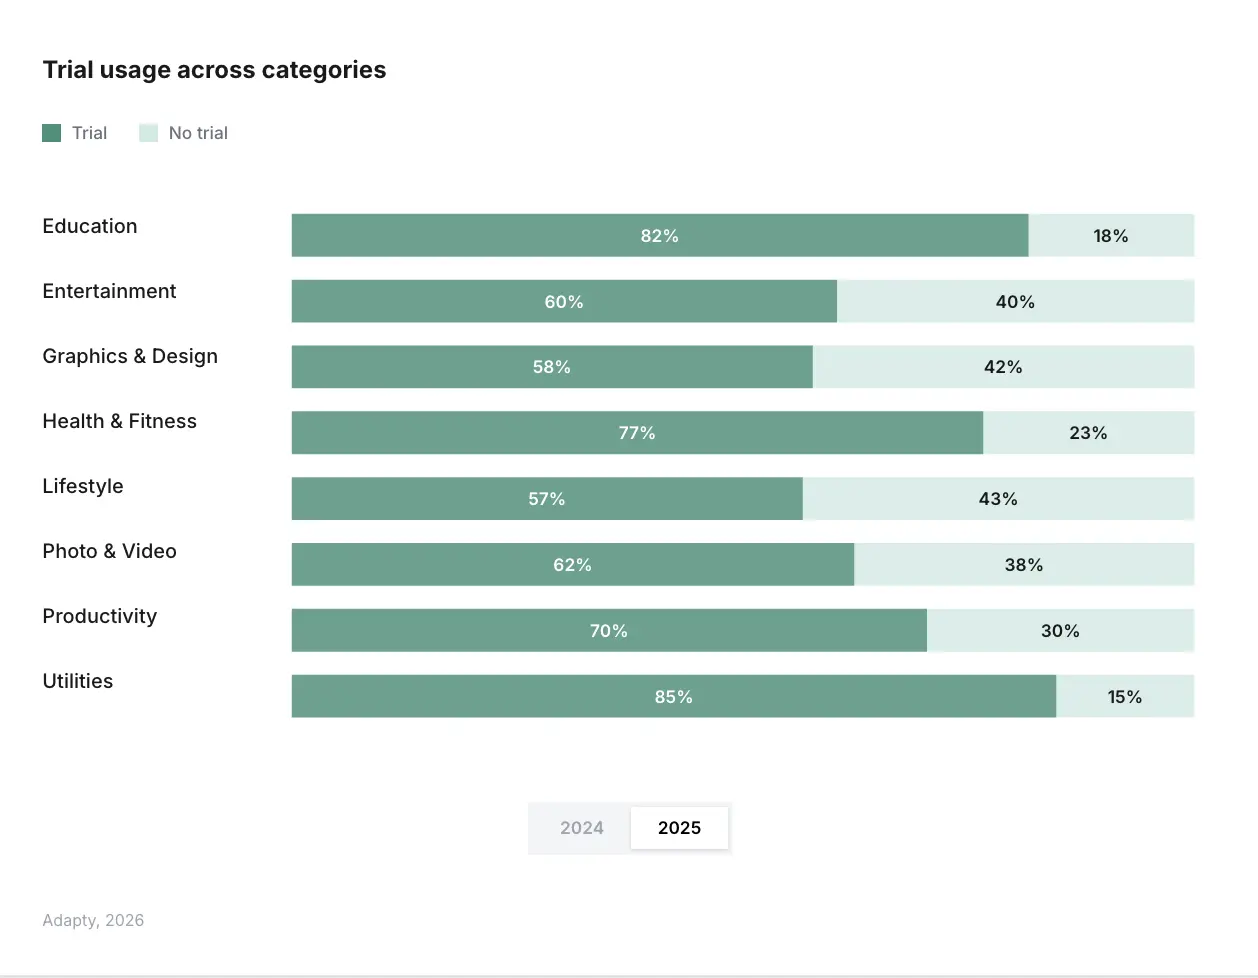
Yes — and the data is unusually clear on this. Utilities increased trial usage faster than any other category in 2025, going from 78.0% to 84.7% of apps offering trials. The category now has one of the highest trial adoption rates in the market.
The reason is visible in the LTV data. In Utilities, Health & Fitness, and Education, trials boost LTV for annual subscriptions. Trial users in Utilities generate $68.90 over 12 months — the highest trial LTV of any category. A well-designed trial lets users experience the core utility of the app, builds conviction, and converts into durable subscriptions. For benchmarks on what a healthy trial conversion rate looks like, see free trial conversion rates for in-app subscriptions.
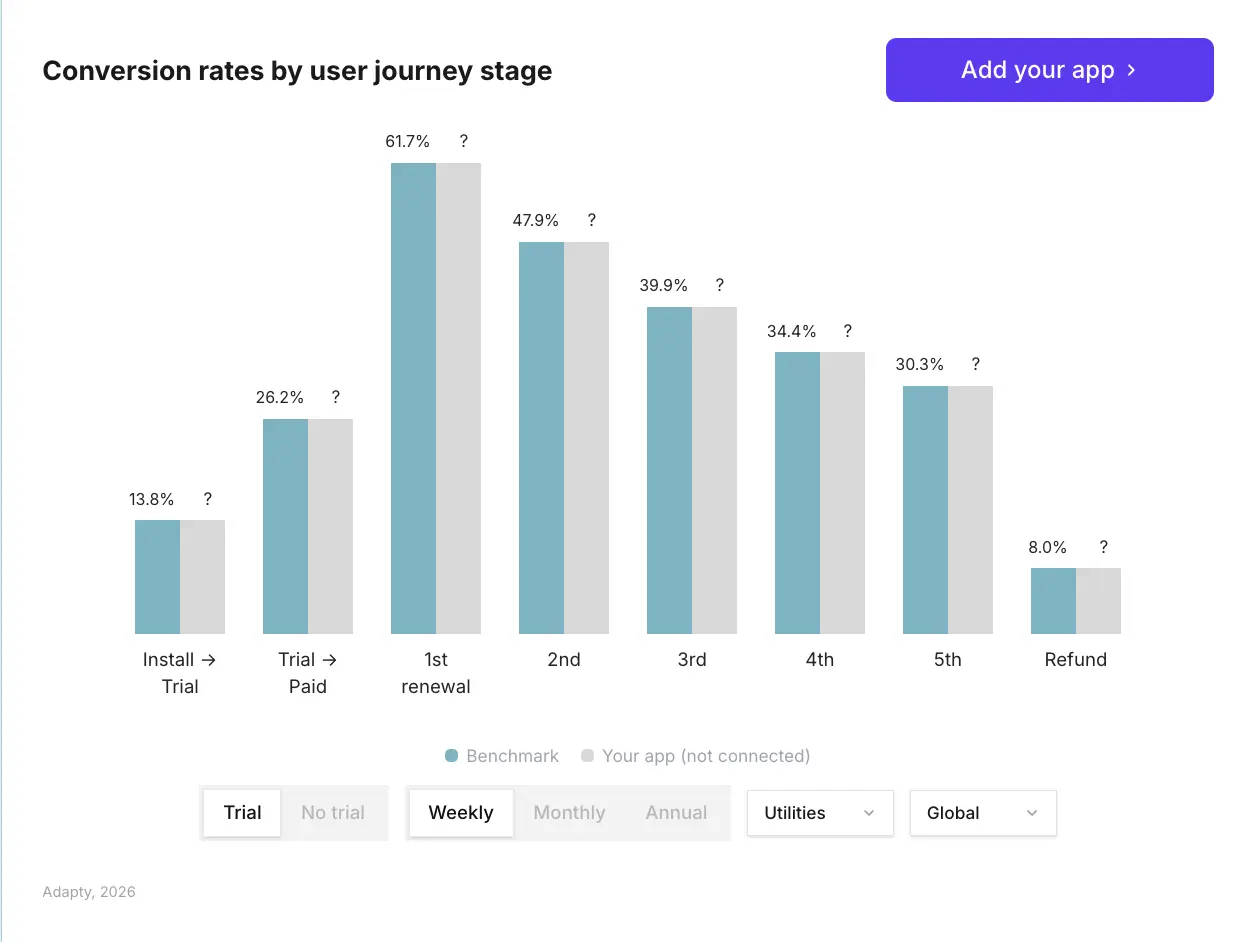
The global funnel benchmark sits at 13.8% install-to-trial and 26.2% trial-to-paid. The report's broad finding is that trial subscribers retain 1.4 to 1.7x better than direct buyers across all plan types. In Utilities, that uplift appears consistent with the category's strong retention profile.
One structural note: 90% of trial starts happen on Day 0. Your onboarding window to earn a trial commitment is the first session. After that, conversion probability drops significantly across all categories — Utilities included.
Paywall placement data
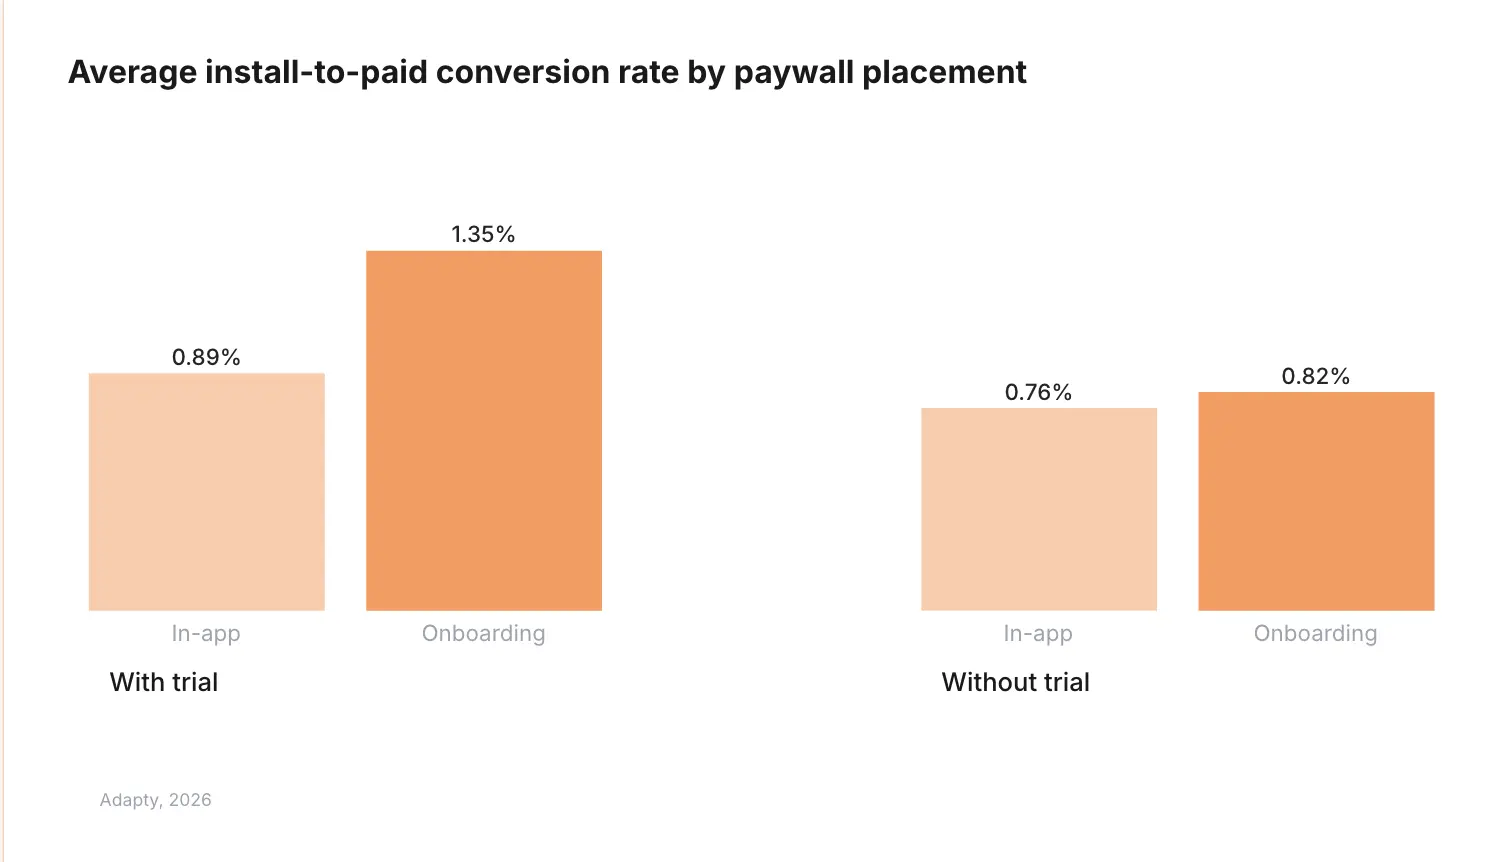
Onboarding paywalls with trials convert at the highest rate — 1.35% on average across the market. For Utility apps where the core value proposition is demonstrable quickly, onboarding paywall placement is worth testing against in-app placement.
What does retention look like for Utility apps?
Utilities leads all categories in first-renewal retention at 58.1%. For comparison, Health & Fitness sits at the bottom of the category retention table at 30.3%. The 27.8 percentage point gap between first and last-place categories is striking — and for Utility app builders, being the retention leader in the market is a meaningful competitive signal.
The SOIS 2026 benchmark conversion funnel shows 59.2% first-renewal rate across all categories globally. Utilities at 58.1% is broadly aligned with the market average at the first renewal, but the category's advantage compounds over time. On annual plans, the 22.1% one-year retention is the highest of any category.
| Retention benchmark | Utilities vs. market average |
| First-renewal retention | 58.1% (Utilities) / 59.2% (global average) |
| One-year retention — annual plans | 22.1% — category leader |
| Productivity (comparison) | 14% one-year retention, best overall retention |
| Health & Fitness first-renewal | 30.3% — lowest of any category |
Higher-priced weekly plans retain 12% better at first renewal across the market. Utilities users who are paying more for a weekly plan are more likely to renew, which reinforces the category's full-price monetization profile.
How competitive is the Utilities category?
Utilities is tied with Health & Fitness as the least concentrated category in the report — 92.6% of revenue goes to the top 10% of apps, versus 97.9% in Lifestyle. That 5.3 percentage point difference represents a meaningful opportunity gap for apps trying to break into the top tier.
The overall market is compressing fast. The top 10% of apps now earn 94.5% of all subscription revenue, up from 92.7% in 2023. Across the market, 31% more apps were launched in 2025, while the median monthly revenue per new app dropped 22%. Utilities is less extreme than categories like Lifestyle or Education, but the concentration trend is real.
What new Utility apps are up against
58% of new apps across the market earn under $1,000 in their first year. Only 7.9% break $100K. In Utilities specifically, North American top performers show a gradual market share loss — from 88.7% concentration in 2023 to 83.4% in 2025. New entrants appear to be gaining ground, which is unusual relative to other categories.
The experiment data gives Utility app builders a concrete lever. In Utilities, localization tests, plan duration changes, and trial structure tests all show consistently positive LTV win rates. Localization in particular drives the highest rate of LTV uplift of any experiment type at 62.3%. For a deeper look at how revenue concentration is reshaping what experimentation means for apps at different scales, see what the top 10% of subscription apps do differently.
How are AI-powered Utility apps performing?
Utilities AI apps grew revenue 174% YoY in 2025 — the third fastest growth rate of any category, behind Lifestyle AI (691%) and Graphics & Design (202%). The category is well-suited to AI integration: productivity and automation tools with clear before-and-after value propositions convert AI capability into usage patterns that support subscriptions.
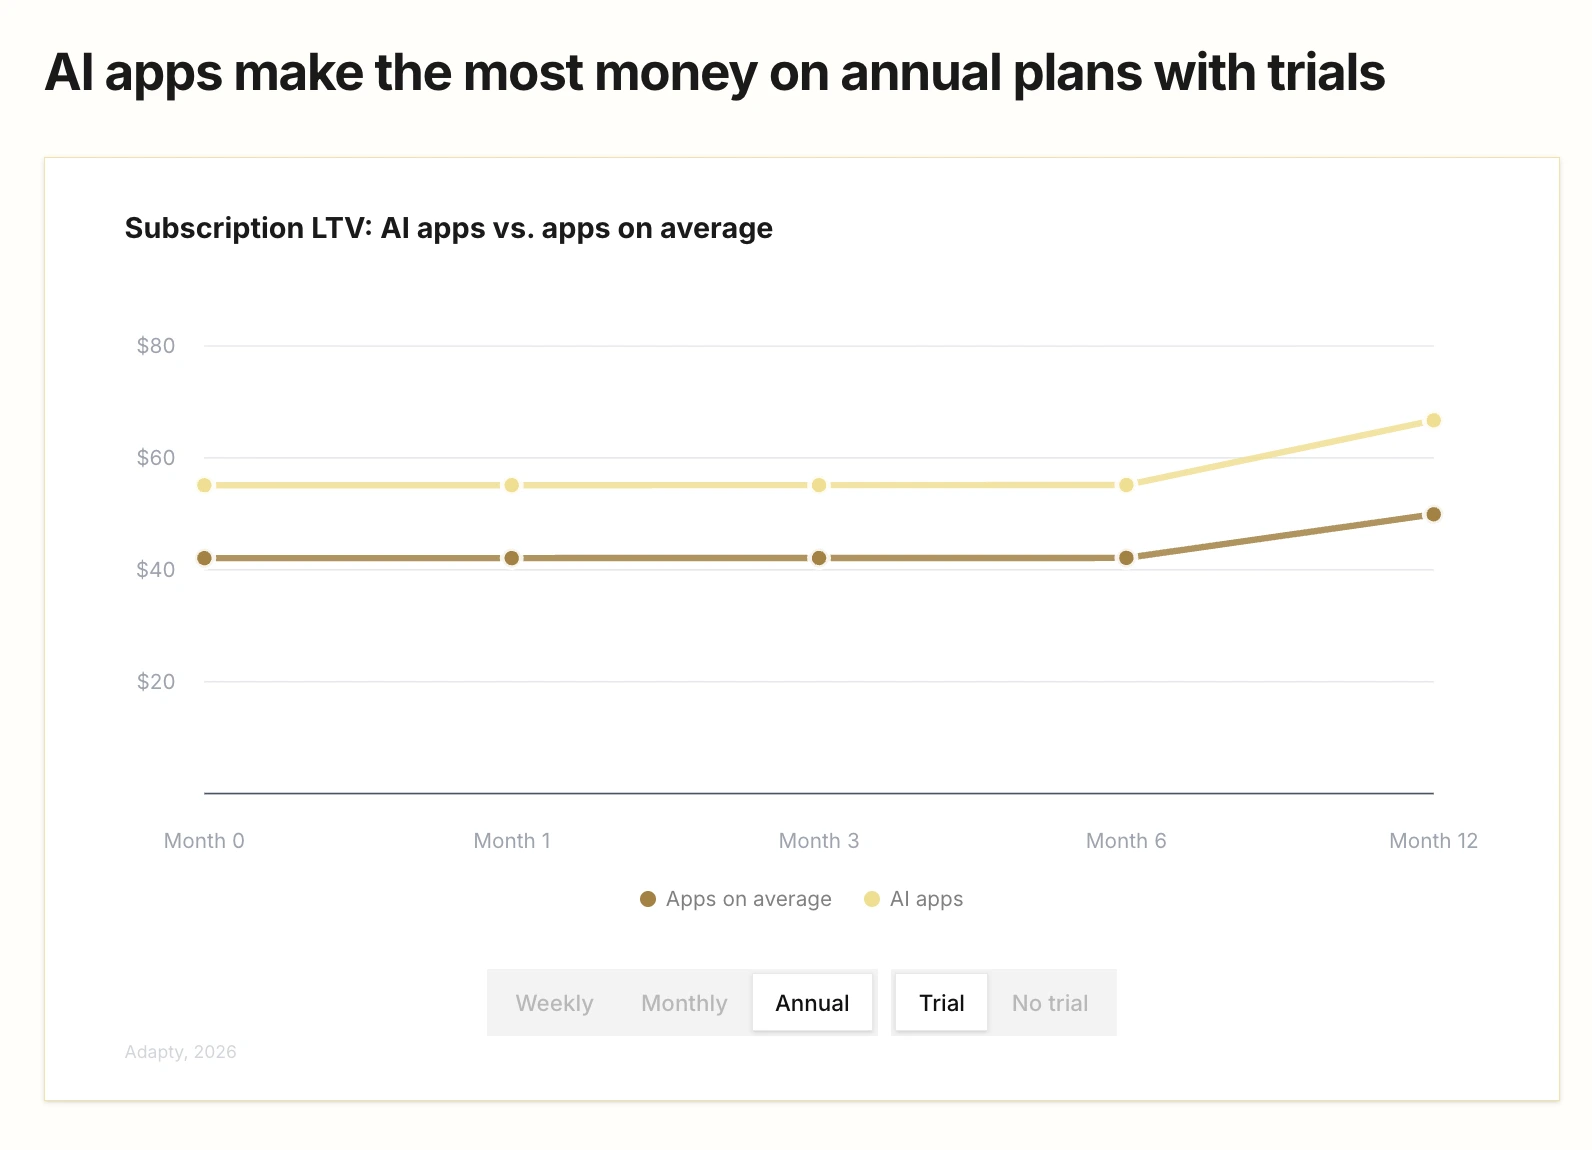
Across the AI apps segment broadly, the monetization profile differs from that of average apps. AI apps convert into trial at roughly half the market rate (5.31% vs. 10.92% install-to-trial) but get 14% more direct purchases. On LTV, annual plans with trials are where AI apps outperform: $66.70 vs. $49.92 for average apps. For AI Utility apps specifically, the category's existing strength in trial LTV suggests alignment with the broader AI apps pattern.
Which regions should Utility app builders prioritize?
North America still drives over half of global subscription revenue, and the install LTV advantage in North America — roughly 2x the global average — makes the US the default priority for most Utility apps. But the regional picture is shifting.
Europe overtook North America as the most expensive region in 2025 on annual, monthly, and weekly plans. The 70.5% price increase in European Utility annual plans over two years is the biggest regional pricing move in the report. If you already have European users, you likely have a pricing room you have not used.
| Region | Signal for Utility apps |
| North America | Highest install LTV (~2x global average) — primary revenue market |
| Europe | Annual plan prices up 70.5% over two years — pricing room exists |
| Japan | Top LTV country in APAC ($23.4), fastest-growing market |
| Mexico / Turkey | Fast-growing markets flagged in report for localization opportunity |
| LATAM | 35% lower LTV than top European countries — distinct regional strategy needed |
Japan, Mexico, and Turkey are the fastest-growing app markets in the report. Localization for these markets, including paywall and pricing adaptation, is one of the highest-ROI experiment types available — and Utilities is a category where functional value propositions translate across languages more directly than content-driven categories.
What paywall setup performs best for Utility apps?
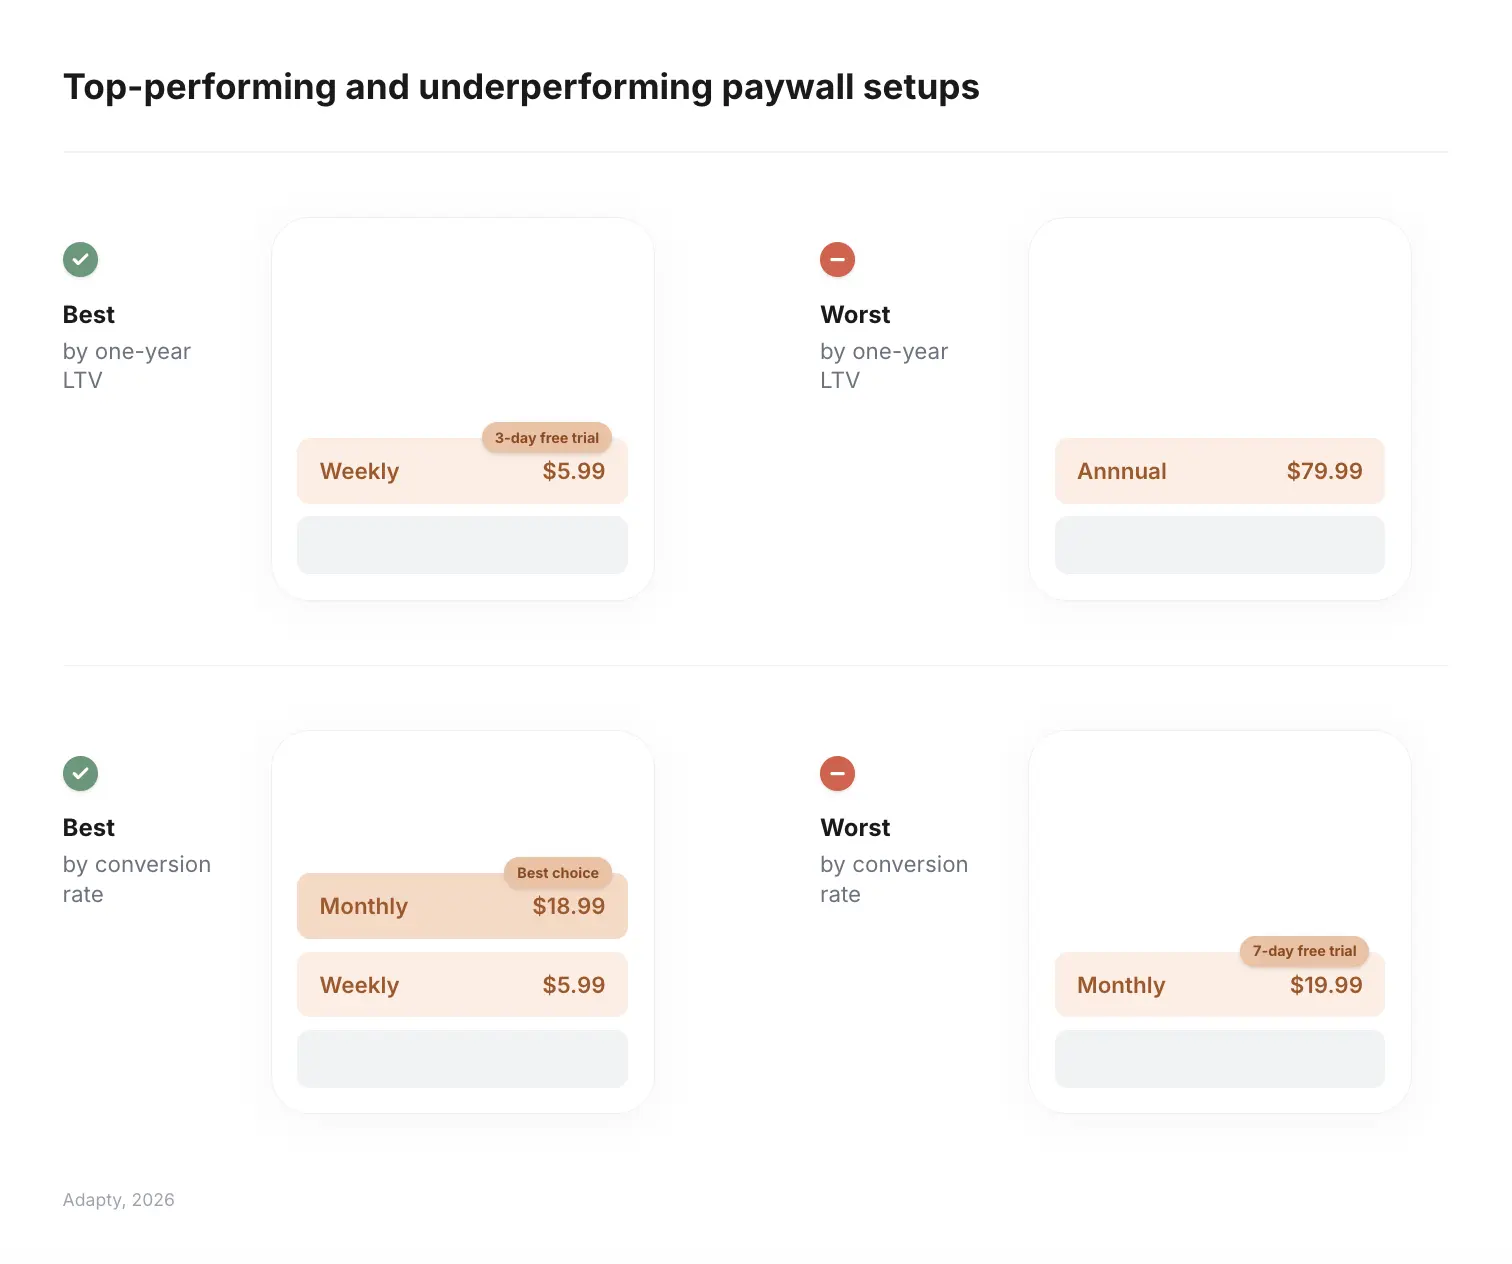
The top-performing paywall configuration in the report overall is weekly with a 3-day free trial — generating 1.5x the average LTV of all other setups. For Utilities specifically, the category's strength in trial LTV and trial retention makes this configuration directly applicable. For a full analysis of what separates high-converting paywalls from the rest, see what a high-performing paywall looks like in 2026.
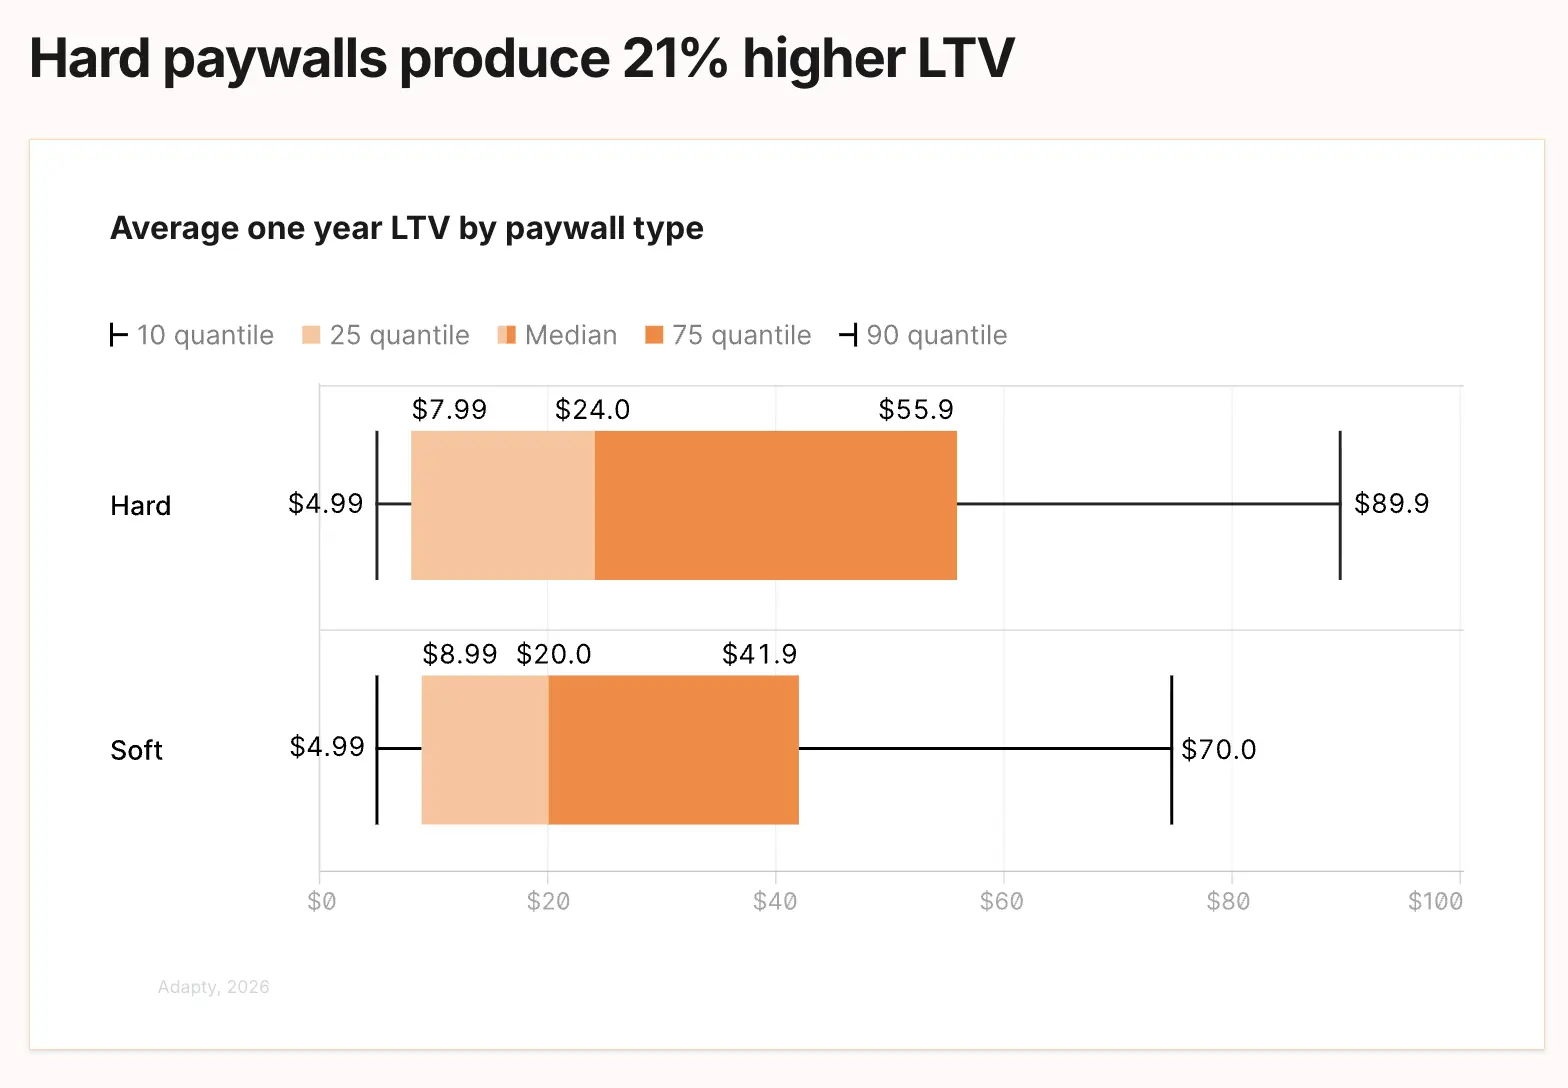
Hard paywalls produce 21% higher LTV than soft paywalls on average, though soft paywalls outconvert hard paywalls by nearly 50% on conversion rate alone. The tradeoff: hard paywalls attract users who spend 20 to 33% more than the median. For a Utility app where the core value is demonstrable quickly, hard paywall testing is worth running.
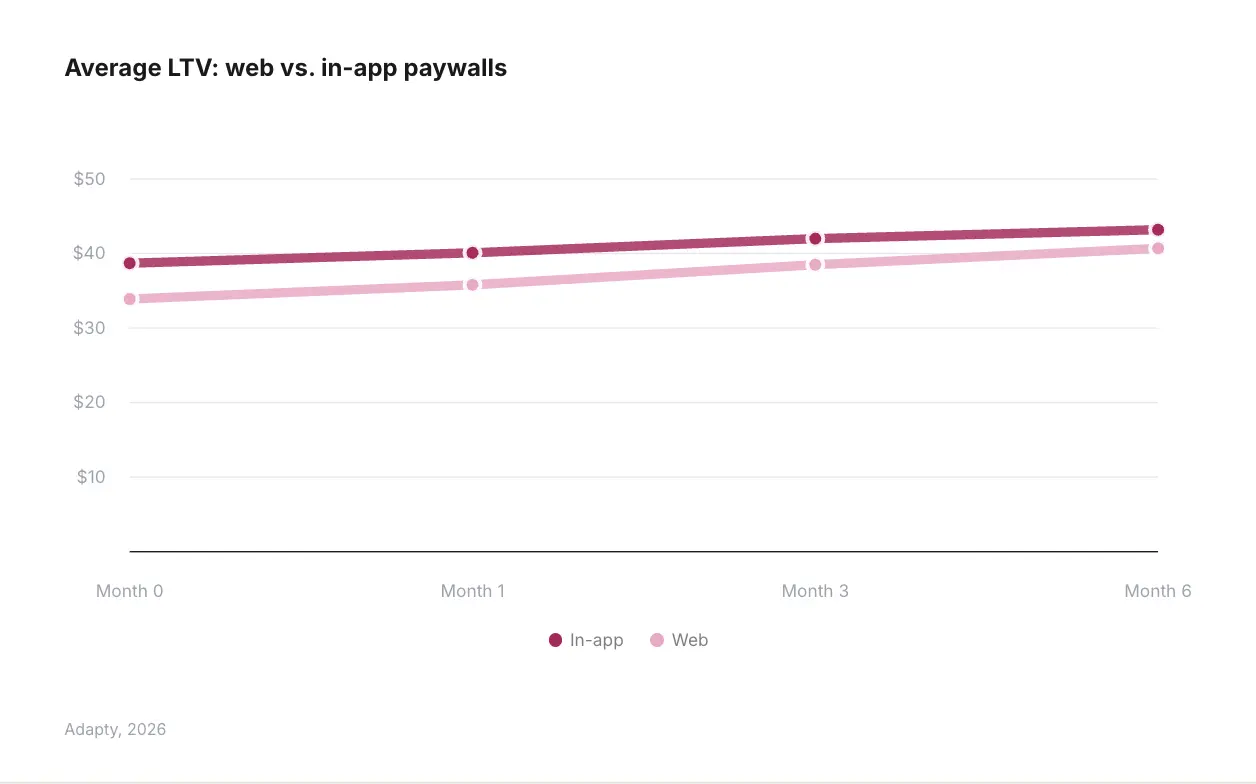
Web paywalls are an emerging option with early 2025 data. In-app paywalls still convert better (1.60% vs. 1.10%), but web paywalls skip the 30% App Store commission. Over 12 months, in-app LTV remains $4 higher than web LTV ($40.1 vs. $35.8) due to lower web retention — but the web paywall option is worth monitoring as adoption grows.
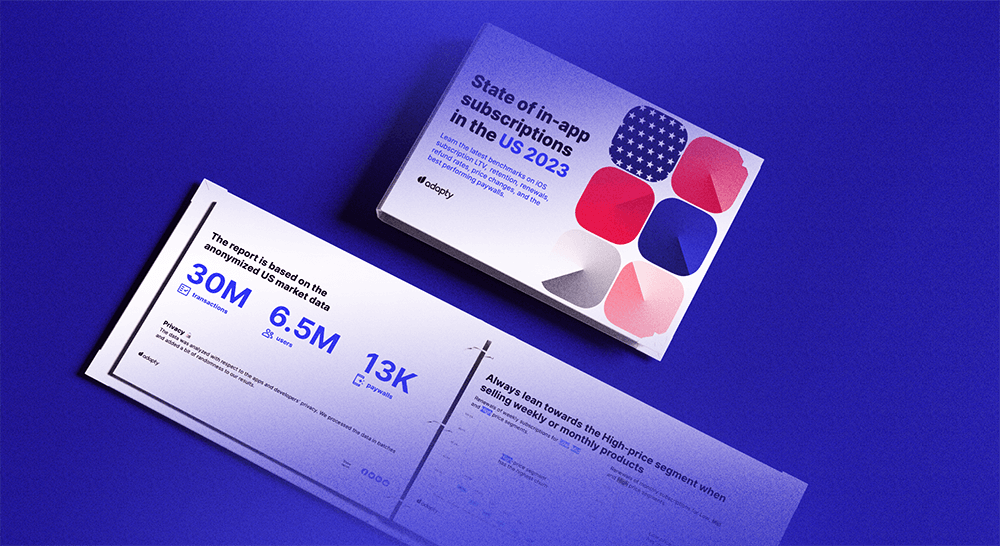
See how your Utility app stacks up
These benchmarks come from Adapty's State of in-app subscriptions 2026 — the most comprehensive subscription dataset available, built on $3B in revenue across 16,000+ apps. The full report is interactive: filter any chart by your category, region, plan type, and country to see exactly where your app ranks.