The in-app subscription market is changing fast. Installs are slowing down, but revenue keeps growing. The difference comes down to how well you convert and retain users.
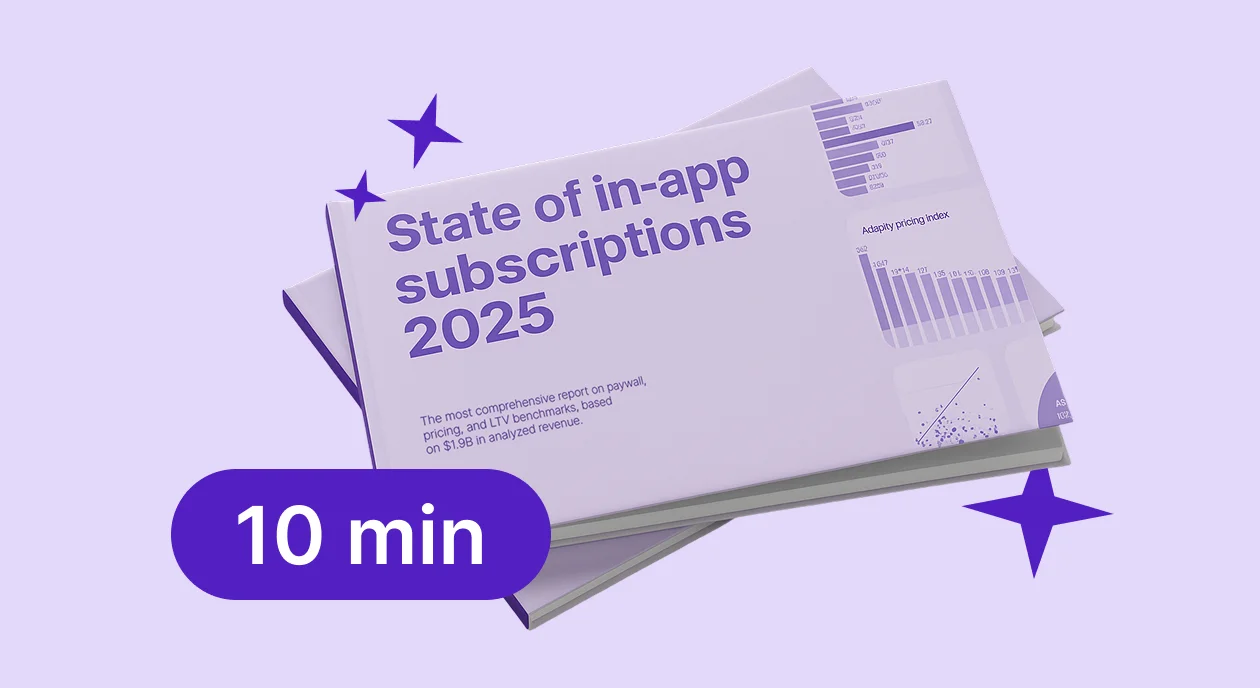
To find out what’s working in 2025, we analyzed $1.9B in revenue across 11,000+ apps. The result is the State of in-app subscriptions 2025 – the most comprehensive benchmark report on pricing, paywalls, and profitability.
This article gives you the full picture in ten minutes: trends, numbers, and how to use them to grow.
The market in 2025: still growing, but getting tougher
The in-app purchase market is on track to reach $170B in 2025. But that growth is uneven. While installs are flattening, revenue is rising, especially for apps that know how to convert.
Here’s what we see:
- Weekly plans grew by 10%, now making up nearly half of all subscriptions
- One-time purchases increased by 6%, showing renewed user interest
- Long-term plans like annual and lifetime dropped, as users leaned into flexibility
The gap is growing: apps that optimize pricing and onboarding continue to scale. Everyone else falls behind to monetize.

Shorter plans are taking over
Weekly subscriptions are now the most popular plan type. They’ve grown 10% since last year and account for nearly half of all in-app subscriptions. Users clearly prefer flexible, low-commitment options.
One-time purchases are also up 6%, signaling a shift toward upfront value. Meanwhile, long-term plans like annual and lifetime subscriptions are losing ground.
Category trends show the same pattern:
- Weekly plans dominate in Productivity, Utilities, and Photo & Video: over 50% of revenue
- Annual plans still lead in Health & Fitness and Education, where users are more goal-driven
- Lifestyle apps mix it up, with no clear winner
If you’re only offering monthly or annual plans, you’re likely missing conversions.
Prices are rising, but not evenly
Across regions, subscription prices are going up.
- Weekly plans saw the biggest increases. In Europe, the average weekly price reached $8.3, up 12.2% from last year. The US is close behind at $8.1, after a 12.5% jump
- Monthly plans also went up, though more gradually. The US leads with an average of $15.2, while Europe follows at $13.3
- Annual plans are mostly stable, with $44.6 and $42 in the US and Europe respectively
Categories show different pricing patterns:
- Utilities and Photo & Video apps charge significantly more for long-term access. Annual plans cost 6x more than weekly
- Lifestyle apps lean into premium monthly plans, averaging $18
- Education and Health & Fitness charge 5x the weekly rate for annual subscriptions
If you haven’t revisited your pricing in a while, now’s the time. Use research methods like Van Westendorp, MaxDiff, and Conjoint.
- Van Westendorp helps you find the price range users consider fair
- MaxDiff shows which features matter most to your users
- Conjoint analysis tests different pricing and feature combinations to measure what people are actually willing to pay for

Geography matters more than you think
Users don’t pay the same amount in different countries. In fact, the difference can be 2-3x, and most apps still don’t price accordingly.
That’s why we built the Adapty pricing index. It shows how actual subscription payments vary by country, using the US as a baseline.
Here’s what it shows for weekly plans:
- In the Netherlands, users pay 62% more than in the US.
- In Turkey, they pay almost 3.5x less.
- Similar gaps exist for monthly and annual subscriptions
If you’re using a flat pricing model or basic multipliers, you’re likely undercharging in high-value regions and scaring away users in lower-income ones.
Find the full country list and pricing index for weekly, monthly, and annual plans in the report chart.

LTV: the plan makes the difference
Not all plans bring the same long-term revenue. Some drive much higher lifetime value because they fit how users behave and what they’re willing to pay.

- Weekly plans drive the highest LTV in top-performing categories like Productivity ($53.2) and Utilities ($58.4). These plans see the best results across all regions.
- Annual plans outperform in Health & Fitness ($46.1), Photo & Video ($42.4), and Education ($45.8), where users tend to stick around longer for consistent value.
- Monthly plans are solid performers in Lifestyle apps ($42.8) but fall short when it comes to retaining users long-term.
The data shows that trials significantly boost LTV. Users who start with a trial have an LTV that’s up to 64% higher.

For apps growing through paid user acquisition, faster payback means faster reinvestment. A solid LTV strategy helps you scale your growth without burning out.
Conversion isn’t always what you expect
Free trials don’t always convert better. In most categories, direct paywalls lead to higher conversion than trials. Sometimes the gap is massive.
Here’s what the data shows:
- The Install to Paid funnel without a trial reaches 18-38%, especially in Lifestyle and Productivity apps.
- Install to Trial rates stay below 12% in most cases. Even in Health and Fitness, where trials are common, full-funnel conversion is under 0.1%.
Trials still play an important role. They don’t improve early conversion, but they do increase long-term value and retention, especially for weekly plans.

See the full table of conversion rates by app category, subscription type, pricing tier, and trial setup in the report.
What keeps users around
Retention depends on the plan, the value you deliver, and how quickly users see it.

Here’s what the numbers say:
- Weekly subscriptions churn the fastest. 65% of users cancel within the first 30 days. Only 5% are still active after one year
- Monthly plans perform better. 43% retention at day 90. 17% still active after a year
- Annual plans keep almost everyone for 12 months. But churn spikes right after the renewal point
- Trials improve retention, especially on short plans. Weekly plans go from 23% to 42% retention at day 30 with a trial
- Mid-priced annual plans underperform. Low and high tiers retain better, suggesting users want either a clear deal or a clear reason to pay more
The key insight is the faster users see real value, the more likely they are to stay.
Refunds are about timing and expectations
Refund rates say a lot about user satisfaction. They usually don’t happen because the product is bad. They happen when value comes too late.

Here’s what we found:
- Annual plans have the highest refund rate at 4.2%. Longer commitments raise expectations
- Weekly plans refund the least at 2.6%. Shorter terms feel safer and easier to try
- Mid-priced plans get refunded most. Low and high tiers perform better, just like with retention
- LATAM and the US lead in refund volume. Both see rates above 3%
- Europe and MEA refund less. Rates here stay closer to 2.3%
One way to fix it is to reduce time-to-value. Use onboarding, prompts or Adapty’s Refund Saver, which recovers up to 73% of lost revenue automatically.

A/B testing works if you test the right things
Not all tests are created equal. Visual tweaks won’t change much. What matters is testing the structure of your offer.
Here’s what works:
- Start with trials and plan durations. These two have the biggest impact on both LTV and conversion
- Test price points and number of plans next. Higher prices don’t hurt conversion as much as you’d expect
- Make sure your offer converts before testing visuals. Great design won’t fix a weak paywall
- Paywalls with three plans, weekly, monthly, and annual, tend to drive stronger LTV across categories
- Apps that run more tests earn more. Teams with 50+ paywall experiments often grow revenue to 100x

The bottom line: test what matters, and test often. Most apps don’t do enough.
Five things to do next
The report covers a lot, but the most important takeaways are simple. These five moves can drive the impact:
- Offer flexibility. Weekly subscriptions grew 10% and now dominate the market. Users want options they can try without committing.
- Use smart trials. Trials lift LTV by up to 64%. They work best for short plans but need the right timing and setup.
- Raise your prices. Higher-priced plans consistently deliver stronger LTV across all regions. You’re probably undercharging somewhere.
- Localize your pricing. The difference in willingness to pay can be 2-3x between countries. Use our pricing index from the report.
- Keep testing. More tests mean more revenue. Start with trials, durations, and pricing. Iterate fast.
Conclusion
That’s the high-level view. If you work on growth, monetization, or product, the State of in-app subscriptions 2025 report is your most practical resource this year.
You’ll find full benchmarks, category breakdowns, and pricing insights you won’t get anywhere else.
Download the full report and use it to make smarter decisions faster.


