In-app subscription benchmarks for Productivity apps

TL;DR:
- Productivity leads all categories in average LTV across plans at $46.97
- Weekly plans now drive 65% of Productivity revenue — and direct buyers outperform trial users by $7.82 in 12-month LTV
- Productivity apps in the US are the single best country-category combination for revenue per install globally
- Productivity retains 14% of users after one year — the best long-term retention of any category
- The trial playbook that works in Utilities and Health & Fitness actively costs Productivity apps money
Productivity is one of the most commercially attractive categories in the app store. Across all plan types combined, Productivity leads at $46.97 in average LTV, ahead of Utilities at $46.30 and Education at $45.10. Productivity apps in the US represent the single best country-category combination globally for revenue per install.
That's the upside. The downside: the monetization dynamics in Productivity are more counterintuitive than in almost any other category, and the most common "best practices" — trial-first acquisition, trial length testing, soft paywalls — can actively reduce your revenue if you apply them without understanding how your users actually behave.
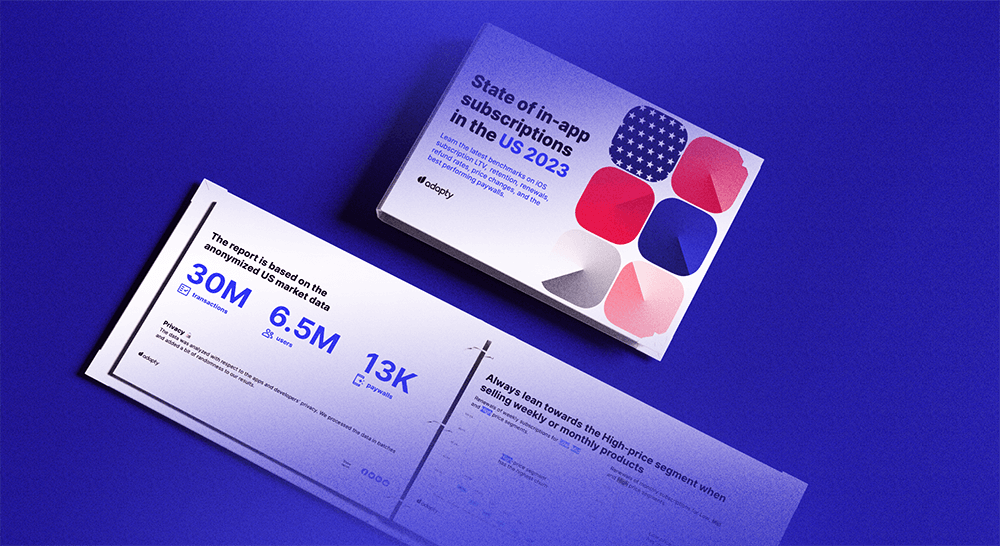
This article pulls the Productivity-specific data from Adapty's State of in-app subscriptions 2026 report, covering $3B in subscription revenue across 16,000+ apps. Below are the numbers that should shape your monetization strategy this year.
How does revenue break down by plan type in Productivity apps?
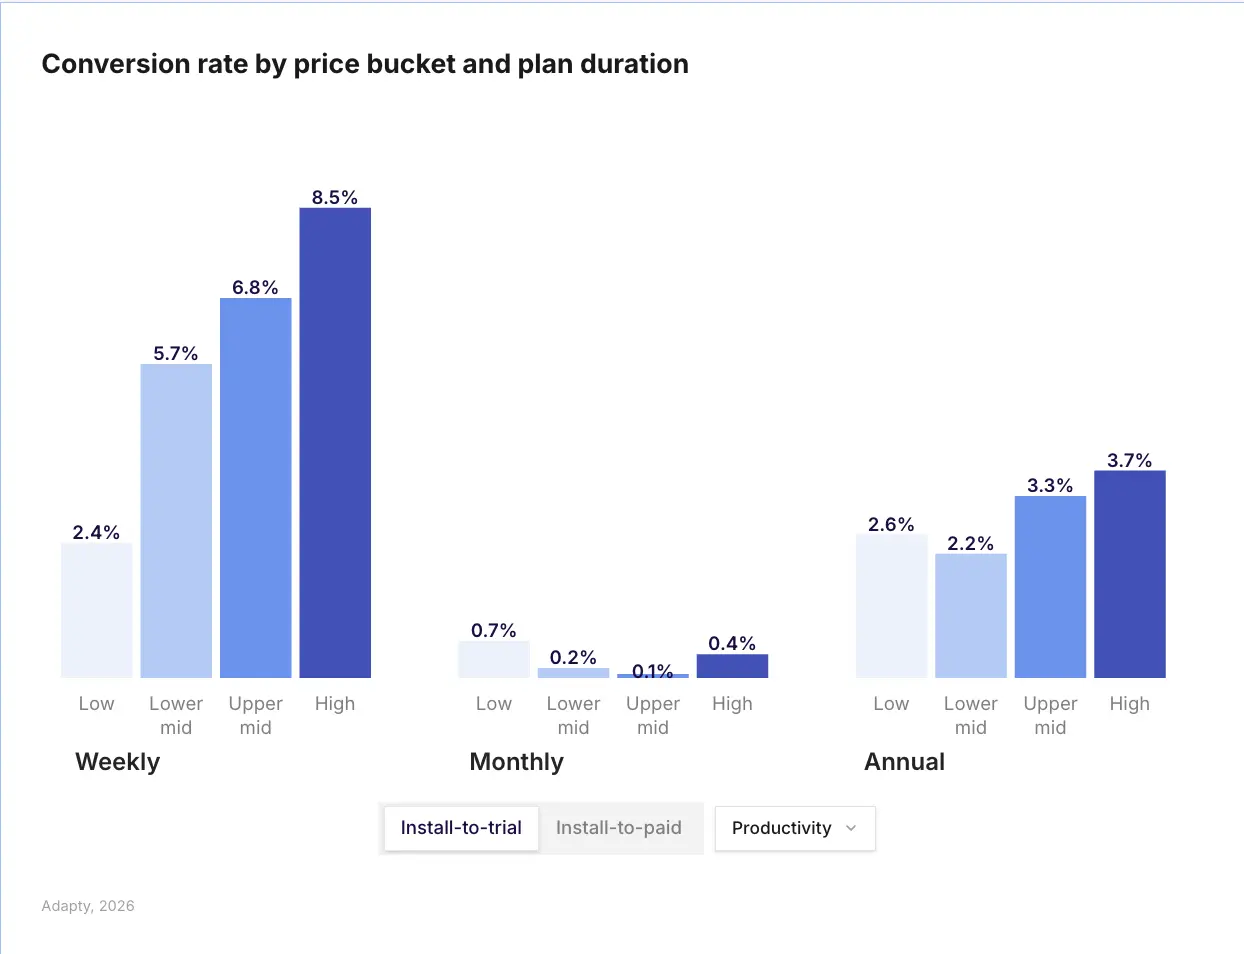
Weekly plans now drive 66% of Productivity revenue — a figure that's consistent with the broader market shift toward shorter billing cycles, but sits noticeably higher than the cross-category average of 55.5%.
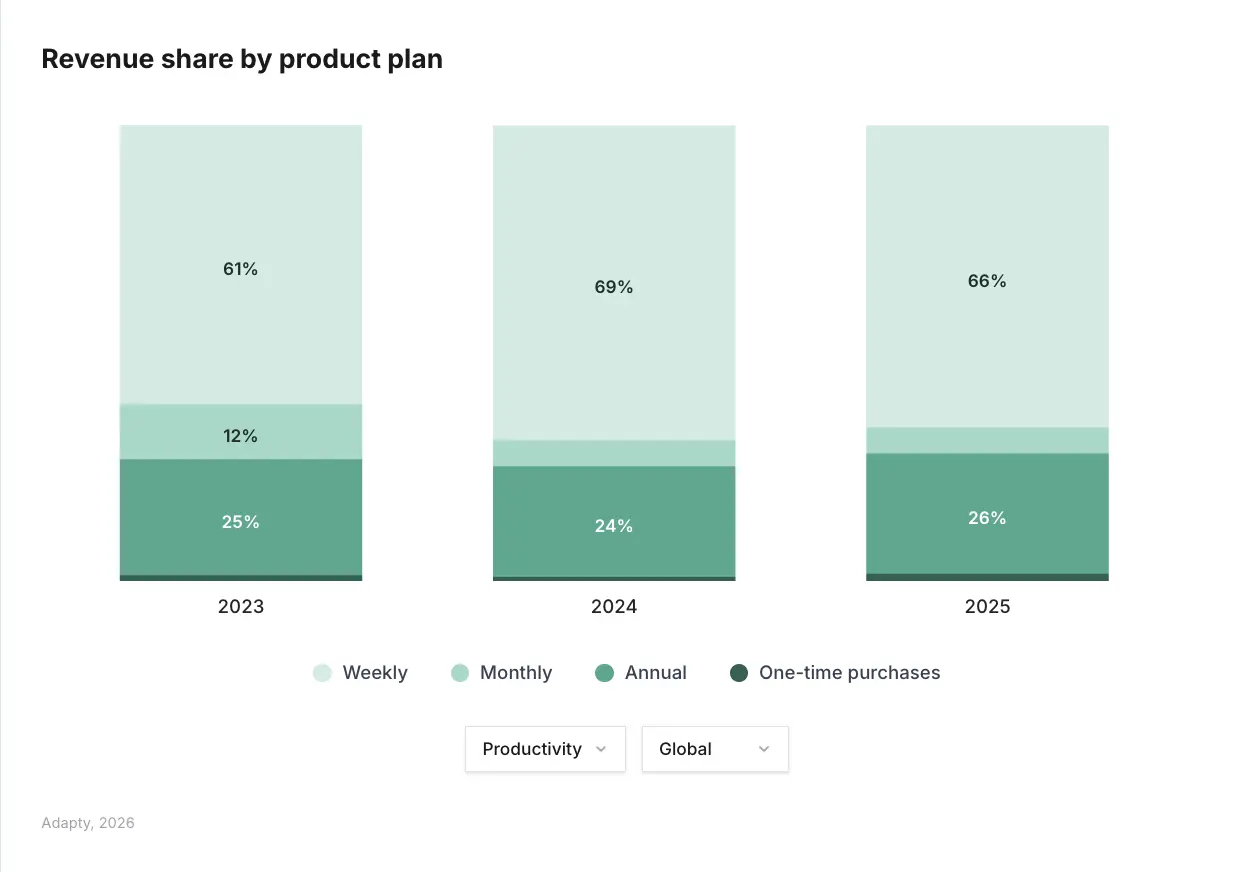
Monthly plans consistently underperform both weekly and annual at every price tier. For Productivity apps specifically, monthly is the plan you keep for the users who ask for it, not the one you optimize around.
In Productivity, this shift is more pronounced. The psychology is straightforward: users want to test whether your app actually fits into their workflow before committing to a year. Weekly plans let them do that on their terms. Monthly sits in an awkward middle — too expensive to feel low-risk, not valuable enough in LTV terms to justify the paywall design real estate it consumes.
The practical takeaway: If your paywall still leads with monthly, restructure it. Weekly as the entry point, annual as the anchor, and monthly as a secondary option if you include it at all.
What LTV should you expect from a Productivity subscriber?
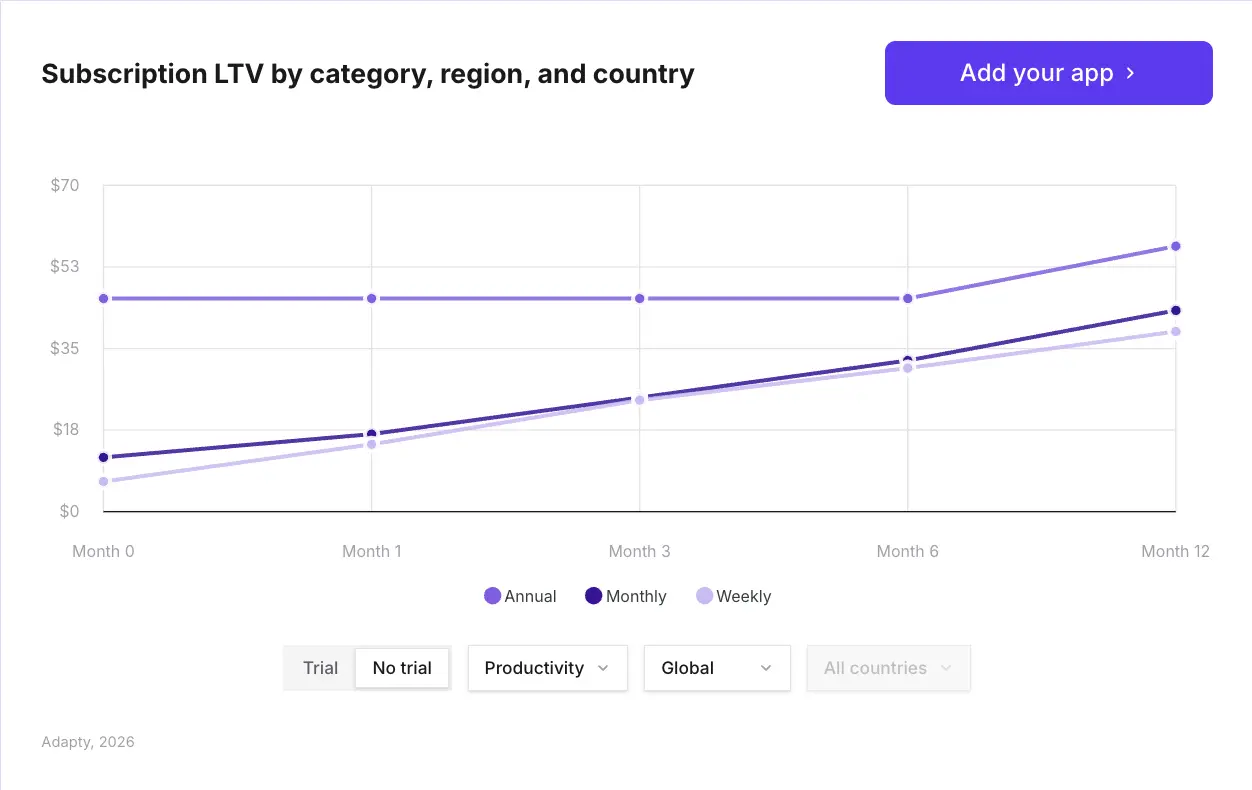
Productivity leads all categories at $46.97 in average 12-month LTV across plans. But that average obscures a meaningful gap between plan types.
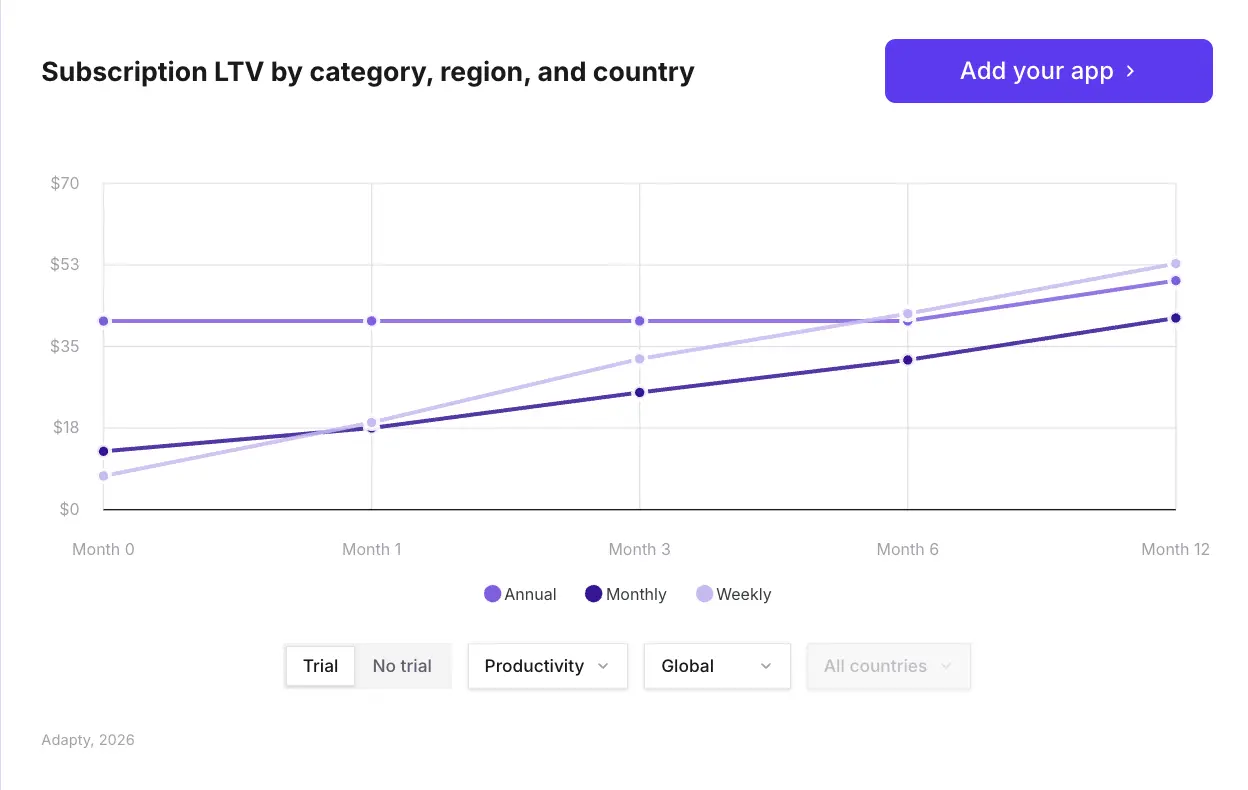
The counterintuitive finding: in Productivity, direct buyers are worth $56.95 versus $49.13 for trial users — a $7.82 difference that compounds across your acquisition volume. In Productivity, the trial LTV premium is -13.7%. Trial users are worth less, not more.
This is the opposite of what happens in Utilities (+85.1% trial premium), Health & Fitness (+63.6%), and Education (+50.4%). In those categories, trial users self-select on genuine intent. In Productivity, they tend to be experimenters — people curious about whether the app fits their system, not people who have already decided they need it. They try, they don't build the habit, they cancel.
Trials act as a quality filter in some categories and a churn magnet in others. In Productivity, the data puts it firmly in the second camp.
The practical takeaway: Track the 12-month LTV of trial-converted vs. direct-converted subscribers in your own data. If your trial cohort is underperforming your direct cohort, your trial strategy is subsidizing your worst subscribers.
Does the trial decision affect retention, too?
Productivity retains best overall, with an average of 14% of users staying after one year — the strongest long-term retention figure across all eight categories in the SOIS report.
That's an encouraging headline. The nuance is in how you get there. Given that direct buyers outperform trial users on LTV in Productivity, your retention figures will look better the less you rely on trial volume for acquisition. A subscriber base weighted toward direct buyers is a subscriber base that sticks.
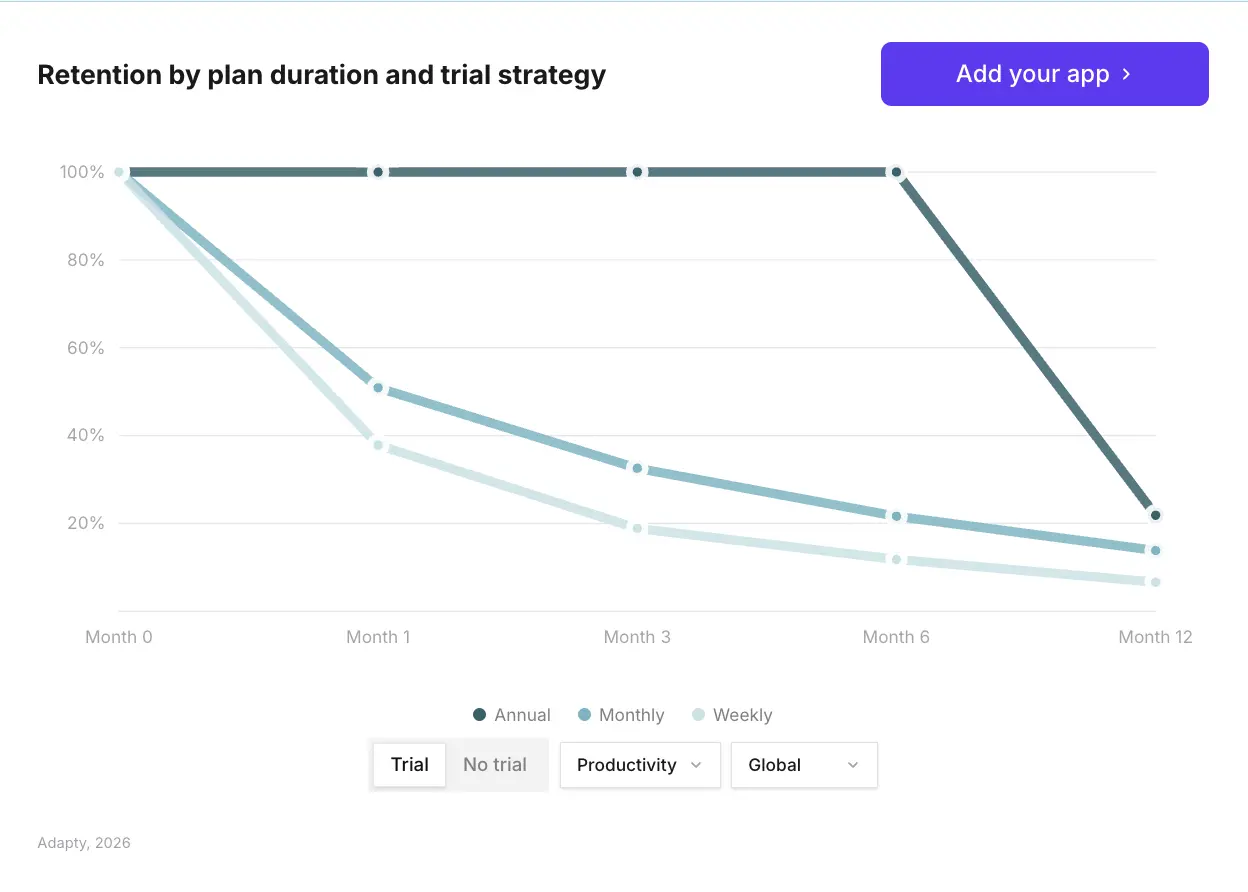
At Day 380, annual trial subscribers retain at 19.9%, monthly at 14.2%, and weekly at 5.5%. These are cross-category figures — but they establish the plan-type retention hierarchy that applies in Productivity too. Annual locks in the longest retention window by definition. Weekly generates the most revenue per install but requires continuous re-conversion to compound.
The strategic question for Productivity apps: use weekly to get users into the billing relationship, then build the upgrade path to annual. Successful developers don't stop at the initial conversion. They use weekly plans as a way to get the conversion and then upsell to longer-term options through smart onboarding and timely prompts.
Should Productivity apps offer a free trial?
The short answer is: probably less often than you currently do, and only on annual plans.
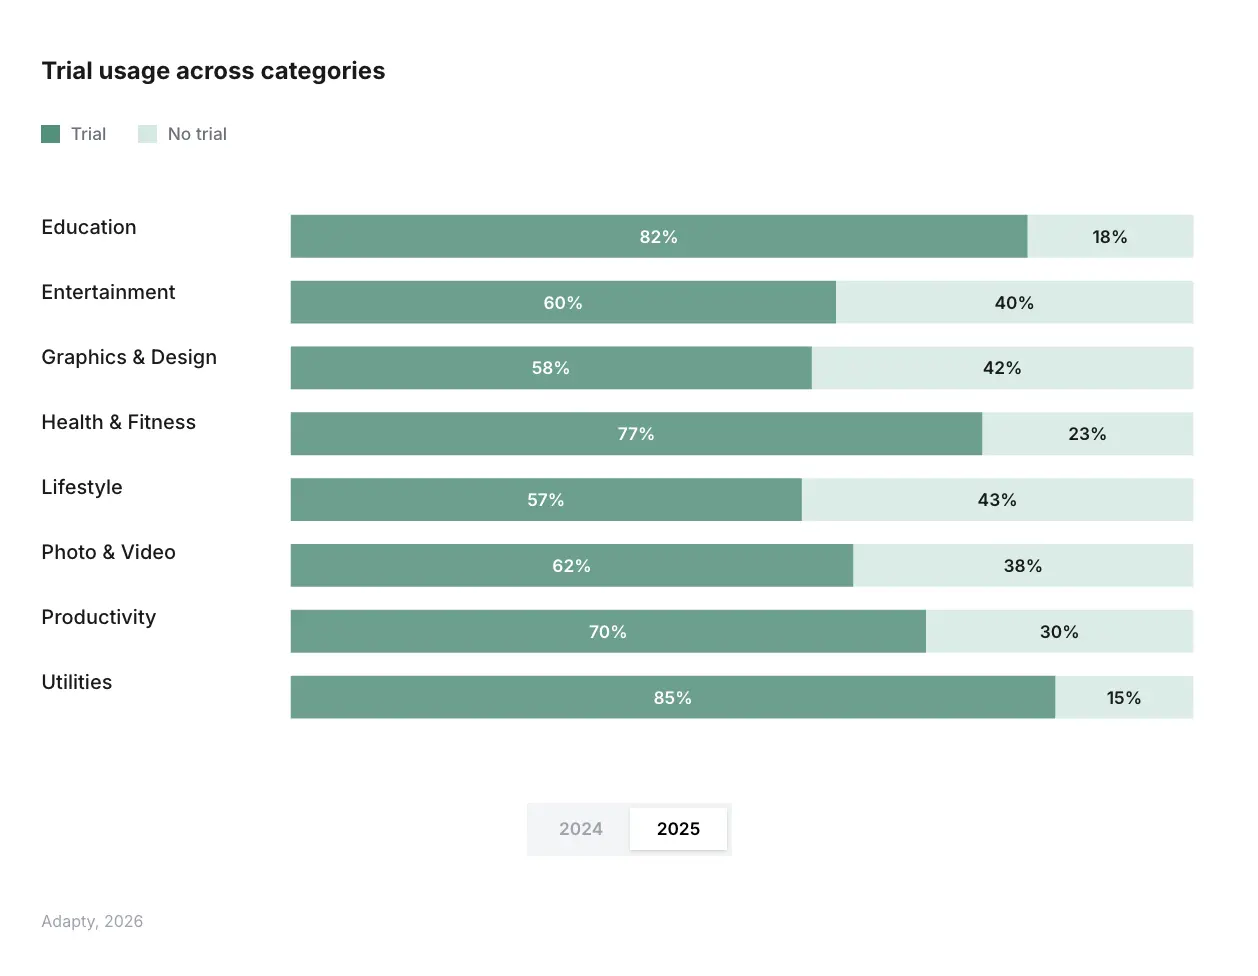
Trials boost LTV for annual subscriptions in Utilities, Health & Fitness, and Education. In Productivity, Lifestyle, Entertainment, and Graphics & Design, direct buyers are worth more.
The data does leave one exception open. Across all categories, weekly plans with a free trial produce the highest 12-month LTV at $49.27, despite starting with the lowest Day 0 LTV.
So the question isn't "trial or no trial" in absolute terms — it's where in your plan structure the trial sits and what it's selecting for. A trial on an annual Productivity plan may still make sense if you have evidence that your annual trial-converted cohort retains well. A trial as the default entry point for every user, regardless of plan type, is where the data suggests you're likely acquiring your least valuable subscribers.
In Productivity, direct buyers generate $56.95 in one-year LTV compared to $49.13 for trial users. Run the same cohort analysis on your own data before assuming the industry-standard trial-first approach is working for you.
What are Productivity apps charging?
Global median prices across all categories in 2025 sit at $7.48/week, $12.99/month, and $38.42/year. Productivity apps tend to price at or above these medians — users in this category understand the value of tools that save them time, and their willingness to pay reflects that.
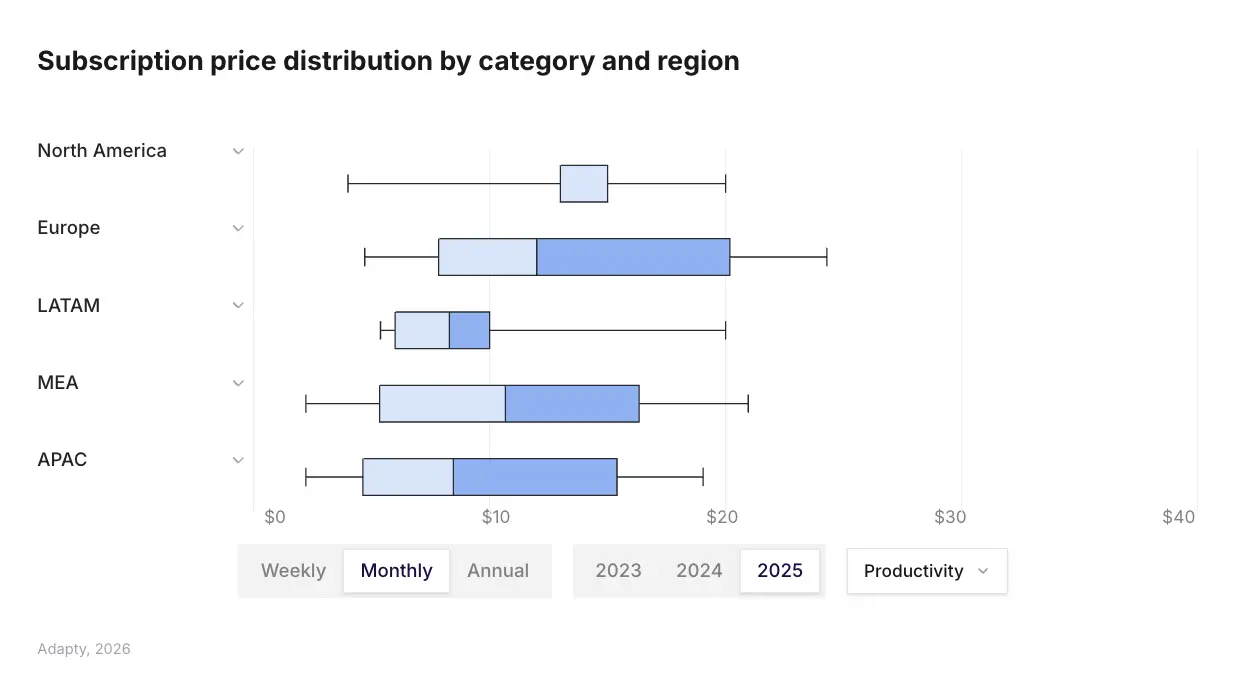
European apps charge 29-39% more than North American ones. Higher prices don't kill conversion: high-tier weekly plans generate 5.2x more revenue per install than low-tier ones.
That last point deserves emphasis. The instinct to price conservatively to protect conversion rates is wrong in Productivity. Higher-priced plans attract users who've already decided the app fits their system — they're lower churn risk and higher LTV. Low-priced entry plans attract price-sensitive users who haven't committed to the workflow yet.
Each of the top-3 European countries outperforms the US in median LTV. If you're not pricing differently across regions, you're undercharging in Europe and likely overcharging relative to willingness to pay in LATAM, where top LATAM countries see 35% lower LTV than top European ones.
How do Productivity apps convert across the subscription funnel?
The chart above shows weekly + trial benchmarks filtered to Productivity, global. Install-to-trial sits at 9.8% — just below the cross-category average of 10.9%. Trial-to-paid converts at 29.5%, above the global average of 25.6%.
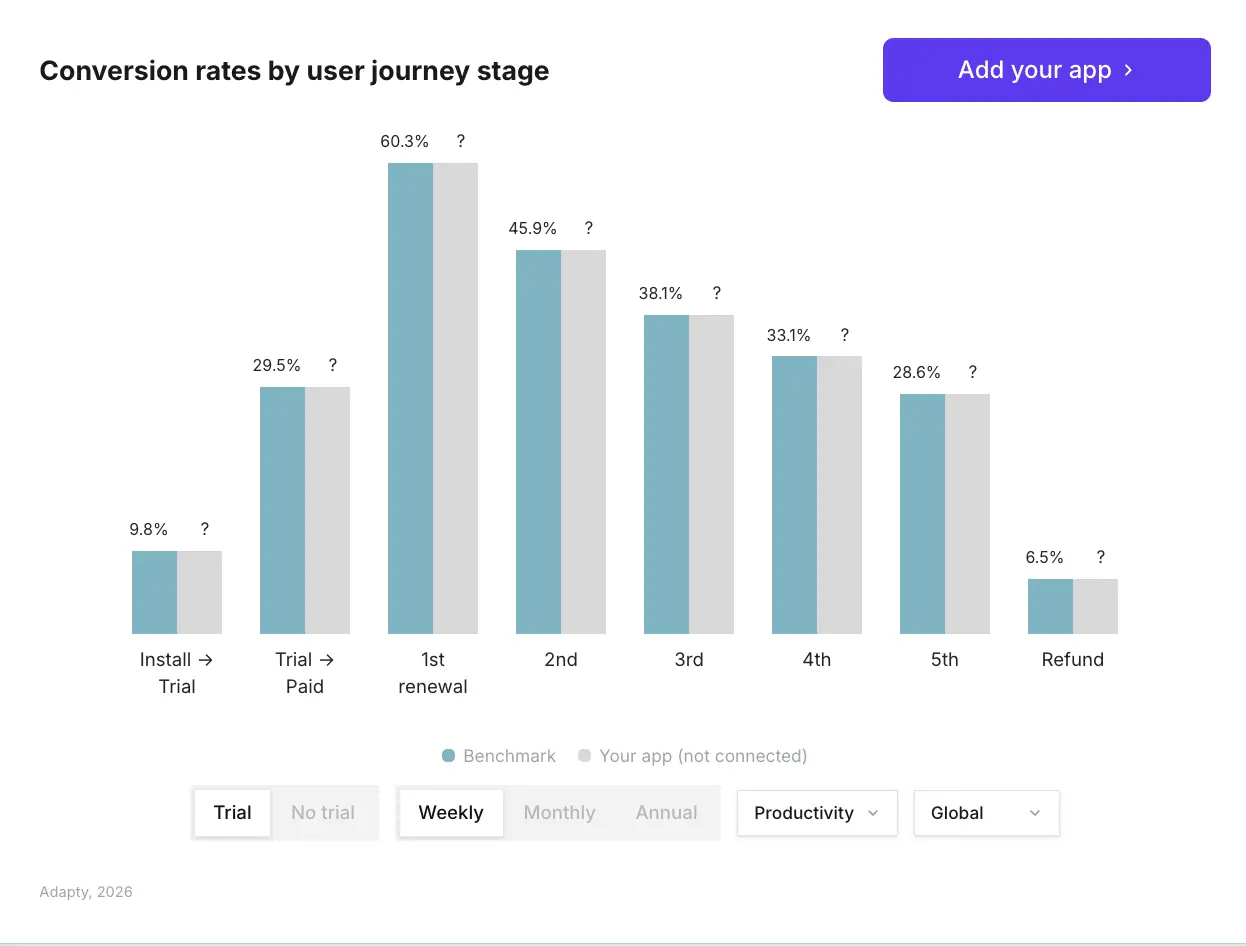
That gap matters. Productivity users who start a trial are more likely to convert to paid than the average app — but as the LTV data makes clear, they're worth less once they do. A 29.5% trial-to-paid rate looks strong on paper. The problem is you're converting a cohort that generates $49.13 over 12 months versus the $56.95 a direct buyer delivers. Volume through the trial funnel doesn't compensate for the per-subscriber revenue gap.
Where Productivity pulls ahead is post-conversion. First-renewal retention on weekly + trial plans hits 60.3% — meaning 6 in 10 users who convert from trial to paid are still active after the first billing cycle. That figure decays to 45.9% by the second renewal, 38.1% by the third, and 28.6% by the fifth. The decay curve is steep, but it's consistent — which means weekly Productivity subscribers churn gradually rather than in a single drop-off event. That gives you real intervention windows: post-trial, post-renewal-two, and around the fifth cycle, where nearly three quarters of your original cohort has already left.
The refund rate for this segment sits at 6.5%. That's worth monitoring. Weekly plans typically refund at lower rates than annual across all categories, so 6.5% suggests some users are converting from trial, deciding the app doesn't fit their workflow, and requesting a refund rather than simply cancelling. Faster time-to-value in your onboarding is the lever — get users to their first meaningful outcome before the trial ends, and both refund rate and renewal retention improve together.
The practical takeaway: Don't optimize install-to-trial as your primary conversion metric in Productivity. It's already above average. The real leverage is in the renewal curve — specifically, what happens between trial-to-paid and the second billing cycle, where you lose 14 percentage points of your converted base.
Is the US the right market to prioritize for Productivity?
Yes — and the data is unambiguous on this. Productivity apps in the US represent the single best country-category combination globally for revenue per install.
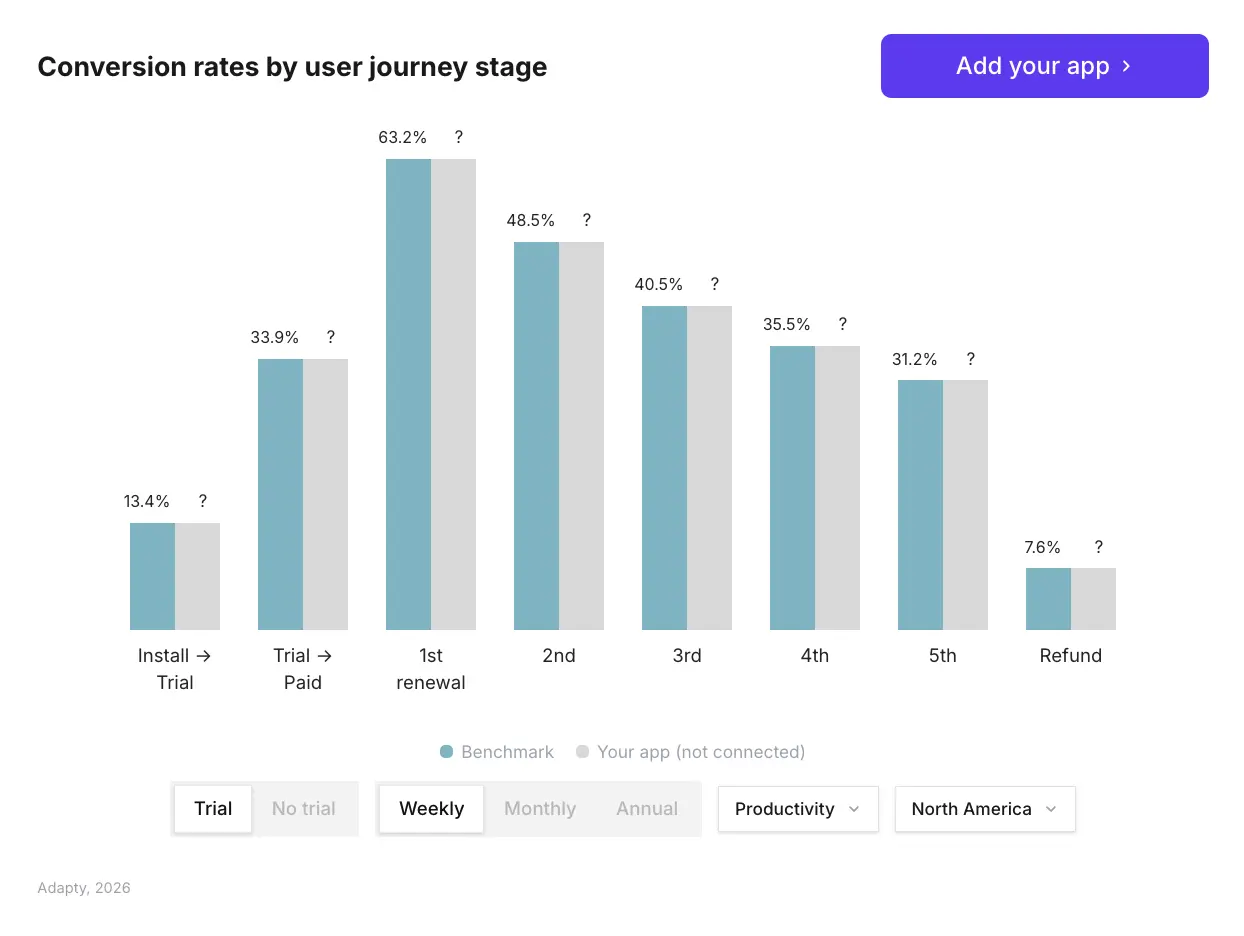
North American users are both more willing to start trials and more likely to convert, with an install-to-trial rate of 13.4% compared to 7.6-10.2% elsewhere. For a category where direct buyers outperform trial users, that higher trial start rate is a mixed signal — North American users may start more trials, but your job is still to convert the ones who behave like direct buyers.
Beyond the US, the SOIS report flags Japan, Mexico, and Turkey as the fastest-growing markets globally. While most teams fight over US conversion rates, three markets are growing faster than anywhere else: Japan, Mexico, and Turkey. For Productivity apps with established US revenue, these markets represent the next localization priority.
How do paywalls affect Productivity conversion and LTV?
Hard paywalls generate 21% higher LTV per subscriber than soft paywalls. Soft paywalls convert approximately 50% better. The right answer depends on what you're optimizing for — and in Productivity, where direct buyers are worth more, there's a case for leaning toward the harder gate.
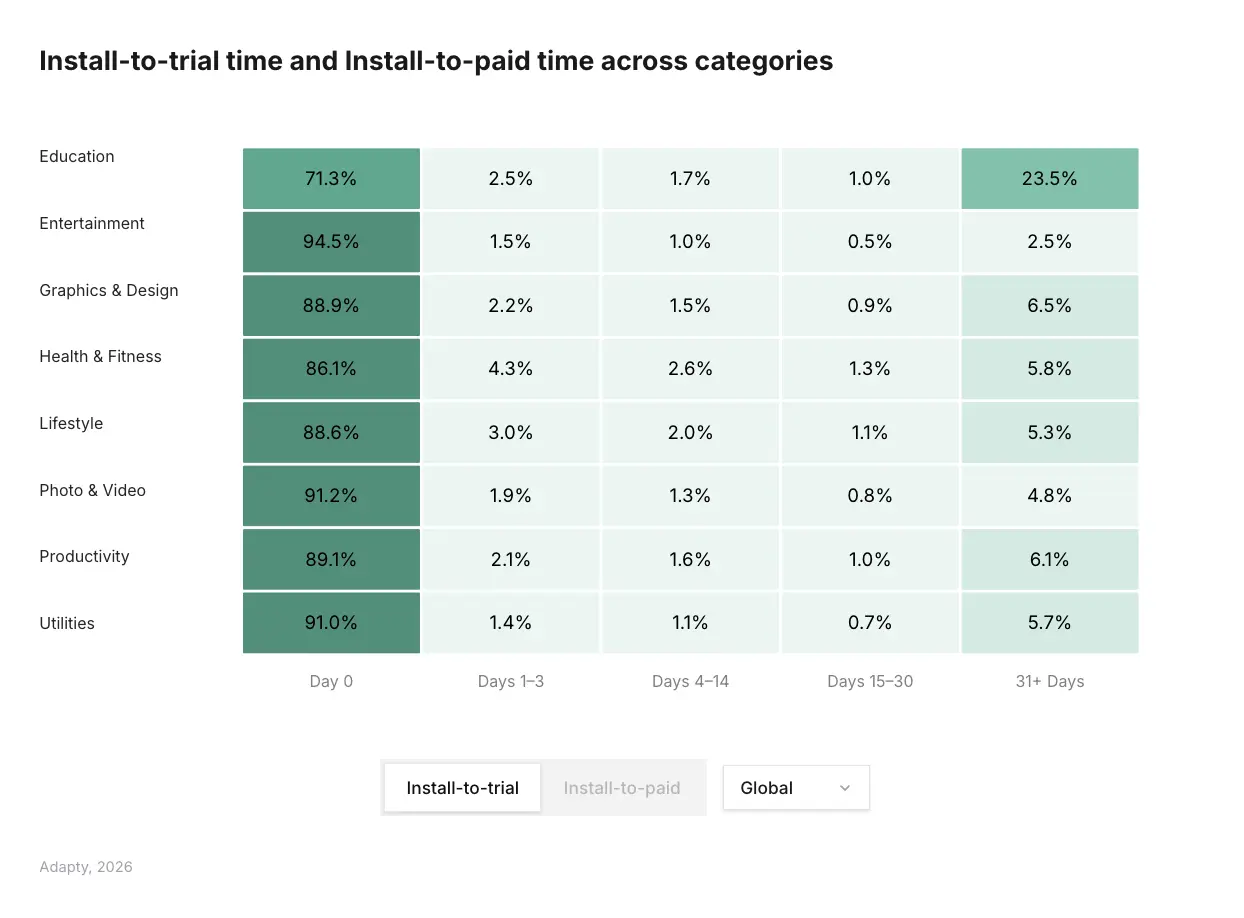
89.4% of trial starts happen on Day 0 — your first-session paywall is your highest-leverage surface. For Productivity apps that do use trials, this means your onboarding paywall is where almost all trial acquisition happens. Everything after Day 0 is a rounding error. If the paywall isn't converting in the first session, no re-engagement sequence will make up for it.
Apps that run experiments earn 40x more than those that don't. The specific test order matters: pricing structure first, then plan duration, then localization, then visual elements. Most teams run this backward.
For Productivity specifically, the highest-impact experiments tend to be plan structure (weekly vs. weekly + annual vs. all three) and trial placement (annual only vs. all plans vs. none). Visual changes move conversion less than most teams expect.
Productivity benchmarks at a glance
| Metric | Productivity benchmark |
| Average 12-month LTV (all plans) | $46.97 |
| Direct buyer 12-month LTV | $56.95 |
| Trial user 12-month LTV | $49.13 |
| Trial LTV premium vs. direct | -13.7% |
| Weekly revenue share | 66% |
| Install-to-trial rate (weekly, trial) | 9.8% |
| Trial-to-paid rate (weekly, trial) | 29.5% |
| 1-year retention | 14% |
| Best country-category (install LTV) | US Productivity, #1 globally |
Data source
All benchmarks in this article are drawn from Adapty’s State of In-App Subscriptions 2026 report, based on data from 16,000+ apps processing over $3B in subscription revenue. The full interactive report — filterable by category, region, and plan type — is available here.