TL;DR
- Most apps test the wrong things in the wrong order, wasting months on visual tweaks while missing 80% of revenue uplift.
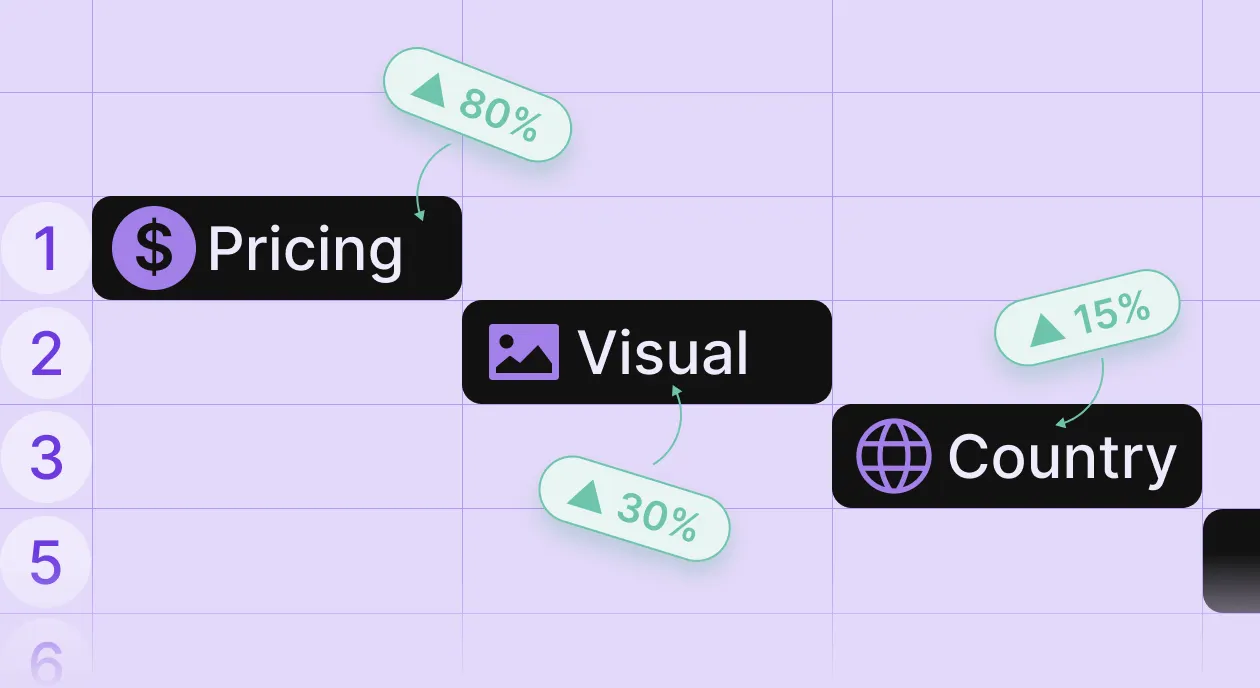
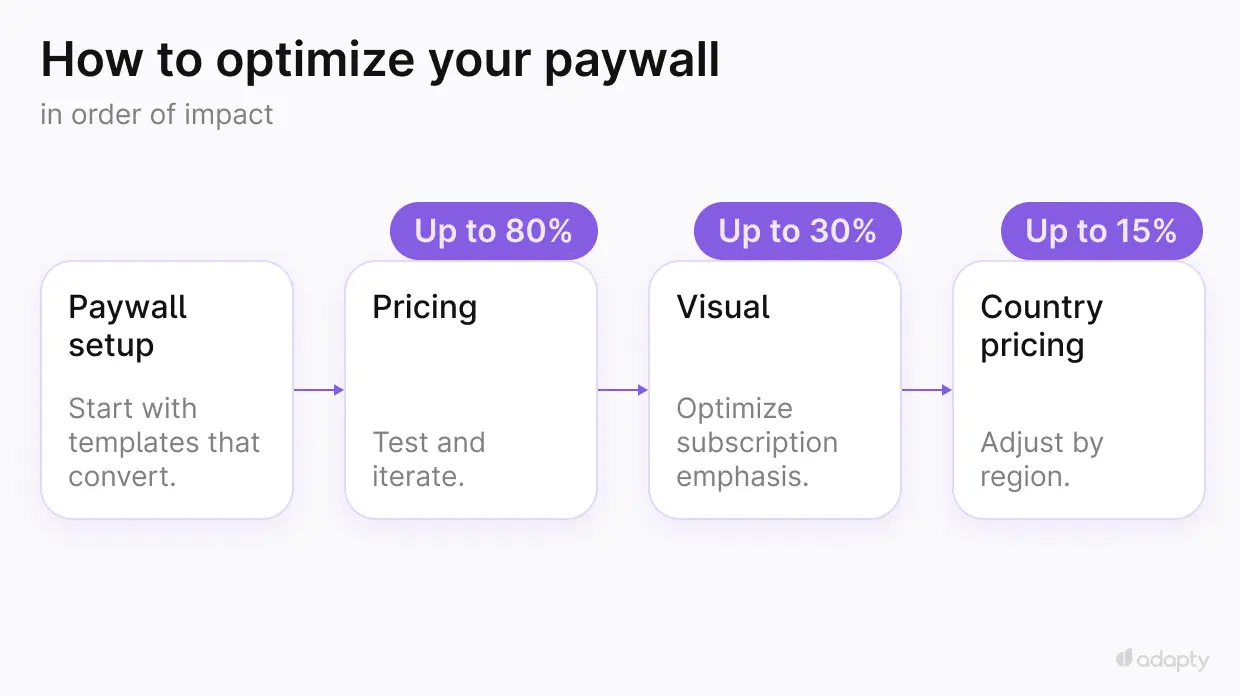
- The proven sequence: pricing experiments first (up to 80% uplift), visual optimization second (up to 30% uplift), country-based pricing third (up to 15% uplift).
- Apps that run regular A/B tests have 74% higher average MRR than those that don’t.
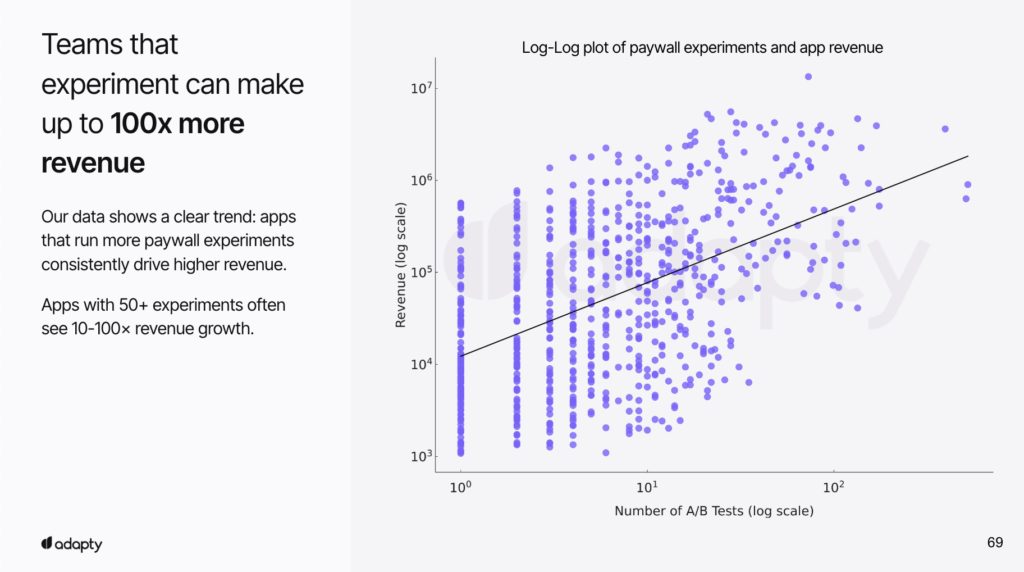
- Apps with 50+ experiments see 10-100x revenue growth compared to apps that rarely test.
- You need at least 200 subscriptions per variant to reach statistical significance. Most apps stop testing way too early.
Here’s what I’ve learned from analyzing monetization data across 15,000+ subscription apps: most teams approach paywall experiments backwards.
They spend weeks debating button colors and whether to add a “Close” button. They test five different background images. They argue about whether reviews should go above or below the fold.
Meanwhile, their pricing, the single biggest lever for revenue growth, hasn’t been touched in 18 months.
This isn’t a criticism. I get it. Pricing changes feel risky. What if conversion drops? What if you lose users? Visual experiments feel safer because they seem less likely to break things.
But the data from Adapty tells a different story: pricing experiments deliver 2-3x more uplift than visual changes, and apps that don’t test pricing systematically are missing out on massive revenue.
This guide covers the exact testing sequence that works: what to experiment with first, what to save for later, and how to make decisions from your results.
Why does testing order matter?
When you test everything at once or worse, test randomly based on what your designer finished this week, you create two problems:
Problem 1: You can’t isolate what’s working. Changed your pricing AND your background image AND added reviews in the same test? Good luck figuring out which change drove the 15% conversion lift.
Problem 2: You optimize the wrong things. Visual tweaks might increase conversion by 10%, but if your pricing is 30% below market rate, you just made it easier for people to buy something underpriced.
The most successful apps follow a clear sequence:
- Pricing experiments (highest potential uplift: up to 80%)
- Visual optimization (medium potential uplift: up to 30%)
- Country-based pricing (targeted uplift: up to 15%)
Phase 1: Pricing experiments
Start here. Not because it’s easy, but because it matters most.
Why pricing comes first
Pricing experiments have the highest ceiling for revenue impact. In Adapty’s data, the difference between a well-optimized pricing strategy and a mediocre one can be 80% in additional revenue — not from getting more users to convert, but from capturing more value from the users who were going to convert anyway.
Most apps set their prices once, maybe check what competitors charge, and never touch them again. Three years later, the market has shifted, user willingness-to-pay has changed, and they’re still charging $9.99/month because that’s what they launched with.
Here’s what happens: Your competitors have been testing. The market rate has moved. Your pricing is now either too low or too high relative to what you deliver (capping conversion unnecessarily).
The basic testing framework
Launch 2-3 pricing variants in a 50/50 split:
Test 1: Increase your primary subscription price by 20-30%
If you’re at $9.99/month, test $11.99 or $12.99. Most apps are underpriced relative to the value they deliver — but before you raise prices, check your market benchmarks and conversion rates to understand where you actually stand. You’re looking for the point where conversion drops less than price increases — that’s pure revenue upside.
Test 2: Add or change duration options
If you only offer monthly and annual, test adding a weekly option (common in fitness and health apps). If you have weekly + monthly, test replacing monthly with quarterly (works well for productivity apps where users need time to build habits).
Test 3: Adjust trial lengths
If you’re offering a 7-day trial, test 3 days. Shorter trials often convert trial users to paid at higher rates because users don’t have time to forget about the charge. For annual subscriptions, test longer trials (14 days) to give users more confidence in committing to a full year.
What metrics to look for
You’re comparing two metrics:
- Conversion rate (views to trial, trial to paid)
- ARPU (average revenue per user)
If conversion stays roughly flat while ARPU increases, you’ve found free money. If conversion drops 10% but ARPU increases 30%, you’re still net positive.
→ Use Adapty’s P2BB feature to gain predictive insights on which paywall is likely to win — it helps you make informed decisions faster.
The mistake most teams make is stopping a test as soon as they see a conversion dip. Conversion is not the goal. Revenue is the goal.
Run it long enough
You need at least 200 subscriptions per variant to reach statistical significance. For most apps, that’s a minimum of 2-4 weeks. I’ve seen teams stop tests after 3 days because they panicked about a conversion drop; don’t do this.
If you’re running a trial + weekly subscription, you need to wait through the trial period plus at least one renewal cycle to see actual retention behavior. For monthly subscriptions, that means tests should run 4-6 weeks minimum.
Competitor research matters
Before you test, look at what successful apps in your category are charging. Not to copy them blindly, but to understand the range. If every top health app charges $10-15/week and you’re at $6/week, you have room to test upward.
Check:
- Their visible pricing
- Which durations do they emphasize (weekly vs monthly vs annual)
- Trial lengths
- Whether they use free trials or paid trials
Tools that help: SensorTower, AppFigures, or just manually downloading competitor apps.
→ For Adapty customers, the Autopilot tool does this competitor analysis automatically and generates pricing test recommendations based on market data.
Common pricing test results
From Adapty’s experience:
- Weekly pricing tests: Apps that increased weekly prices from $7.99 to $9.99 typically saw conversion drop 5-8% but ARPU increase 18-22%. Net revenue positive.
- Annual subscription tests: Apps that added annual subscriptions (where they previously only had monthly) saw 15-25% of new subscribers choose annual, improving LTV significantly.
- Trial length tests: Apps that shortened trials from 7 days to 3 days saw trial-to-paid conversion increase by 12-18% on average, and users didn’t forget about the upcoming charge.
Phase 2: Visual optimization
Once you’ve found your pricing plateau, the point where further price increases tank conversion more than they increase ARPU, move to visual experiments.
Why visual comes second
Visual changes impact conversion rate, but they don’t change the economics of your pricing. If you optimize visual conversion before pricing, you’re just getting more people to buy something potentially underpriced.
Do pricing first, find the optimal price point, then optimize how many people convert at that price.
What visual elements should you test?
Test 1: Close button (“X”) presence
Hard paywalls (no close option) vs soft paywalls (with a close button). Counterintuitively, adding a close button sometimes increases conversion, users feel less trapped and more willing to engage. This varies heavily by app category.
Fitness apps often do better with hard paywalls. Productivity and education apps often do better with a subtle close option.

Test 2: Social proof elements
Adding reviews or ratings to the paywall. Five-star ratings, user testimonials, or “X users subscribed this week” callouts. This works best when your app actually has strong reviews; don’t manufacture fake social proof.
Test 3: Video vs static background
Apps with video backgrounds often see 8-15% conversion increases. The movement catches attention and can demonstrate product value. But videos must be high quality; a poorly shot or laggy video is worse than a static image.
Test 4: Subscription emphasis
How do you visually emphasize the “best value” option? Most apps want users to pick annual subscriptions (highest LTV). Test:
- “Most popular” badges
- Highlighting the annual with color or size
- Showing monthly price on annual (“$3.99/month, billed annually at $47.99”)

Visual testing cadence
Unlike pricing tests (which you should run one after another until you find the plateau), visual tests can run in parallel if you’re testing different elements. You can test the close button vs no close button at the same time you’re testing the video vs static background, as long as each experiment is properly isolated in your A/B testing setup.
Each visual test should run for 2-3 weeks, targeting at least 200 conversions per variant.
Don’t overthink it
I’ve seen teams spend a month debating which shade of purple converts better. This is not the work. You’re looking for structural changes that meaningfully impact conversion — 10%+ movements. If you’re testing things that might move conversion by 2%, you’re in the weeds.
Phase 3: Country-based pricing
Country-based pricing is powerful, but it’s the most complex to implement and analyze, which is why it comes last.
When to move to country pricing
Only start country-based pricing experiments when:
- You’ve found your optimal pricing structure (phase 1 complete)
- You’ve optimized visual conversion (phase 2 complete)
- You have meaningful traffic from multiple countries (not 90% US)
If 85% of your revenue comes from the US, UK, and Canada, country-specific pricing won’t move the needle enough to justify the complexity.
How to approach it
Start with the Adapty Pricing Index. This shows optimal pricing ratios by country. For example:
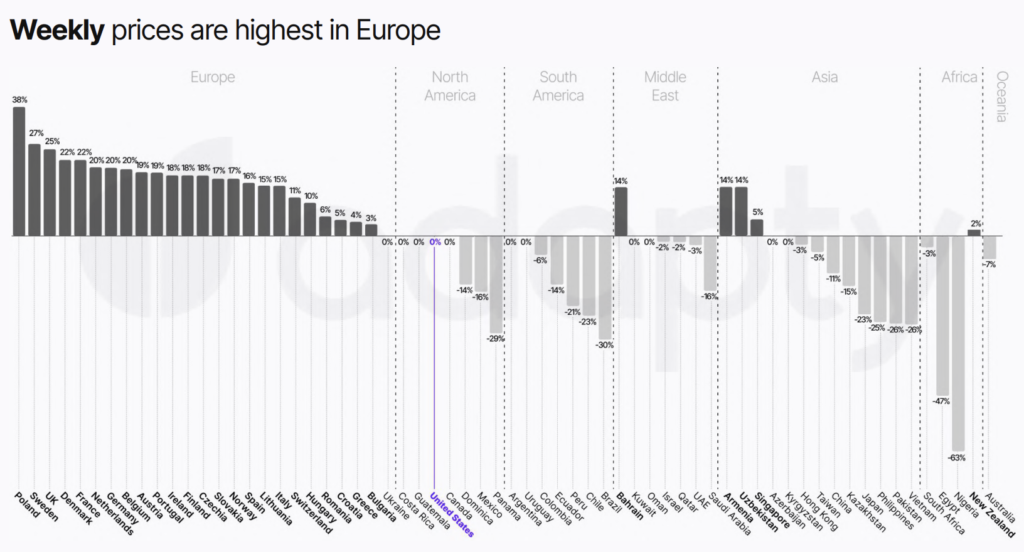
Test pricing in your top 5-7 countries first. Don’t try to optimize all 200 countries; focus on where you have volume.
Country-specific considerations
Currency psychology matters. Pricing at €9.99 vs €11.49 isn’t just about the number. European users are used to seeing .99 pricing. Respect local pricing conventions.
Localize the paywall itself. If you’re going to charge country-specific prices, localize the language too. A German user seeing English text and Euro pricing feels half-baked.
Testing approach
Unlike phases 1 and 2, country pricing doesn’t work well as an A/B test within a country (half of the US users see $9.99, half see $14.99, which creates fairness issues).
Instead, test by changing the price in that country and comparing it to the historical baseline. Watch conversion rate, ARPU, and churn over 4-6 weeks. If metrics improve or hold steady, keep the change. If they tank, revert.
This is less scientifically pure than A/B testing, but more practical for pricing changes where users in the same market see different prices, which creates problems.
Setting up the test
- Pick your placement. If you have multiple paywalls (onboarding, settings, feature gates), start with the one that drives the most revenue. Don’t test everything at once.
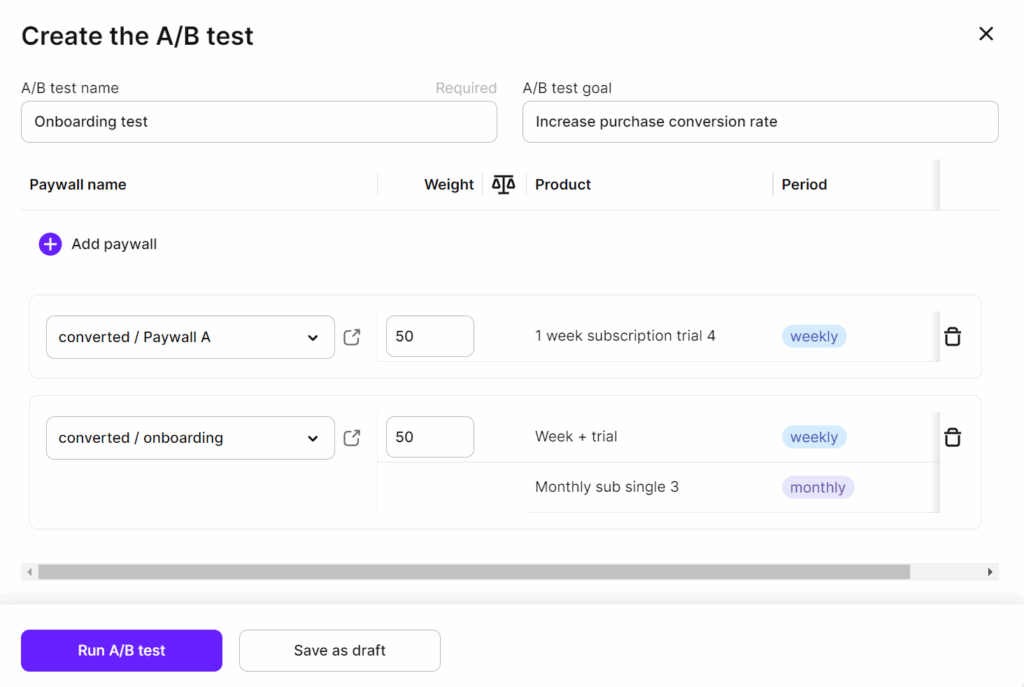
- Create your variants. In Adapty, this means:
- Duplicate your current paywall. Change the pricing (phase 1) or visual elements (phase 2). Set up a 50/50 traffic split
3. Launch and wait. Resist the urge to check results every 6 hours. Set a reminder for 2 weeks. Check once a week, maximum.
Analyzing results
Track these metrics per variant:
- Paywall views
- Trial starts (if applicable)
- Purchases
- Conversion rate (purchases/views)
- ARPU (average revenue per user who saw the paywall)
- Trial-to-paid conversion (if using trials)
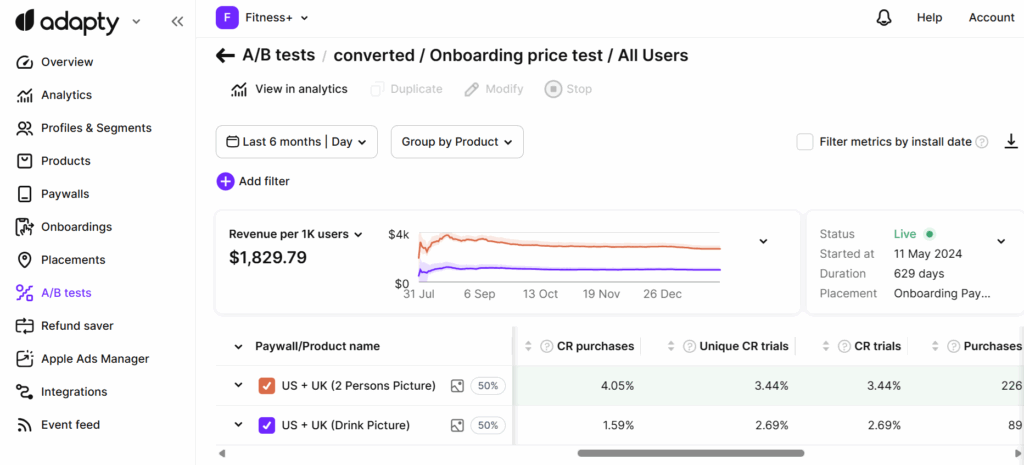
The winner is whichever variant has the highest ARPU, not the highest conversion rate.
When to stop a test
Stop when:
- You hit 200+ subscriptions per variant, OR
- You’ve run for 4+ weeks, whichever comes first
Don’t stop early just because one variant is winning. Randomness happens. Wait for statistical significance.
What to do with the results
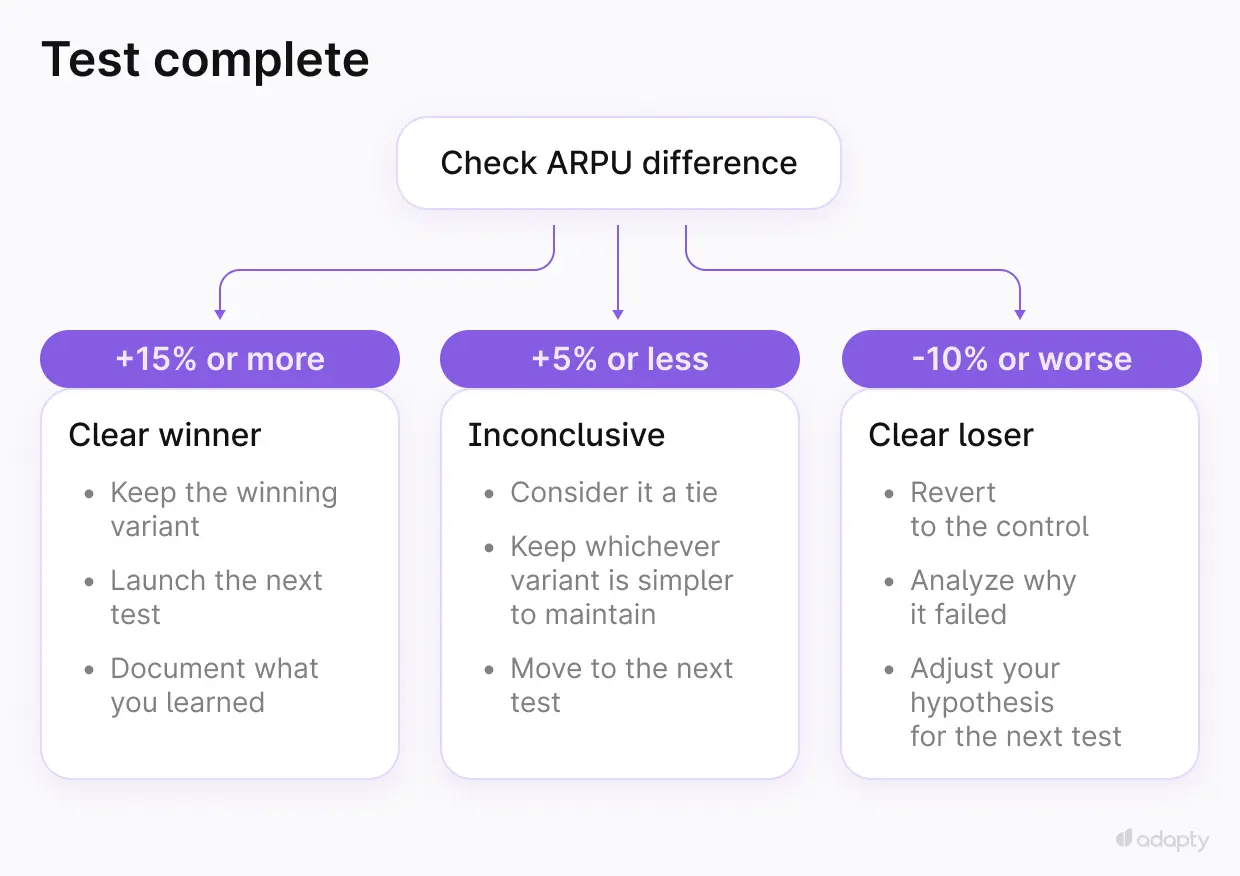
If you have a clear winner (15%+ improvement in ARPU):
- Keep the winning variant
- Launch the next test in the sequence
- Document what you learned
If results are inconclusive (less than 5% difference):
- Consider it a tie
- Keep whichever variant is simpler to maintain
- Move to the next test
If the new variant loses (10%+ worse ARPU):
- Revert to the control
- Analyze why it failed
- Adjust your hypothesis for the next test
The discipline problem
The apps that grow slowly versus the apps that grow fast? Both understand testing. The difference is frequency. Slow-growth apps test occasionally. Fast-growth apps always have a test running.
Here’s what I see in apps that grow versus apps that stagnate:
Apps that grow: Always have at least one A/B test running. When a test concludes, the next one launches within a week. They test 12-20+ times per year. They document results. They make incremental improvements compound.
Apps that stagnate: Run a test every 3-4 months. Stop testing when things are “good enough.” Don’t have a systematic approach to what to test next.
The apps with 50+ experiments see 10-100x revenue growth compared to apps with fewer than 5 experiments. It’s because they’ve built a discipline of continuous experimentation.
How Autopilot solves this
The hardest part of paywall experimentation isn’t running the tests — Adapty’s A/B testing tools handle that. The hardest part is knowing what to test and when.
Autopilot generates data-driven test recommendations by:
- Analyzing your current pricing and paywall setup.
- Researching your competitors’ strategies (what they charge, which durations they offer, trial lengths).
- Comparing your conversion metrics to category benchmarks.
- Recommending specific tests in priority order.
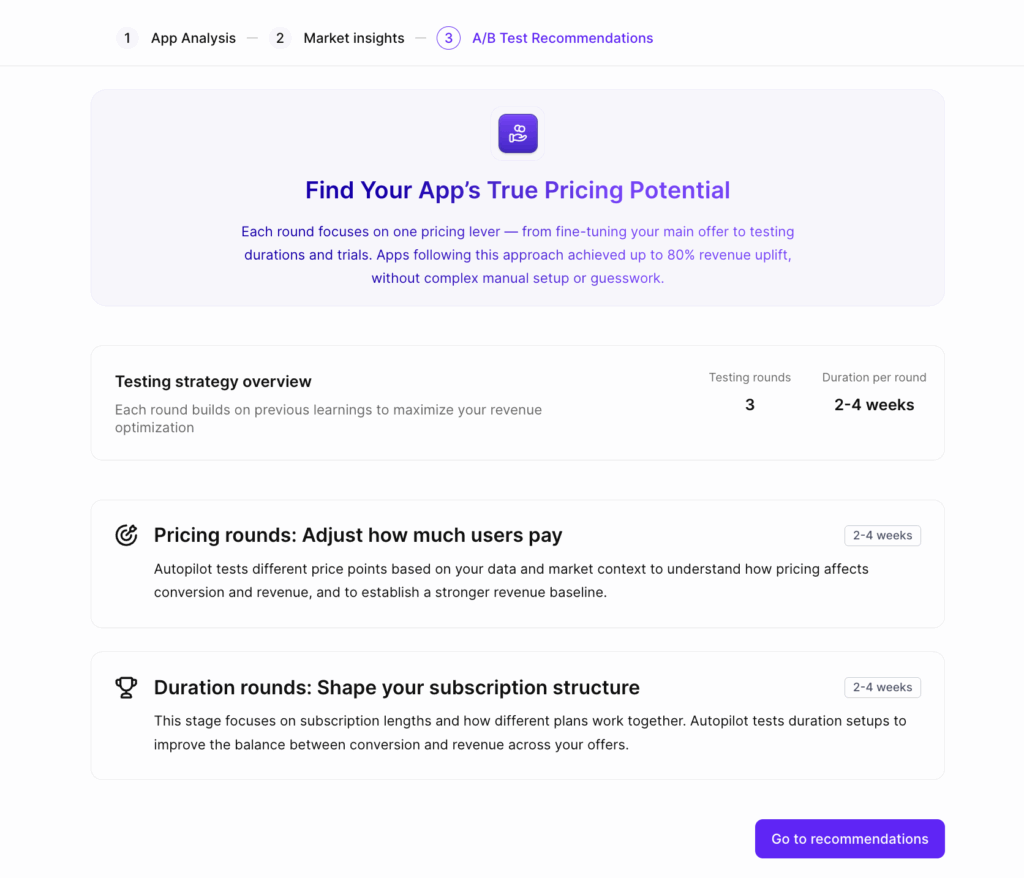
Instead of guessing whether you should test increasing your monthly price or adding an annual option, Autopilot tells you: “Test increasing your monthly price from $9.99 to $11.99 first — your conversion rate is 8% above category average, indicating room for pricing expansion.”
Then, when that test completes, it recommends the next one. It’s the testing sequence from this article, automated based on your actual data. For teams that want to experiment more but don’t have a dedicated growth person to own the testing roadmap, Autopilot removes the “what should we test next?” paralysis.
The bottom line
Most apps treat experimentation like a nice-to-have. They test when they remember to, or when someone has a “brilliant idea” about a paywall redesign.
The apps that actually grow treat experimentation like infrastructure. There’s always a test running. Results are documented. The next test launches within days of the previous one concluding.
Follow the sequence: pricing first, visual second, country-based third. Run tests long enough to reach significance. Make decisions based on ARPU, not conversion rate alone.
If you do this consistently, 12-20 tests per year. The data says you’ll have 74% higher MRR than apps that don’t. That’s not a promise. That’s what we observe across thousands of apps at Adapty.
Start with pricing. Test your current rate against a 20% increase. Wait 3 weeks. Check the data. Move to the next test.
The work is simple. The results are compound.