How to run paywall A/B testing without a growth team
TL;DR:
- Most subscription apps are running on pricing that was set at launch.
- Paywall A/B testing is on the list — it just never happens.
- The teams that win are the ones iterating fastest.
- This article covers what's actually worth testing on a paywall, why most experiments stall, and how Autopilot automates the analysis so one person can do what used to require a dedicated growth team.
Most subscription apps are running on pricing that was set at launch. The team knows it should be revisited. It just never happens.
To make a confident pricing decision, you need three things: whether your conversion rate is actually good for your category, what competitors charge in the markets where you generate revenue, and which change to make first. Most teams have none of this. So the default is to wait — a visual tweak here, some copy changes there. Pricing, the thing that moves revenue most, stays untouched.
For a studio with multiple apps, most of them sit on launch-day pricing while the flagship gets all the attention. For a small team already running some tests, experiments happen, but without market context, there's no way to know if you're testing the right things. For an app founder with one app, it means your paywall has never been seriously questioned — and you don't know what that's costing you every month.
What you can test on a paywall
| Category | Impact | When to test | What exactly |
| Pricing& duration | 🔥🔥🔥 Highest | First | Annual price, weekly anchor, trial length, plan order |
| Visual & UX | 🔥🔥 Medium | After the pricing is stable | Value framing, social proof, countdown timer, CTA position |
| Country-specific pricing | 🔥🔥🔥 Highest | In parallel | Per-country prices based on the conversion rate and purchasing power |
Visual tests on top of unstable pricing produce results that are hard to read. Get pricing right first — then layer on everything else. For a complete list of paywall experiments with impact scores for each experiment, see the paywall experiments playbook.
Why most teams get the order wrong
The three categories above interact. Add a weekly plan, and your annual price perception changes. Raise the annual price, and your conversion profile shifts. Run a visual test on top of an unstable pricing structure, and the result is hard to interpret.
The teams that get consistent results run pricing first, then duration, then visuals. Each subsequent test is easier to read when pricing is already settled, and the compounding effect across sequential rounds is where most of the uplift comes from.
The other thing most teams get wrong: they use US-only data to make pricing decisions, even when 30-40% of their revenue comes from other markets. If Japan is 15% of your revenue and you've never seen what competitors charge in Japan, you're making pricing decisions with incomplete information.
What is Autopilot, and how does it automate this
Most apps don't have a growth manager. Someone who watches the market, tracks what competitors are doing, spots where you're leaving money on the table, and comes back every month with a prioritized list of what to test next. Autopilot is that person — except it runs on Adapty's dataset of 20,000+ apps and doesn't need a salary.
Without a dedicated growth person, competitive research on pricing looks like this: find 10 comparable apps, manually check their prices across weekly, monthly, and annual plans, repeat for 5 countries, put it in a spreadsheet — then do it again in three months because the data is already stale. Most teams do this once at launch, if at all.
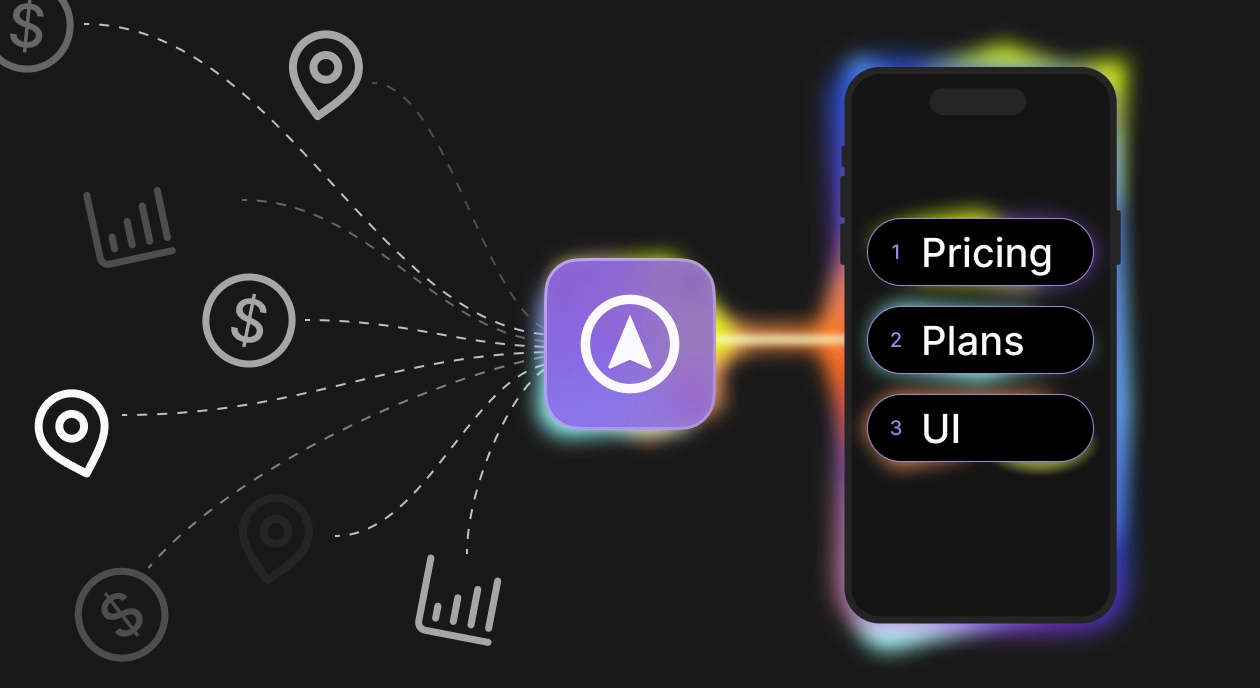
Autopilot replaces that process. It pulls competitor pricing from public App Store listings continuously, combines it with Adapty's aggregated benchmark data across 20,000+ apps, and layers in the Adapty Pricing Index for geo-pricing signals — and tells you exactly what to test first and why. The output is a prioritized experiment plan specific to your app, with explicit hypotheses you can act on immediately.
Some teams want the data and will draw their own conclusions. Others want a ready-to-run plan and just need someone to tell them where to start. Autopilot works both ways. Here's what the process looks like in practice:
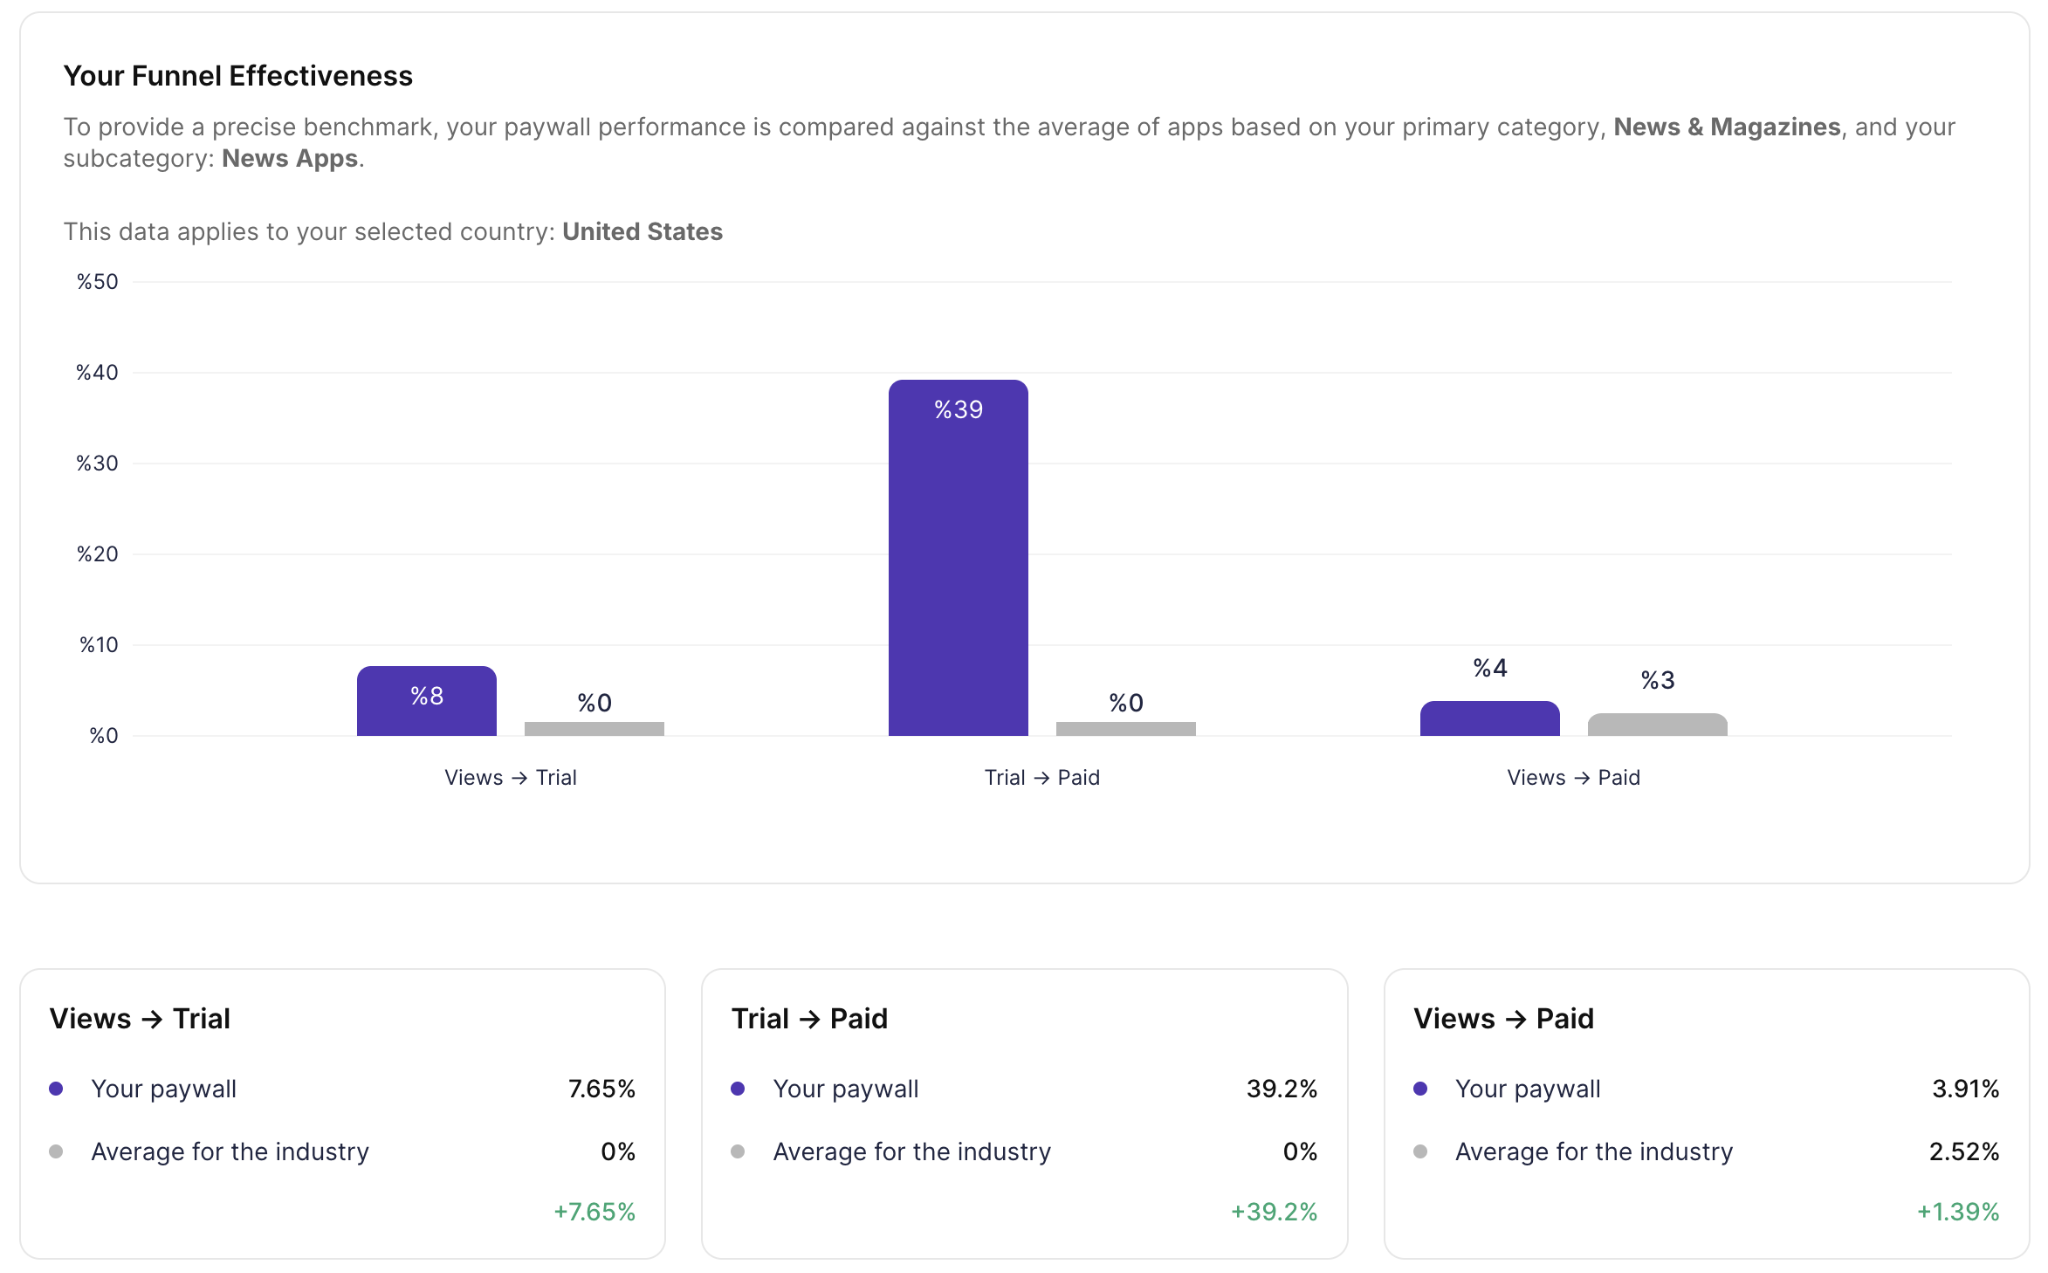
Step 1. Your performance, audited. Autopilot picks the paywall generating the most revenue from your top placement and pulls the full conversion funnel, views to trial, trial to paid, views to paid, plus revenue by country. Everything lands in one report.
Coming soon: ARPU benchmarks and product distribution data — so you'll see how your revenue and plan structure stack up against similar apps.
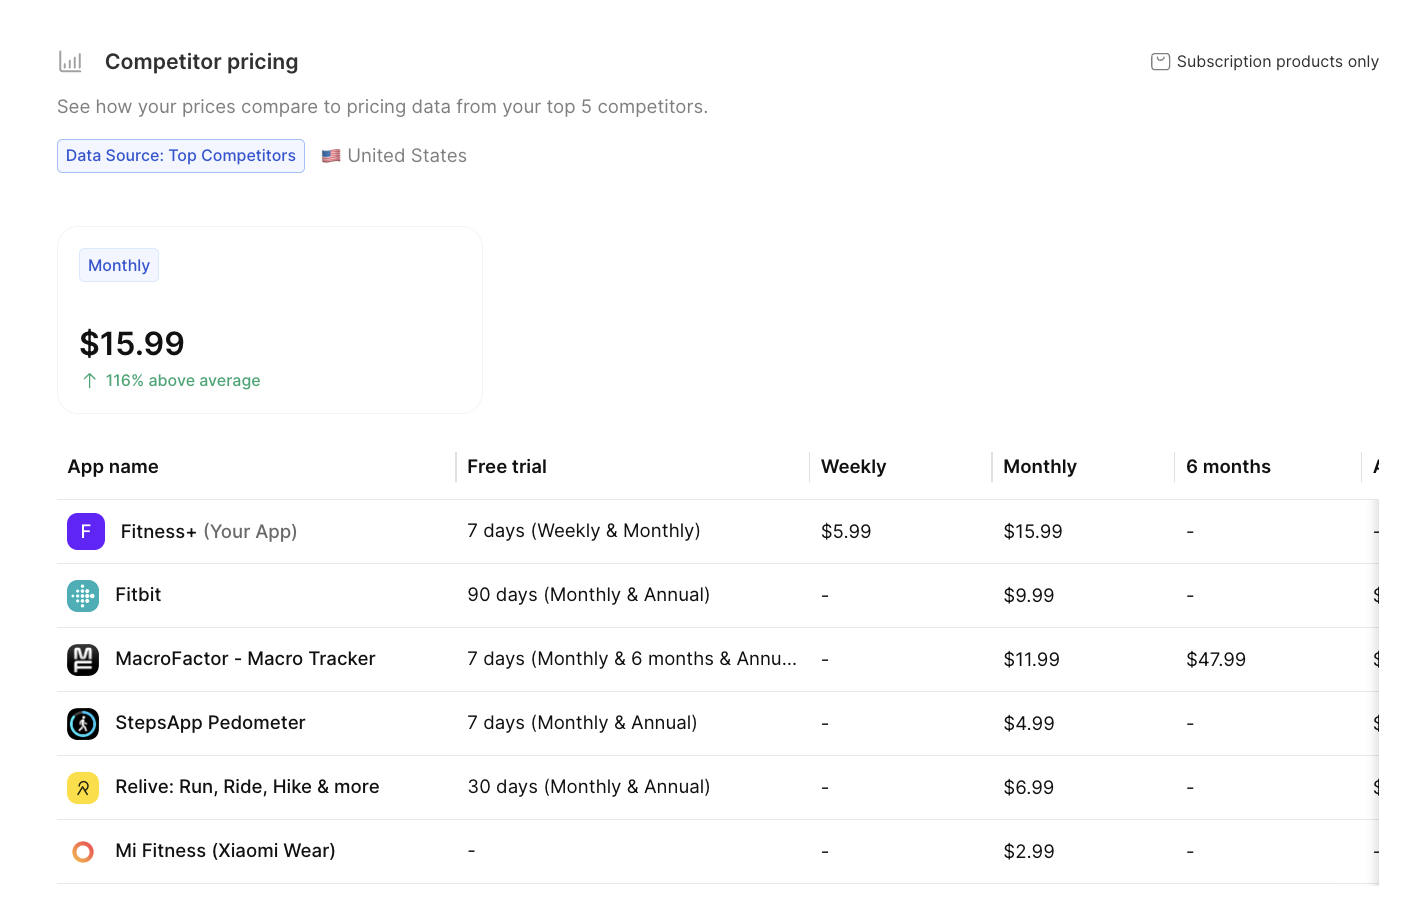
Step 2. Competitor data and benchmarks. You confirm a list of competitors — Autopilot suggests up to 10 based on your category and MRR. One deliberate choice worth making: pick apps with higher MRR than yours. The benchmark is more useful when you're comparing against where you want to be. Autopilot pulls their pricing across all durations and your top 5 markets, then compares your funnel metrics against subcategory and country averages — data you won't find in any public report.
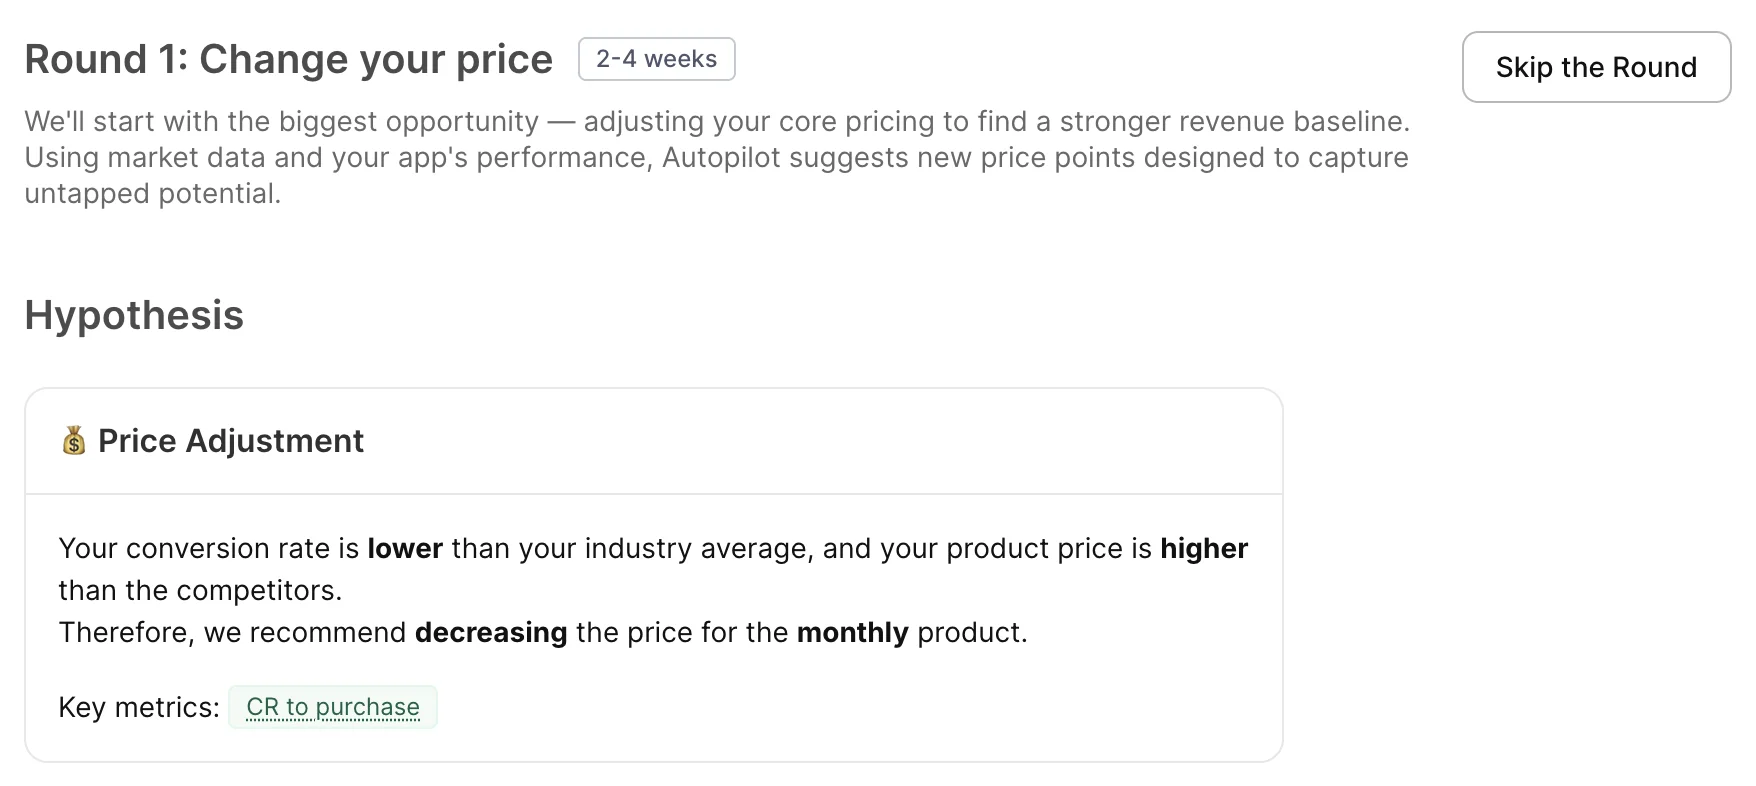
Step 3. Growth plan. Autopilot generates a prioritized list of A/B tests. Each hypothesis is explicit: your current metric, the benchmark it's measured against, the recommended change, and the reasoning behind it. Autopilot recommends. You decide what to test first. Don't agree with the price point — change it. Want to add your own hypothesis alongside Autopilot's — there's a form for that.
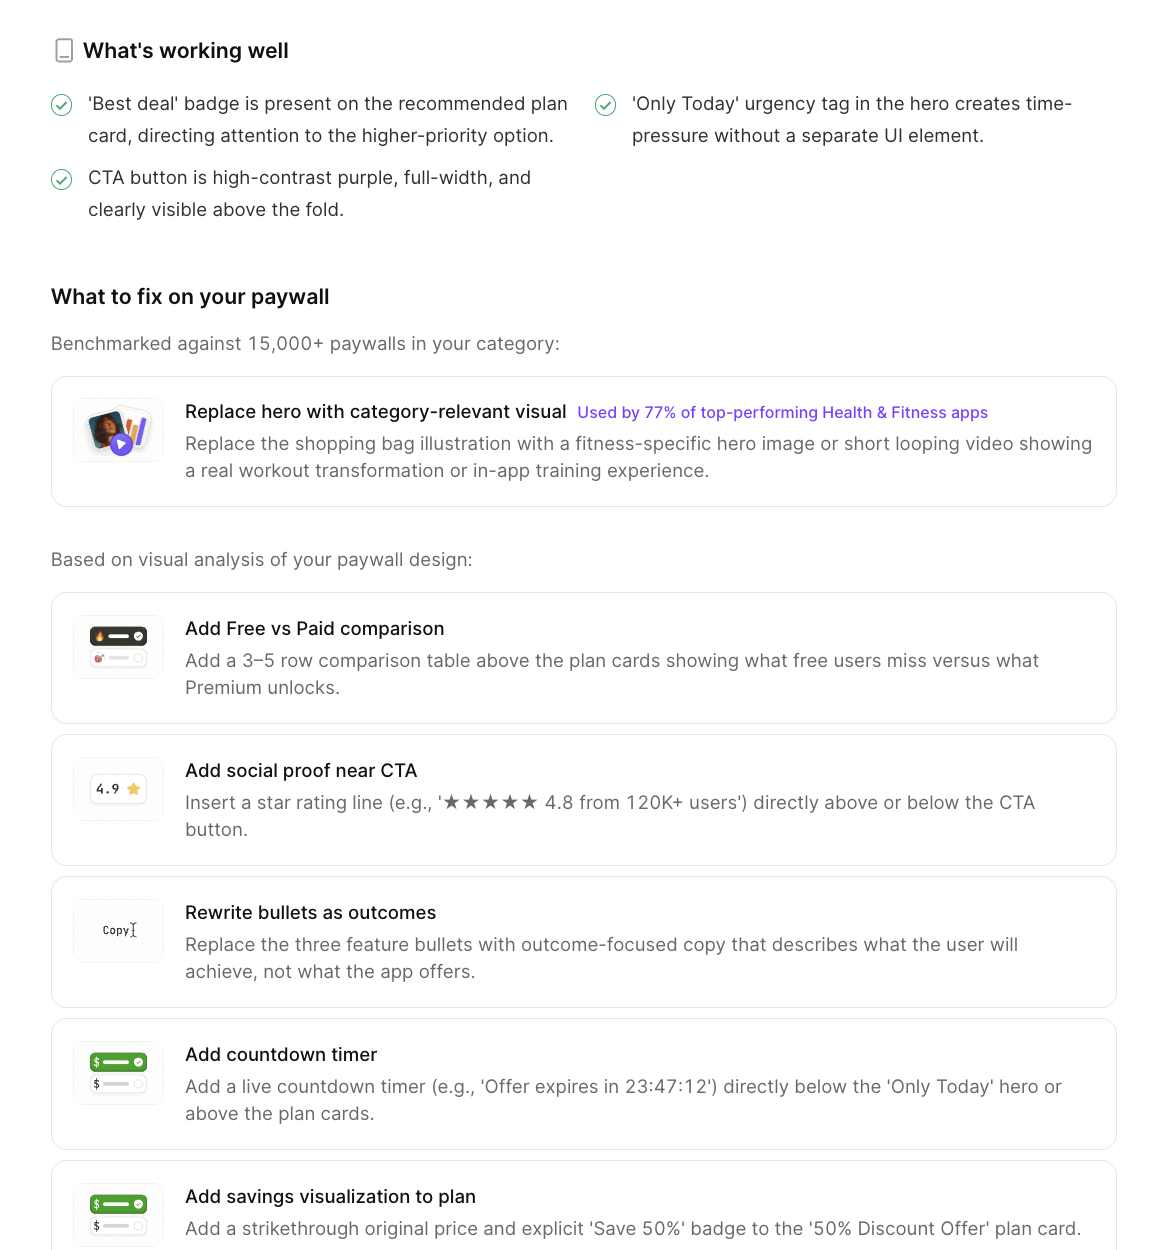
One of those hypotheses might look like this: “88% of top apps in your category use a social proof badge on the paywall. Yours doesn't”. It's a specific gap between your paywall and what's actually working in your category right now.
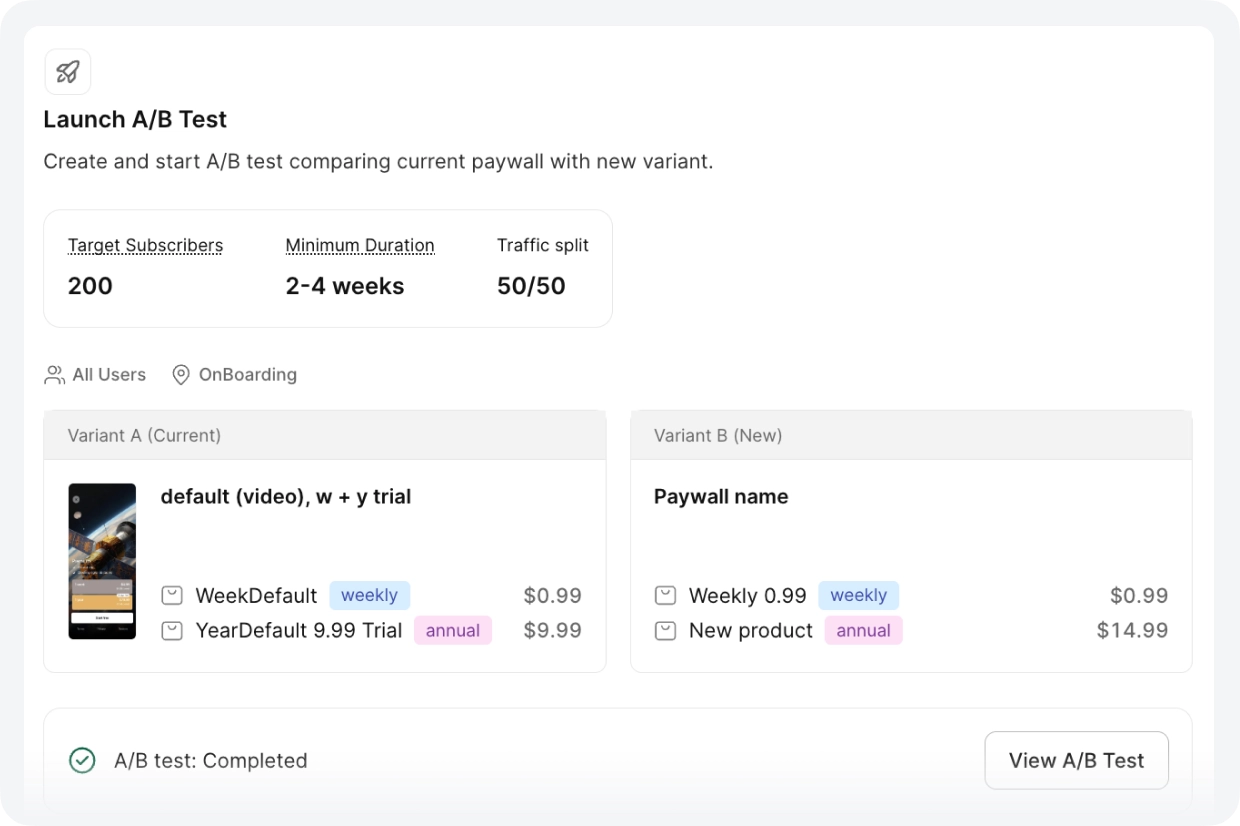
Step 4. Launch. Autopilot pre-fills the test configuration — variant A with your current paywall, variant B with the adjusted version, the right segment, 50/50 split. You review and launch. No code change required after the initial SDK integration. Each round takes about 15 minutes to set up. Before you launch, Autopilot shows you the minimum test duration and the target number of subscriptions needed to reach statistical significance — so you know upfront how long to run it and when the data is actually reliable.
What happens after the first cycle? When you finish a round, Autopilot already knows what to suggest next. When a competitor raises their price, it picks that up too. You don't have to go back and restart the process — it's been watching the whole time.
One thing worth understanding about the sequence: Autopilot runs rounds in a specific order — pricing first, then duration, then visuals — and skipping ahead makes results harder to interpret. Running a visual test on top of an unstable pricing structure produces results that are hard to interpret. And running all tests in parallel means you can't isolate what's actually moving the numbers. Each round builds on the previous winner — that's where the compounding comes from. You can reorder or skip rounds, but pricing before visuals is the default because each change is easier to read when only one variable moves at a time.
Here's a closer look at what each of the three data inputs actually gives you — and why it's hard to replicate manually.
Here's what Autopilot handles so you don't have to
Competitor data you don't have to collect
Manual competitive research — finding 10 comparable apps, looking up their pricing across weekly/monthly/annual plans, checking prices in 5 different countries — takes hours per app, and goes stale quickly. Most teams skip it or do it once at launch and never again.
Autopilot runs this continuously. The AppDevLabs team found that their flagship entertainment app was charging $14.99/year in a category where the average was $24.99. They were leaving $10 on every annual transaction. That gap was invisible until the competitive analysis surfaced.
Funnel benchmarks specific to your niche
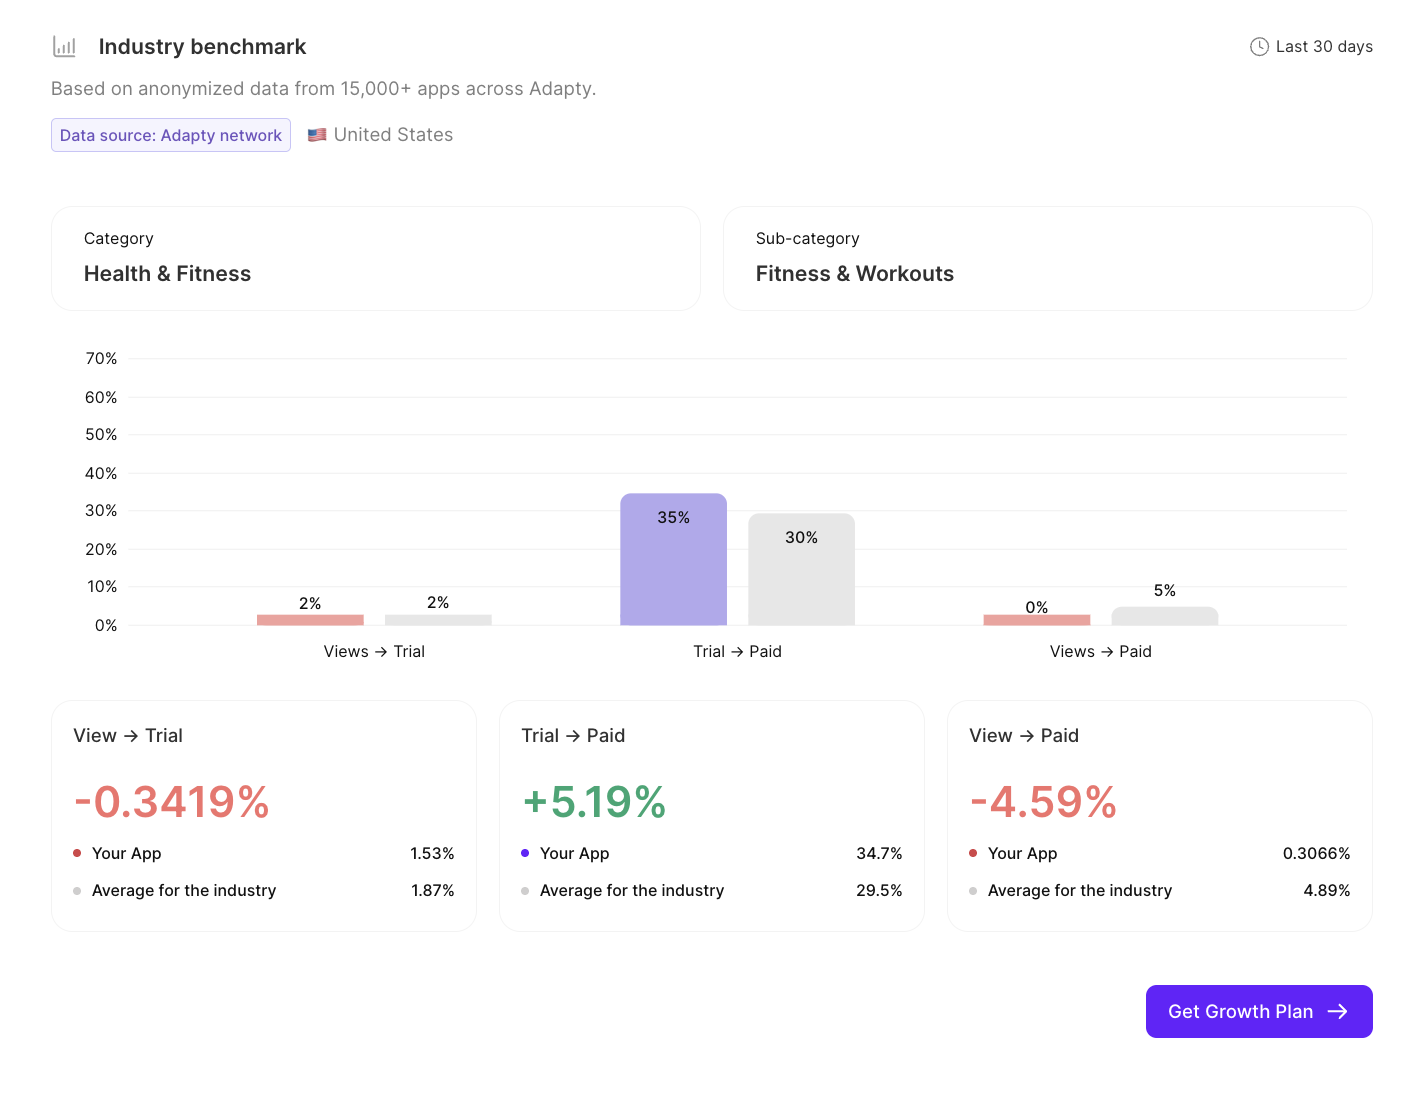
Your trial-to-paid conversion is 4.2%. Is that good? It depends on your subcategory and market — and that combination matters more than either dimension alone. A 4.2% conversion for a VPN app in Germany is very different from 4.2% for a meditation app in Japan. Adapty's benchmarks are built from data across 20,000+ apps and broken down by subcategory and country. That specificity is what makes the benchmark useful — and it's not available anywhere else.
Geo-pricing that takes one click to set up
Most pricing decisions are made with US data. But if you're generating revenue across multiple markets, you're almost certainly underpriced in some and overpriced in others — without knowing which.
For each of your top markets, Autopilot cross-references two signals: your install-to-paid conversion rate relative to your global baseline, and the Adapty Pricing Index (a purchasing power measure built from transaction data). High conversion relative to baseline means demand is strong, and the price may be too low. Low conversion means price is a barrier.
The output is a concrete recommendation per country — increase by ~18%, decrease by ~12% — that you can turn into a geo-pricing test with one click. Each test targets one country, runs as its own A/B test, and doesn't affect your other markets.
Before diving into Autopilot, it's worth checking Adapty's Price Radar — a free pricing check that shows how your pricing compares to competitors in any market, without signing up. It's a useful starting point to see where the obvious gaps are.
AI-paywall analysis
Autopilot goes beyond surface-level feedback and turns paywall optimization into a structured growth workflow. It analyzes your current paywall, compares your pricing and positioning against competitors, and highlights where your setup may be underperforming relative to the market.
In practice, this includes competitor research, industry benchmarks, and global pricing opportunities, followed by a concrete implementation guide with ready-to-test hypotheses. These recommendations can cover pricing changes, trial strategy, mix of subscription durations, and paywall design improvements.
What this looks like in practice
AppDevLabs: one person, five apps, 3 months
AppDevLabs runs five subscription apps across utilities, sports, and media. One person handles analytics, pricing, and experiments across the whole portfolio. They were already using Adapty for A/B testing — the problem wasn't infrastructure, it was knowing what to test on which app and in what order. They saw the gap themselves: "We knew we should be testing prices, visuals, templates — but we didn't have a clear strategy for where to start or what order to do things in. It was a blank page."
After three months with Autopilot,12 A/B tests across five apps, managed by one non-marketer, portfolio MRR was up 28%. The wins were different for every app. One needed a 67% price increase (utilities app: $9.99/year in a category where competitors charge $14.99, and conversion didn't move when they tested $14.99). Another needed a cut (media app: $19.99/year above the category average, more subscribers at $14.99, higher total revenue). A third revealed that raising the weekly price caused annual purchases to jump.
Each app needed something different. That's not something you figure out without running the analysis. Autopilot ran it continuously, in the background, and surfaced what each app actually needed.
Text on Pic: 30%+ revenue growth in 4 months
Text on Pic, an AI photo editing app, had a different problem: every pricing experiment required building a new paywall from scratch, shipping it, and waiting weeks for data that was often inconclusive.
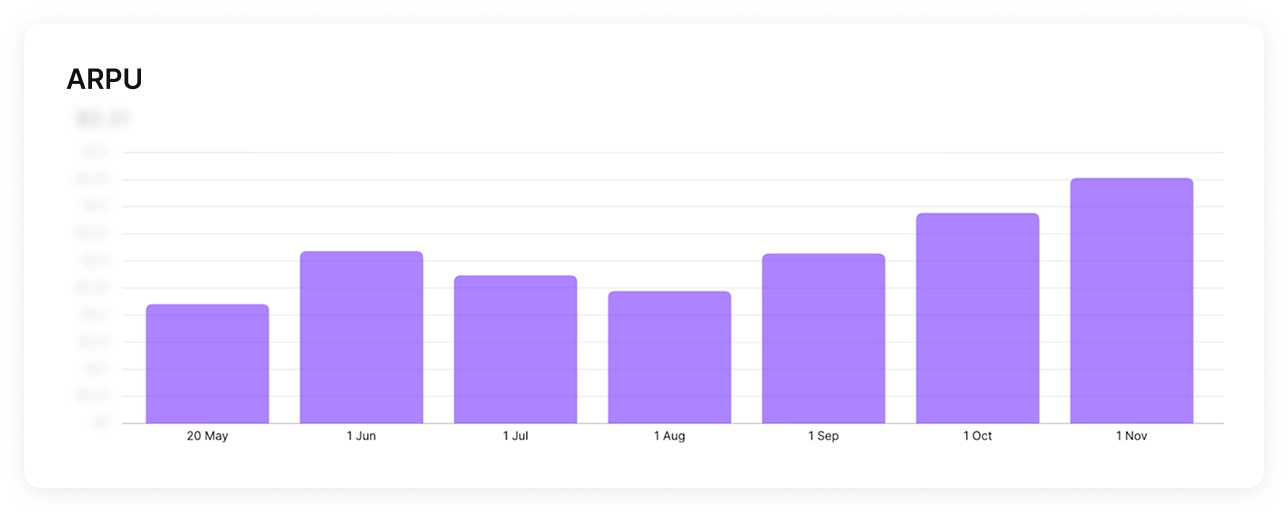
Founder Adeeb Haddad: "We were tired of guessing prices manually and waiting weeks for inconclusive results." After Autopilot's analysis, the team ran three sequential rounds — higher annual price, a weekly plan as an anchor, and then visual tests (countdown timer, free-trial toggle). Four months in: subscription revenue up 30%+, ARPU up ~50%.
Haddad's summary: "For us, using Autopilot is not so much about speed, but about courage. The tool gave us the confidence to run pricing tests we would not try manually. I'd call it a technical testing partner".
What your first Autopilot program could look like
Twelve weeks. Potentially three compounding wins. No growth team required.
- Week 1-2: Run the analysis. Review competitor pricing and your funnel benchmarks. Identify the biggest gap — usually the annual price or a missing weekly anchor.
- Weeks 3-6: Round 1 — pricing test. One change, clear hypothesis, 50/50 split. Let it run to significance (Autopilot tells you the minimum duration and target subscriber count).
- Weeks 7-10: Round 2 — duration structure. Add or remove a plan based on what Round 1 revealed about how users respond to pricing.
- Weeks 7-10: Round 2 — duration structure. Add or remove a plan based on what Round 1 revealed about how users respond to pricing.
- Weeks 11-14: Round 3 — visual. Now that pricing is stable, test one UI pattern — timer, toggle, layout change.
In parallel: Geo-pricing rounds for your top 2-3 international markets. Each runs independently and doesn't affect the main tests.
The best way to see where your current pricing stands before starting: check Adapty's Price Radar — free, no sign-up, takes 2 minutes. Then sign up for Autopilot and run the full analysis.