State of in-app subscriptions 2026: Key findings on app monetization
TL;DR:
- Weekly subscriptions now generate 55.5% of all app revenue — up from 43.3% two years ago
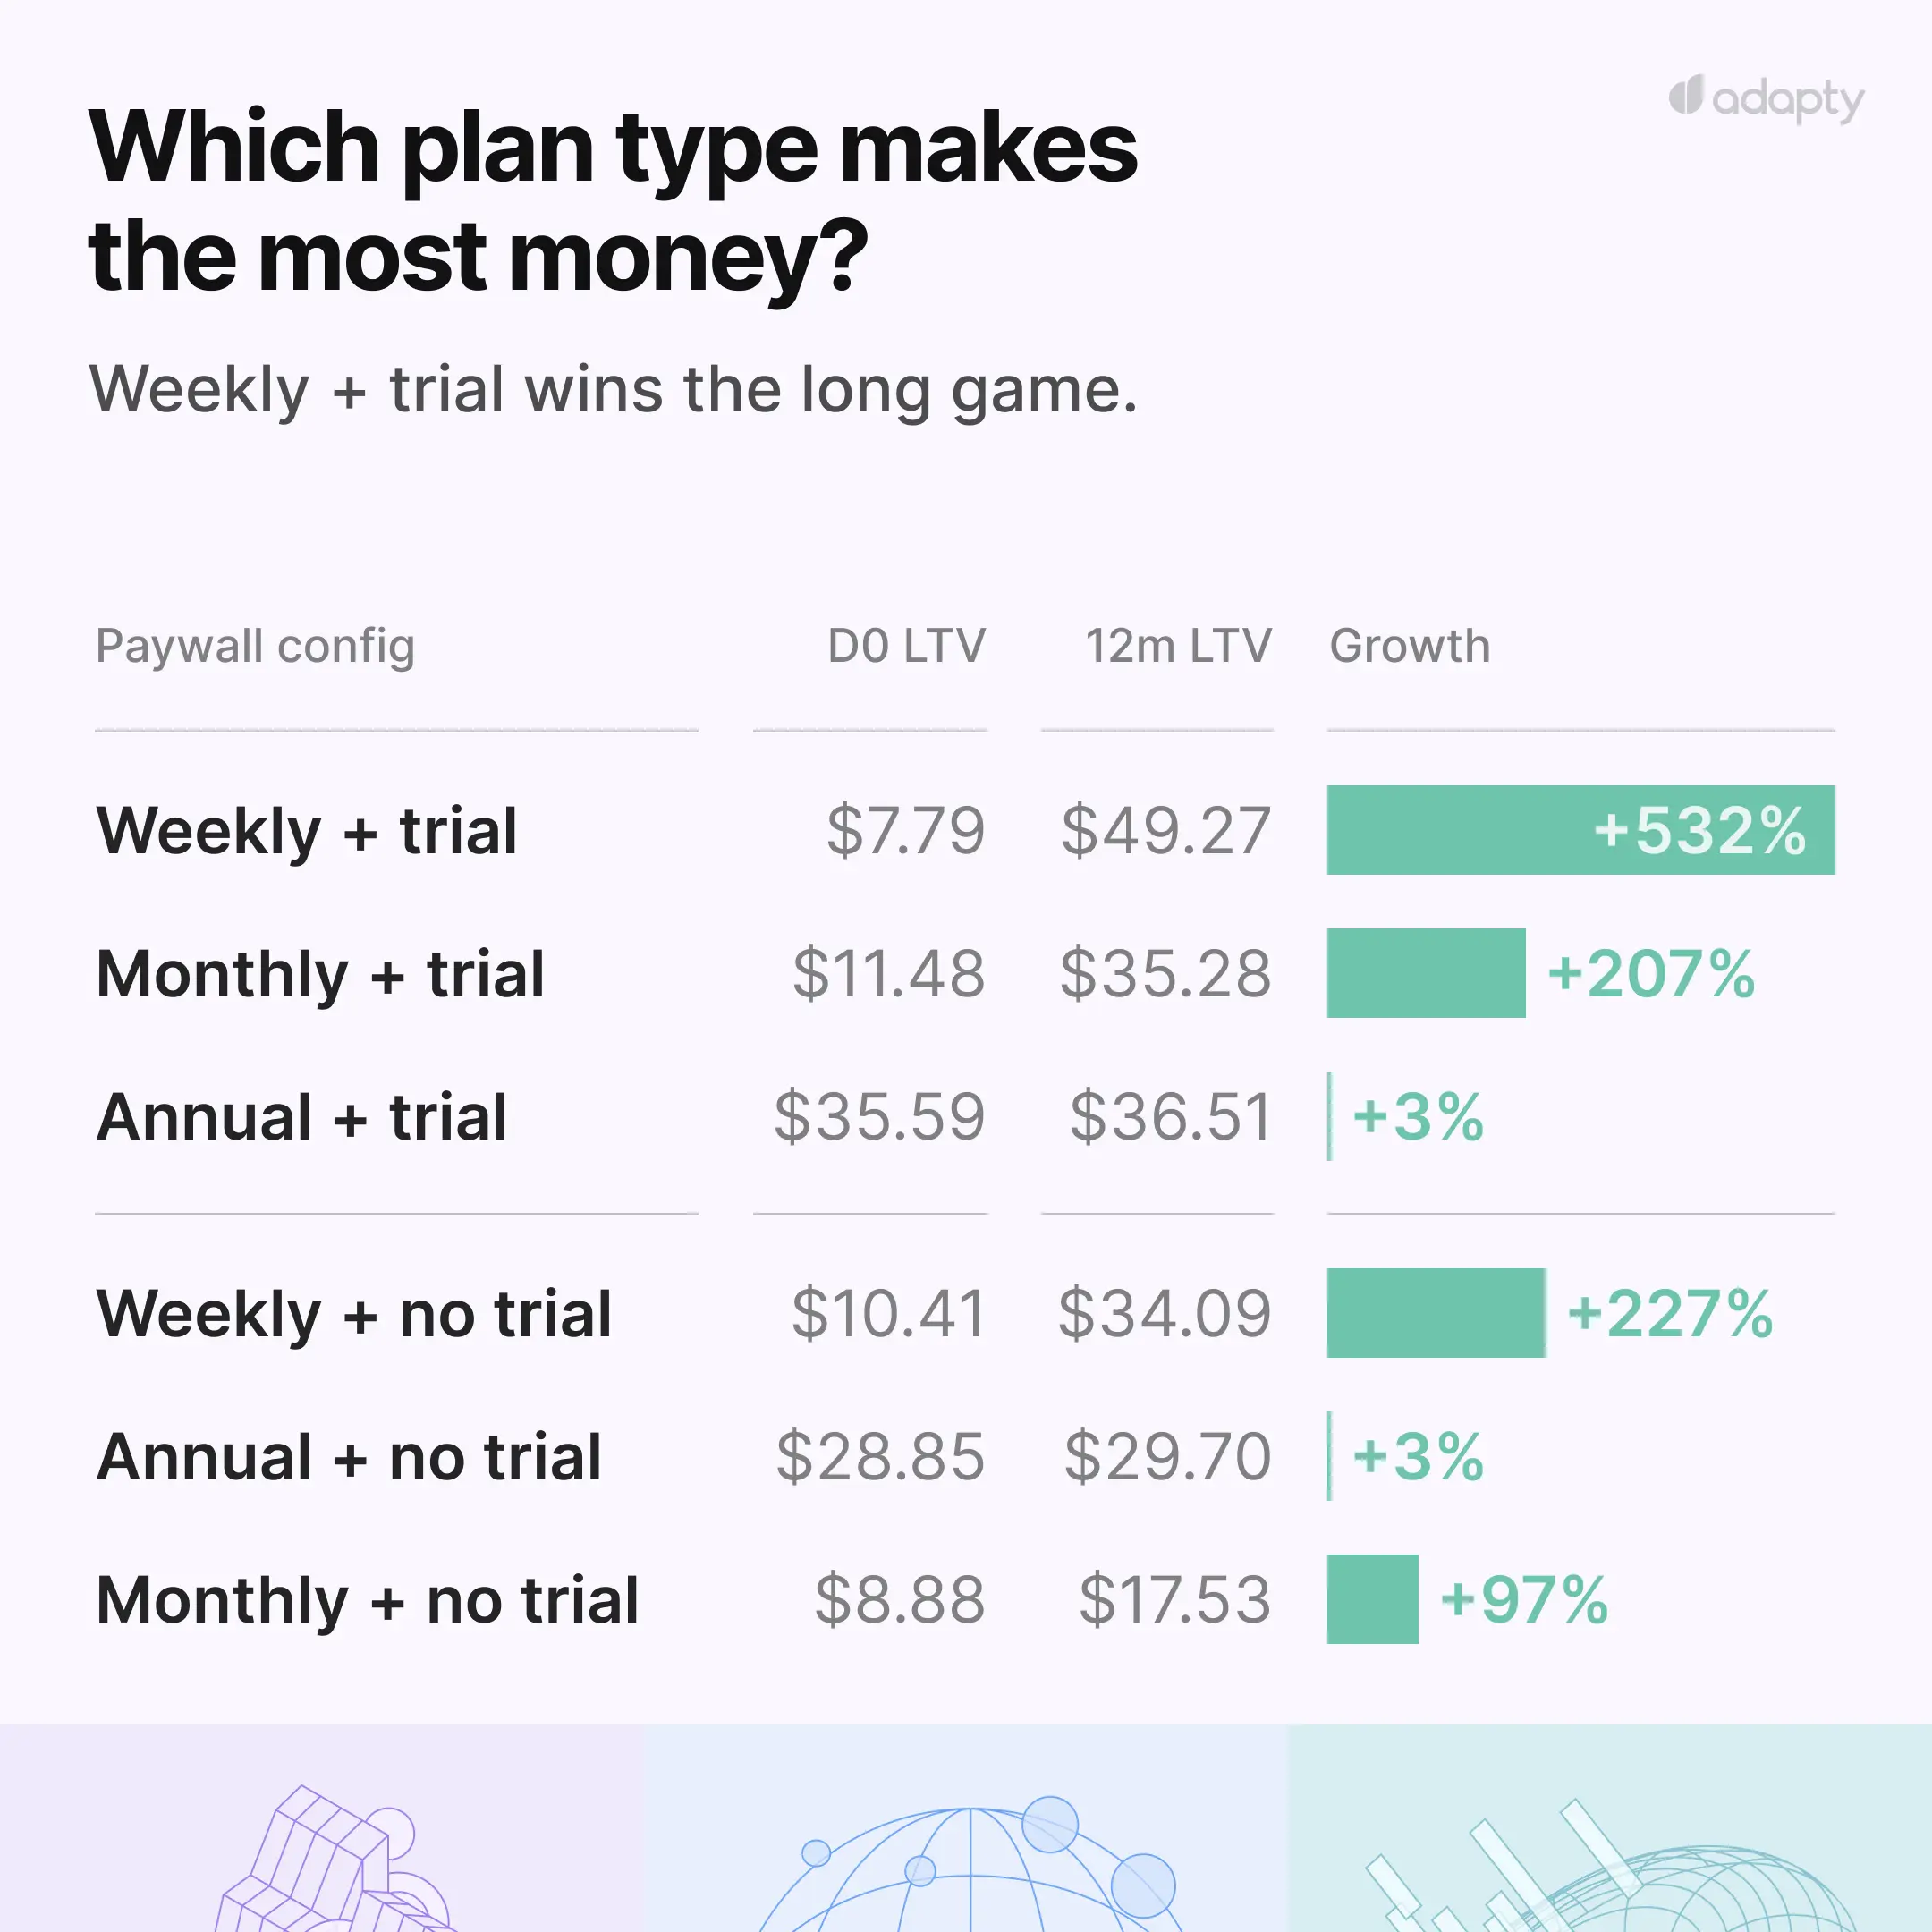
- The paywall configuration with the lowest Day 0 LTV delivers the highest 12-month LTV. Most teams are optimizing for the wrong metric
- 90% of trial starts happen on the day of install. Your onboarding paywall is your entire monetization strategy
- Apps that run 50+ experiments earn 18.7x more than apps that run just one
- Translating your paywall delivers more LTV uplift than repricing it
- 57.7% of new subscription apps never cross $1,000 in total revenue — this isn't a pricing problem, it's a product-market fit problem
Every year we look at the numbers, and every year I think: okay, we know what the trends are. Weekly plans are growing. Trials matter. Pricing matters. We've written about all of it.
Then the new data comes in, and I realize we were right about the direction and wrong about the scale.
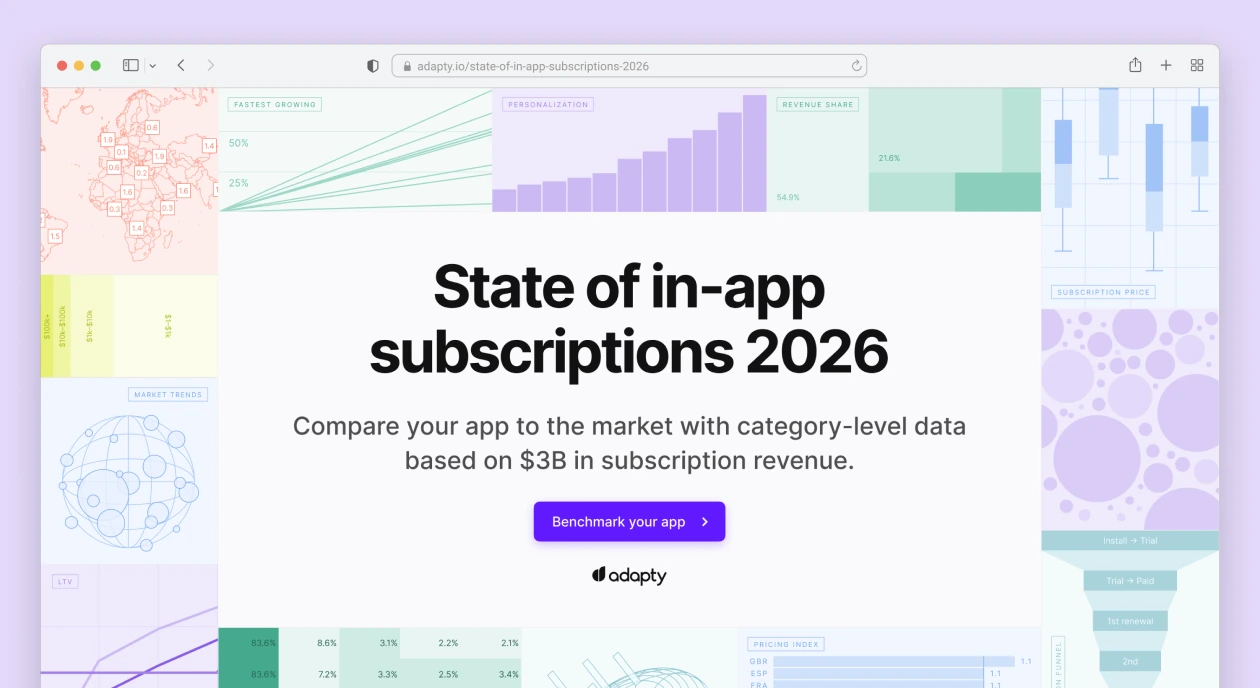
The State of in-app subscriptions 2026 is the most comprehensive dataset we've published — covering 16K apps, 500M transaction events, 3B revenue analyzed across every major category and region. And some of what's in it genuinely surprised me. Not in a "huh, interesting" way. In a "we need to rethink how we talk about this" way.
This is my attempt to walk you through the findings that I think actually matter. Just the ones that should change how you're making decisions right now.
Why is weekly dominating faster than anyone predicted?
Two years ago, weekly subscriptions generated 43.3% of all app revenue. By 2025, that number is 55.5%. That's a 12 percentage point shift in 24 months.
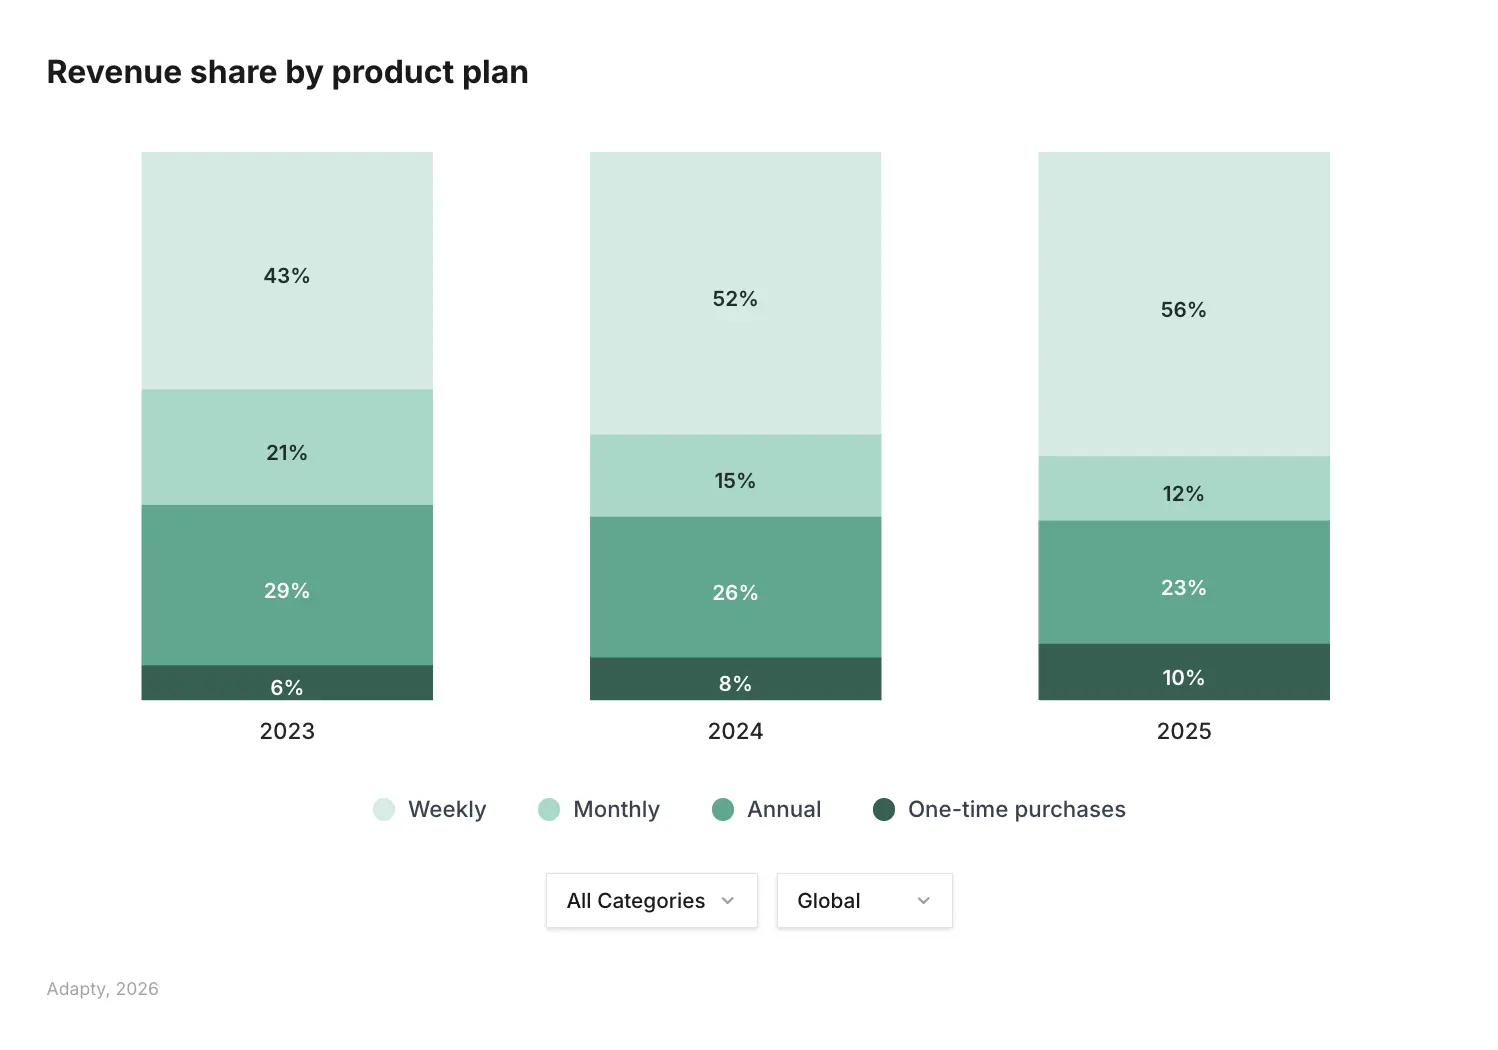
To put that in context: monthly plans lost nearly half their revenue share in the same period (21.1% → 11.7%). Annual dropped too (29.2% → 22.5%). Weekly didn't just grow — it cannibalized both simultaneously.
Here's what's driving it. Weekly plans start trials at up to 5.4x the rate of annual plans. At upper-mid pricing, the install-to-trial conversion is 9.8% for weekly versus 1.8% for annual. Monthly, by comparison, sits at 0.3%. Monthly is essentially a dead zone at the top of the funnel — too expensive to feel low-risk, too short to feel like a commitment.
The LTV story is even more interesting. A weekly+trial cohort starts at $7.40 on Day 0 and reaches $54.50 at Day 380 — a 636% growth rate. Annual+trial goes from $42.08 to $49.92 — an 18.6% increase. The paywall that looks worst on your Day 0 dashboard is the one delivering the best 12-month results.
The practical implication: if weekly is not your default plan, or at minimum a prominent option, you're swimming against a current that's only getting stronger. And if you're still evaluating weekly plan performance at Day 30, you're looking at the wrong window.
What does "trials always work" actually mean?
The standard advice is: add a free trial, get better subscribers. The global average backs this up. But the global average is doing a lot of work, hiding a real split.
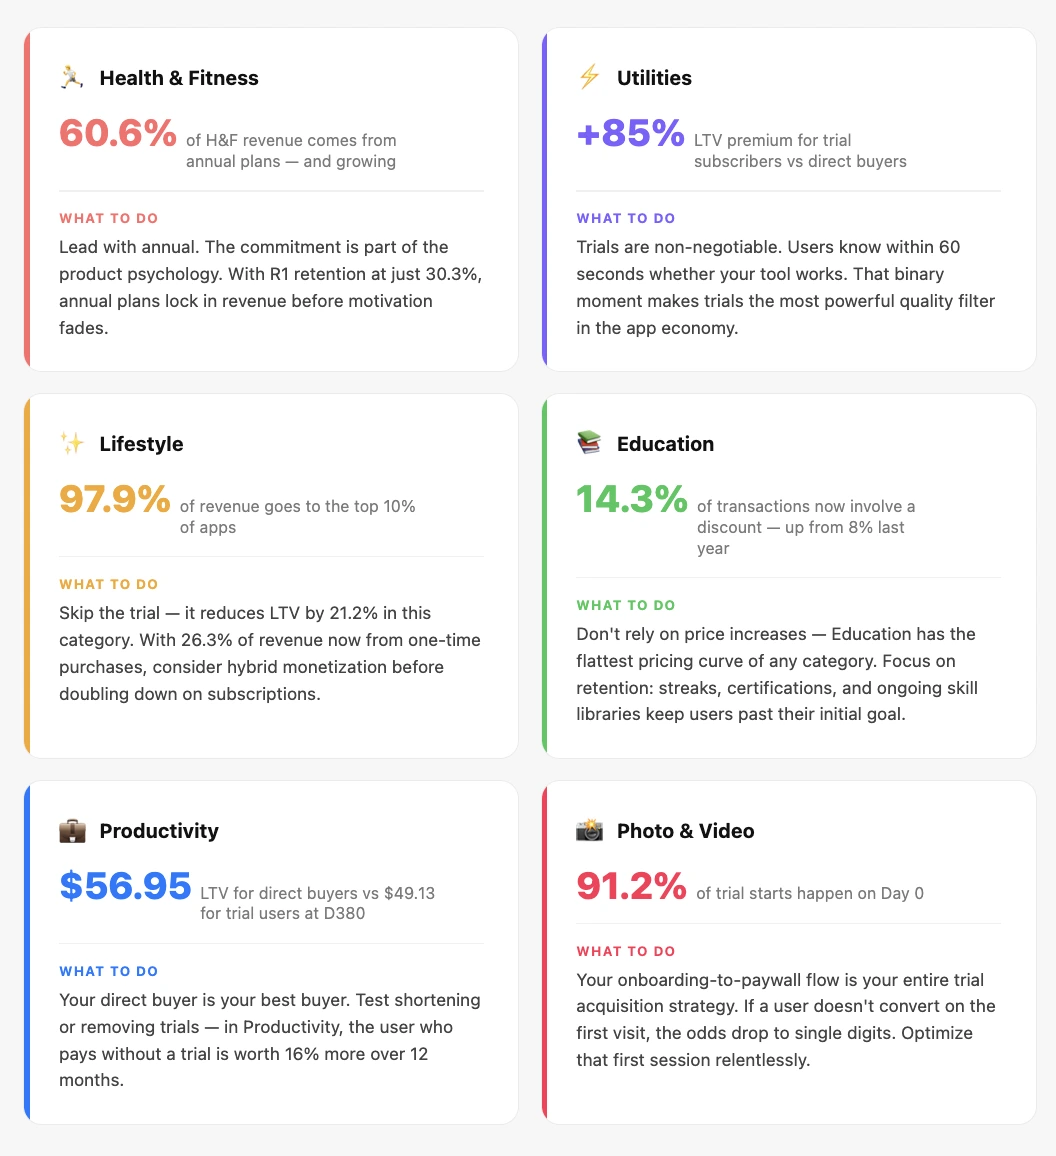
In Utilities, the trial LTV premium over direct buyers is +85.1%. In Health & Fitness, it's +63.6%. In Education, +50.4%. In these categories, trial users self-select based on genuine intent — they experience the product, confirm it solves a real problem, and then pay. They're fundamentally different from someone who converts on impulse at a paywall.
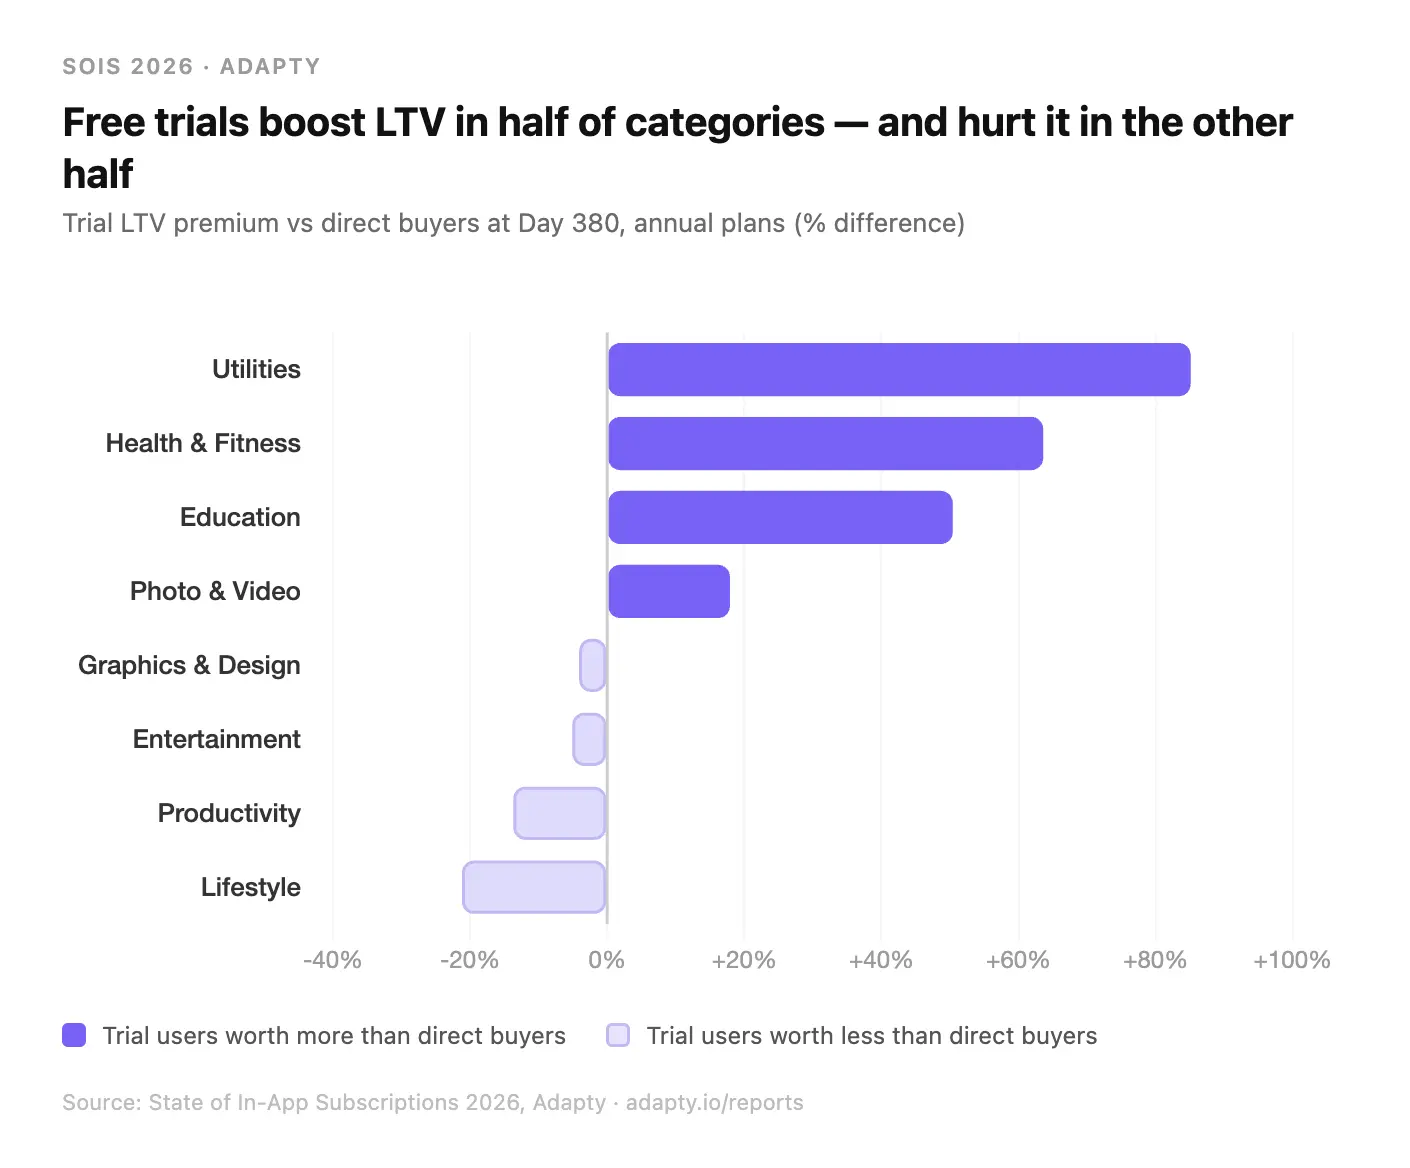
But in Productivity, Lifestyle, Entertainment, and Graphics & Design, trial users are worth less than direct buyers. In Lifestyle, the trial premium is -21.2%. In Productivity, -13.7%.
This is the nuance that most guides skip. Trials act as a quality filter. If the value of your app is self-driven (journaling, productivity systems, lifestyle habits), trial users are more likely to be experimenters who never truly commit. In those categories, your direct buyer is your best buyer.
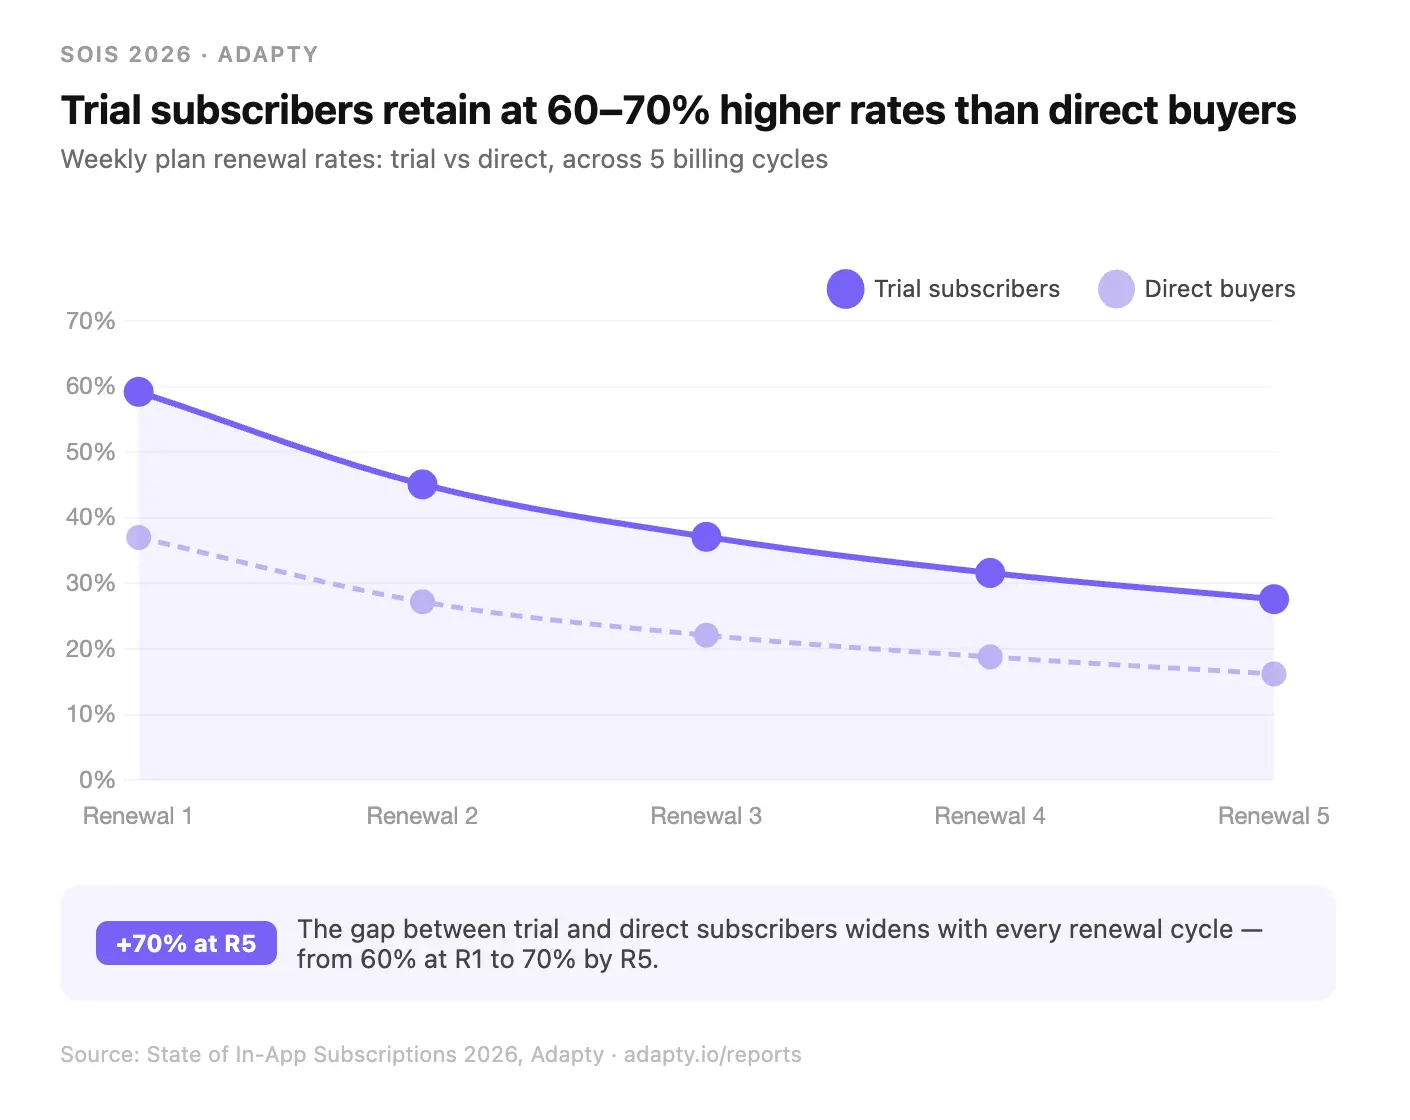
The retention data makes this even clearer. On weekly plans, trial users renew at 59.2% after the first billing cycle versus 37.0% for direct buyers — a 60% premium that widens to 70% by the fifth renewal. That's not marginal. But in Lifestyle, where trials actively reduce LTV, the same trial mechanics work against you.
The practical implication: before you copy a competitor's trial strategy, figure out which category dynamic you're operating in. Run cohort analysis on your own data. The difference between +85% and -21% trial premium is the difference between your best growth lever and your biggest revenue leak.
Is your paywall timing costing you more than your pricing?
89.4% of all trial starts happen on Day 0 — the same session the user installs your app.
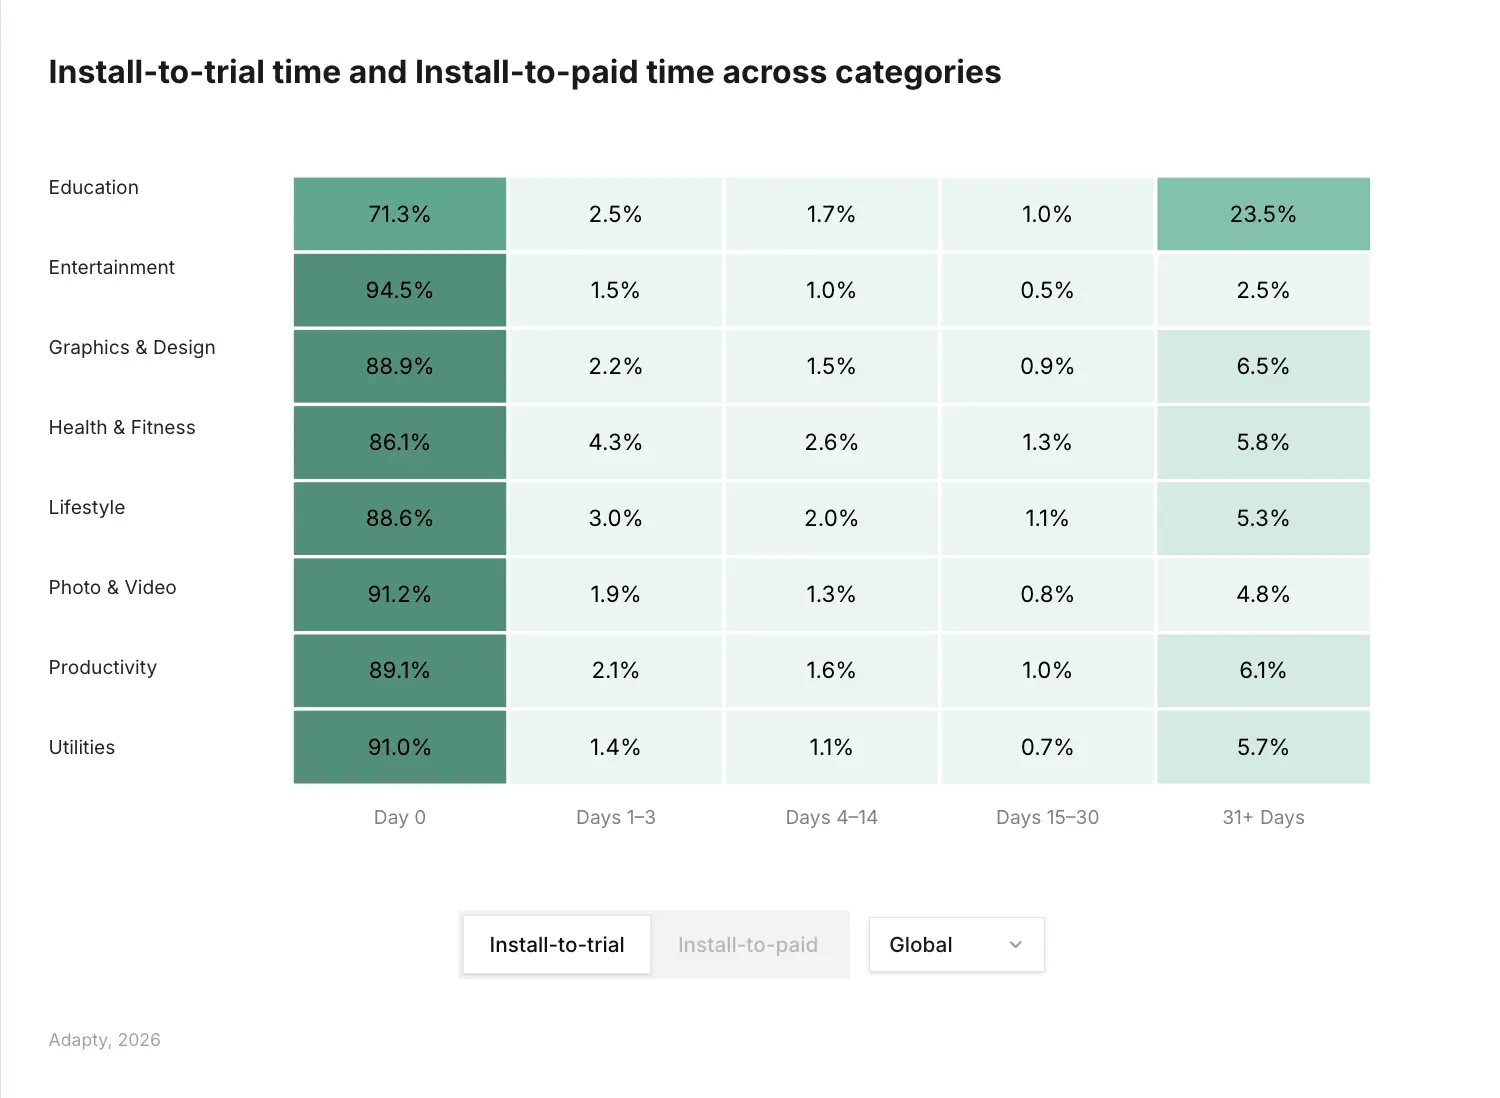
Read that again. Nine out of ten users who will ever start a trial do it on the first visit. If they don't convert, then the probability drops to single digits and keeps falling. Days 1-3 account for 2.0% of trial starts. Days 4-14, less than 1.4%. Days 15-30, less than 1%.
There's a small but meaningful cohort at Day 31+ (6.3% globally) — users who churned from the free tier and came back. Worth a well-timed win-back campaign. But it's not where your revenue is.
The category-level data makes this more specific. Entertainment is the most Day 0-dependent at 94.5%. Photo & Video at 91.2%. Utilities at 91.0%. If you're in any of these categories, your onboarding-to-paywall flow is essentially your entire trial acquisition strategy. There's no second chance.
Education is the major outlier. Only 71.3% of Education trial starts happen on Day 0, with 23.5% happening 31+ days after install — the highest late-start rate of any category by a significant margin. Education users browse, evaluate, and return. That's a fundamentally different purchase psychology, and it demands a fundamentally different re-engagement strategy.
The practical implication: most teams spend disproportionate resources on push notification sequences and email re-engagement. For most categories, those are optimization rounding errors compared to the first-session paywall. The highest-leverage work in subscription monetization is almost always what happens in the first two minutes.
Why are apps that experiment earning 40x more?
Apps that run experiments earn nearly 40x more revenue than apps that don't. But the distribution matters.
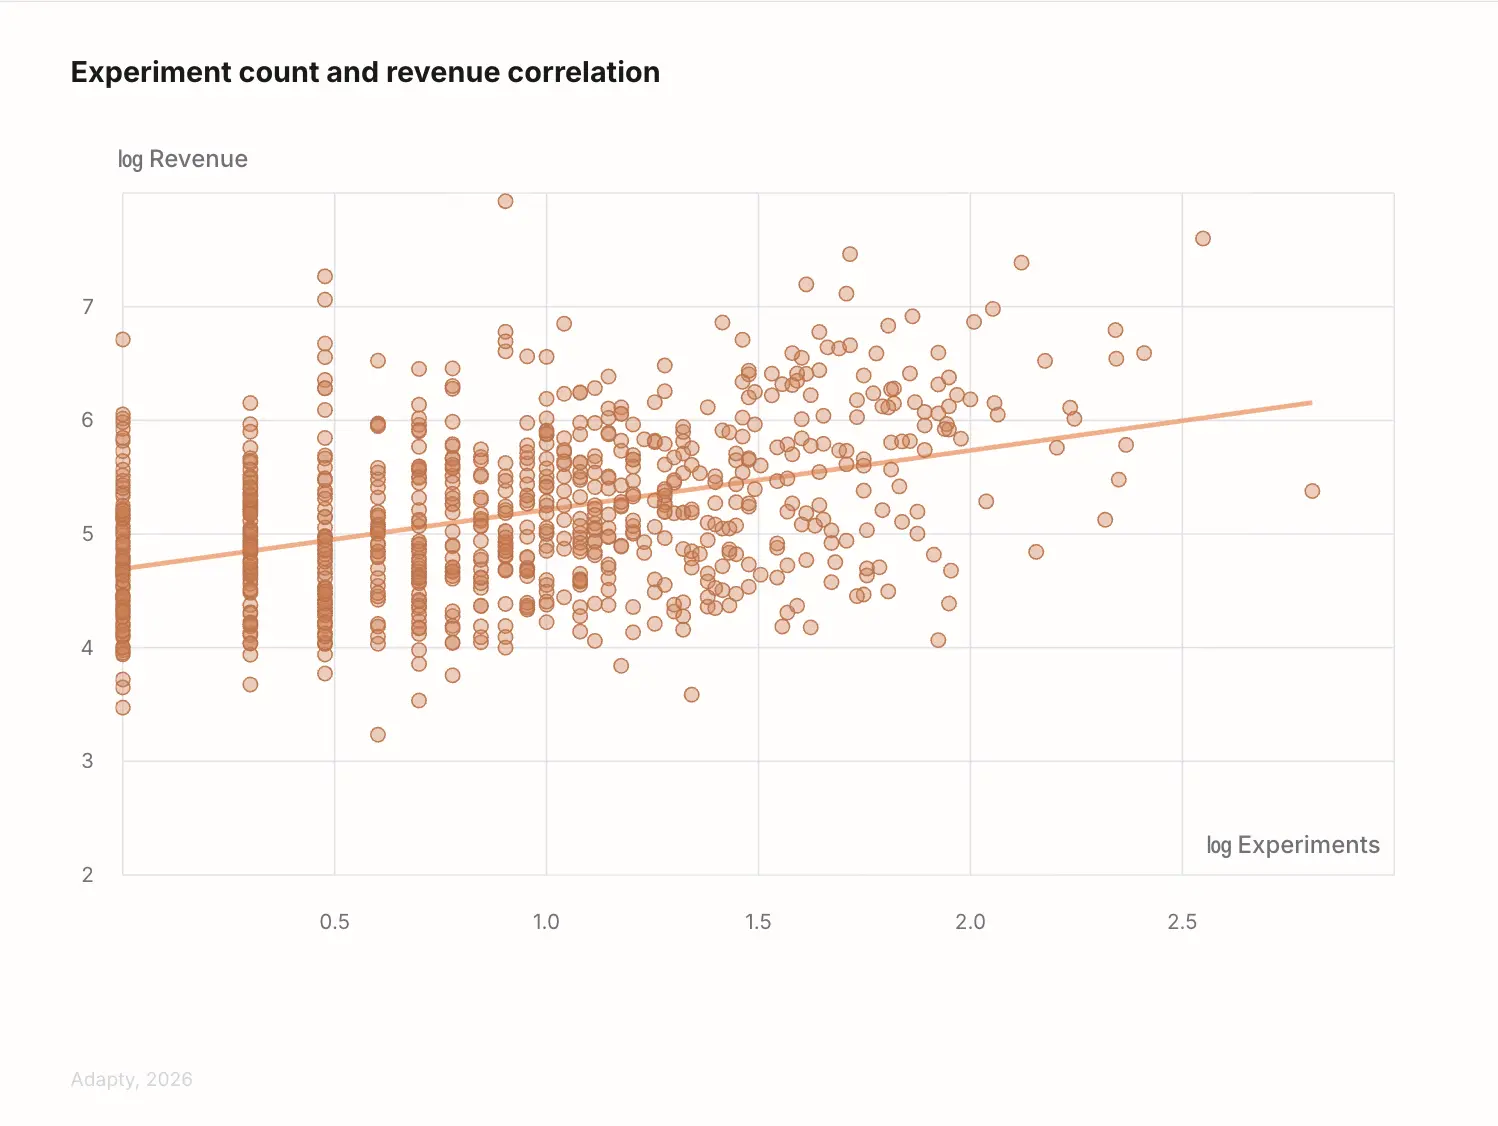
One experiment puts you in a meaningfully higher revenue tier than zero experiments — the jump is significant. Then the curve keeps climbing. Apps running 50+ experiments have a median revenue of $914,734 versus $48,848 for one-experiment apps. That's an 18.7x premium on top of an already elevated baseline.
One experiment gives you a data point. Fourteen gives you a monetization strategy. The average among apps that test regularly is 14.7 experiments per year.
What's worth testing? The data is specific about this. Locale tests (translation and currency) deliver the highest LTV uplift at 62.3%. Adding or changing a trial structure comes in at 59.6%. Plan duration changes at 58.7%. Plan count changes at 57.1%. Visual and text changes at 34.6%. Price changes — the thing most teams test first — deliver the lowest LTV uplift at 45.5% and the lowest conversion rate uplift at 28.3%.
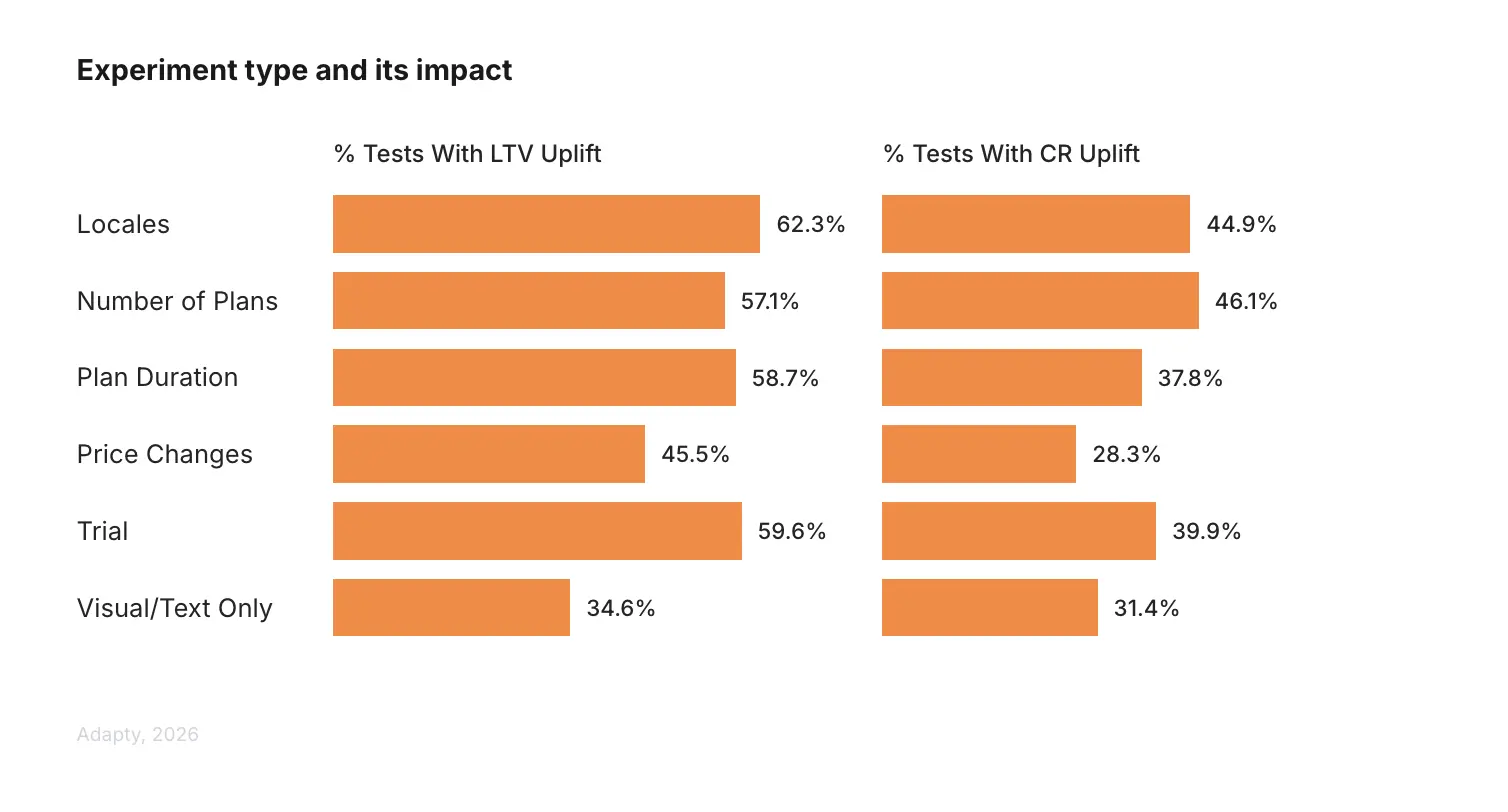
Here's what that means in practice: if your A/B testing roadmap is mostly price tests, you're testing the weakest lever. Translating your paywall into your top 5 revenue market languages delivers 37% more LTV uplift than changing a price. A 2-plan versus 3-plan architecture test drives 63% more conversion rate uplift than a price change.
The practical implication: stop starting with price. Start with structure — plans, trials, duration — then localization, then copy and visuals. Price comes last, not first.
What does the revenue distribution actually look like?
This one is uncomfortable, and I think it's important to say plainly.
57.7% of new subscription apps generate less than $1,000 in total revenue. Another 22.4% earn between $1,000 and $10,000. Combined, 8 in 10 new subscription apps never cross $10,000. Only 7.9% break the $100,000 threshold.
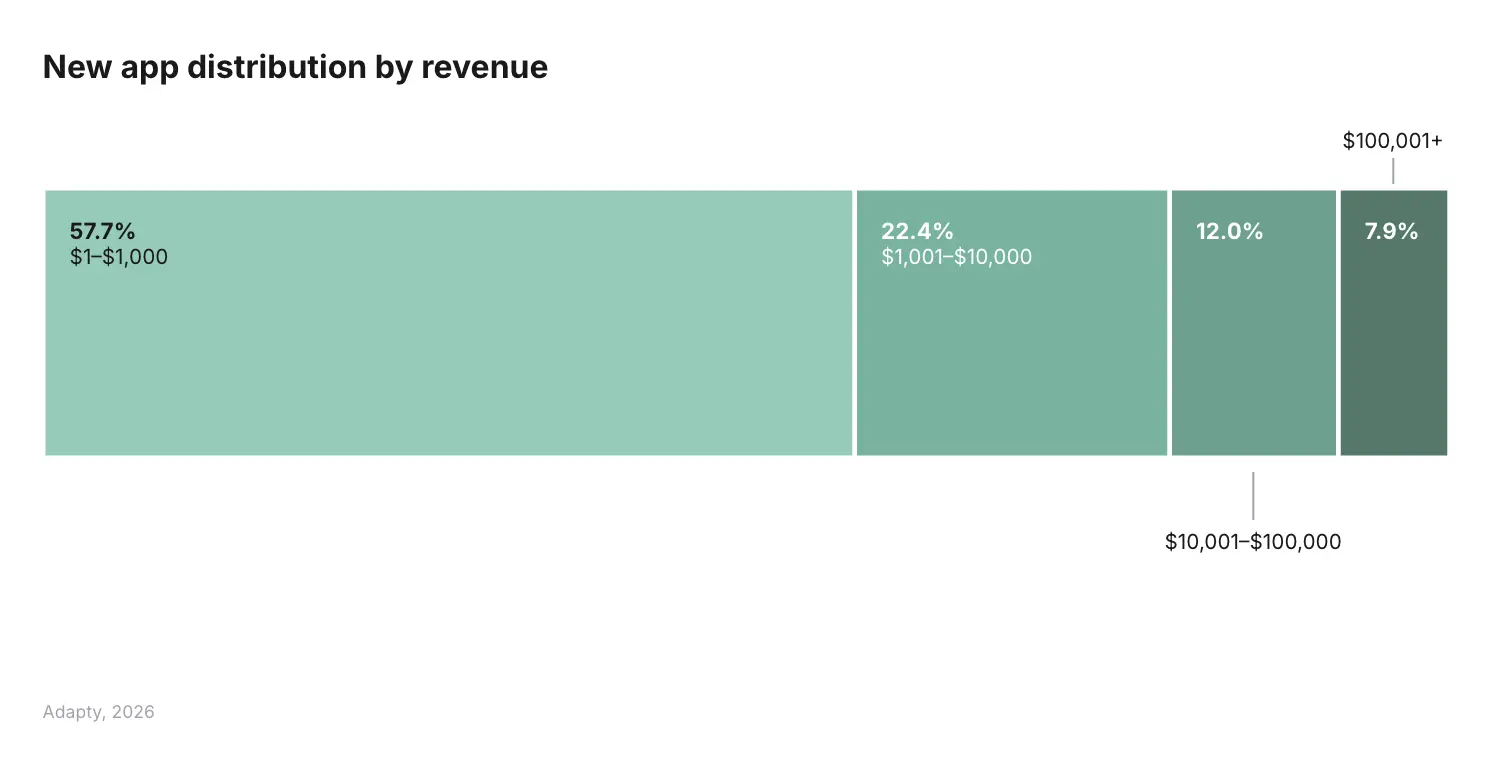
At the same time, 31% more new apps were launched in 2025 than in 2024. True median monthly revenue dropped 22% year-over-year, from $627 to $492. More apps, less revenue per app. The top 10% of apps capture 94.5% of all subscription revenue — up from 92.7% in 2023.
This is the honest framing for everything else in this report: the monetization tactics covered here — trial optimization, pricing tests, paywall experiments — start to matter meaningfully above $100,000 in revenue. Below that threshold, you're often not looking at a pricing problem or a conversion problem. You're looking at a product-market fit problem. No amount of paywall optimization rescues an app that users don't find valuable enough to pay for.
The $1,000-$10,000 bracket is the most dangerous zone. You've proven demand — someone is willing to pay. But you haven't reached the scale where sophisticated monetization mechanics actually compound. Apps that break out of this bracket typically do it through pricing optimization and retention work, not new feature development. If you're in this range, the call is: stop building, start optimizing. Give yourself a 90-day window.
The practical implication: know your decile. If you're not tracking where you rank in revenue within your category, the tactical advice everywhere — including in this report — is noise. The strategies that work at the 95th percentile don't apply at the 40th.
Why do iOS and Android need completely different strategies?
Android has 70% of global mobile users. It captures 15.25% of global subscription revenue.
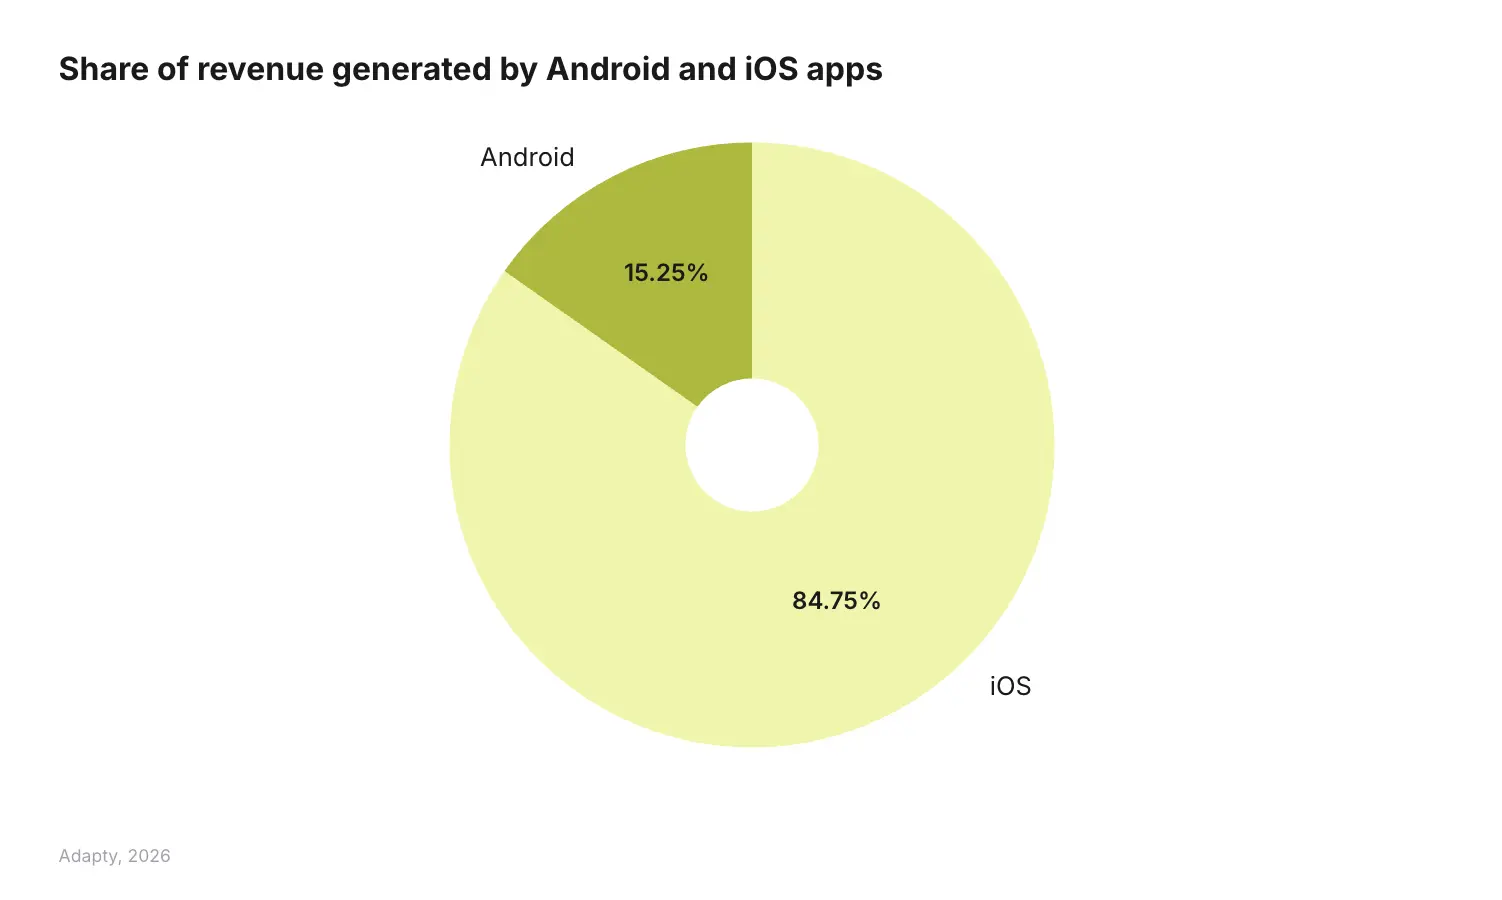
iOS has the rest.
That's not a small gap — it's a 5.5x revenue differential per subscriber. And it has direct implications for how you should be allocating your optimization effort. Every 1% conversion lift on iOS is worth approximately 5.5x the same lift on Android in absolute revenue terms.
What this does not mean is that Android is irrelevant. It means Android needs a different strategy, not an iOS strategy copied and pasted onto a different platform. Android users have different price sensitivity, different payment method preferences, and different conversion psychology. The paywalls, price points, and trial structures that perform on iOS often underperform significantly on Android — and vice versa.
The most common mistake I see: teams build their iOS paywall, then mirror it on Android because it's faster. That approach is actively suppressing Android revenue. If your Android revenue share is above 15%, you're already outperforming the market average — understand what's driving that and double down. If it's below, audit your Android funnel specifically for friction points rather than assuming it's a lost cause.
The practical implication: treat iOS and Android as separate monetization businesses that happen to share a codebase. Different price tiers, different trial lengths, different paywall positioning. The revenue data justifies the extra work.
What should you do differently based on your category?
The most important thing the category-level data shows is that generic advice actively hurts you in specific contexts. A few examples:
Health & Fitness is the only category where annual plans dominate — 60.6% of revenue in 2025, up from 51% in 2023 — while the rest of the app economy shifts to weekly. This isn't a coincidence. Fitness is aspirational. The annual commitment is part of the product psychology. "I'm investing in my health for the year" is a different purchase than "I'll try this for a week." H&F also has the highest trial-to-paid conversion of any category (35%) and the lowest R1 retention (30.3%). Users commit fast and churn fast. Annual plans lock in revenue before motivation fades.
Lifestyle is the hardest category to build a subscription business in. The top 10% of Lifestyle apps capture 97.9% of all Lifestyle subscription revenue. That leaves 2.1% for the remaining 90%. On top of that, trials in Lifestyle apps actually reduce LTV by 21.2% — the only category where this happens. And 26.3% of Lifestyle revenue now comes from one-time purchases, up from 5.9% in 2023. Users in this category are signaling they want to buy specific things, not subscribe to ongoing access. If you're in Lifestyle, the subscription model may be working against your actual user behavior.
Utilities is the opposite extreme. Trial subscribers in Utilities generate 85.1% more LTV than direct buyers — the highest trial premium of any category. R1 retention for trial users is 58.1%, and by the fifth renewal, more than 1 in 4 trial subscribers are still paying. Utilities apps solve immediate, binary problems. Users know within minutes whether the tool works, which makes trials an almost perfect quality filter.
Education is discounting more aggressively than any other category — 14.3% of all Education transactions now involve a discount, up from 8.0% a year ago. The fastest acceleration in the dataset. This is happening because Education has the flattest pricing curve of any category: charging more doesn't move LTV meaningfully, so when growth slows, discounting becomes the default lever. The risk is training users to expect discounts, which erodes full-price conversion over time.
The practical implication: your category determines which levers work. If you're benchmarking your monetization against apps in a different vertical, you're likely optimizing in the wrong direction entirely.
Which markets are you ignoring?
Most app monetization roadmaps are built around the US market, with everyone else treated as a secondary consideration. The data suggests this is a significant missed opportunity in specific markets.
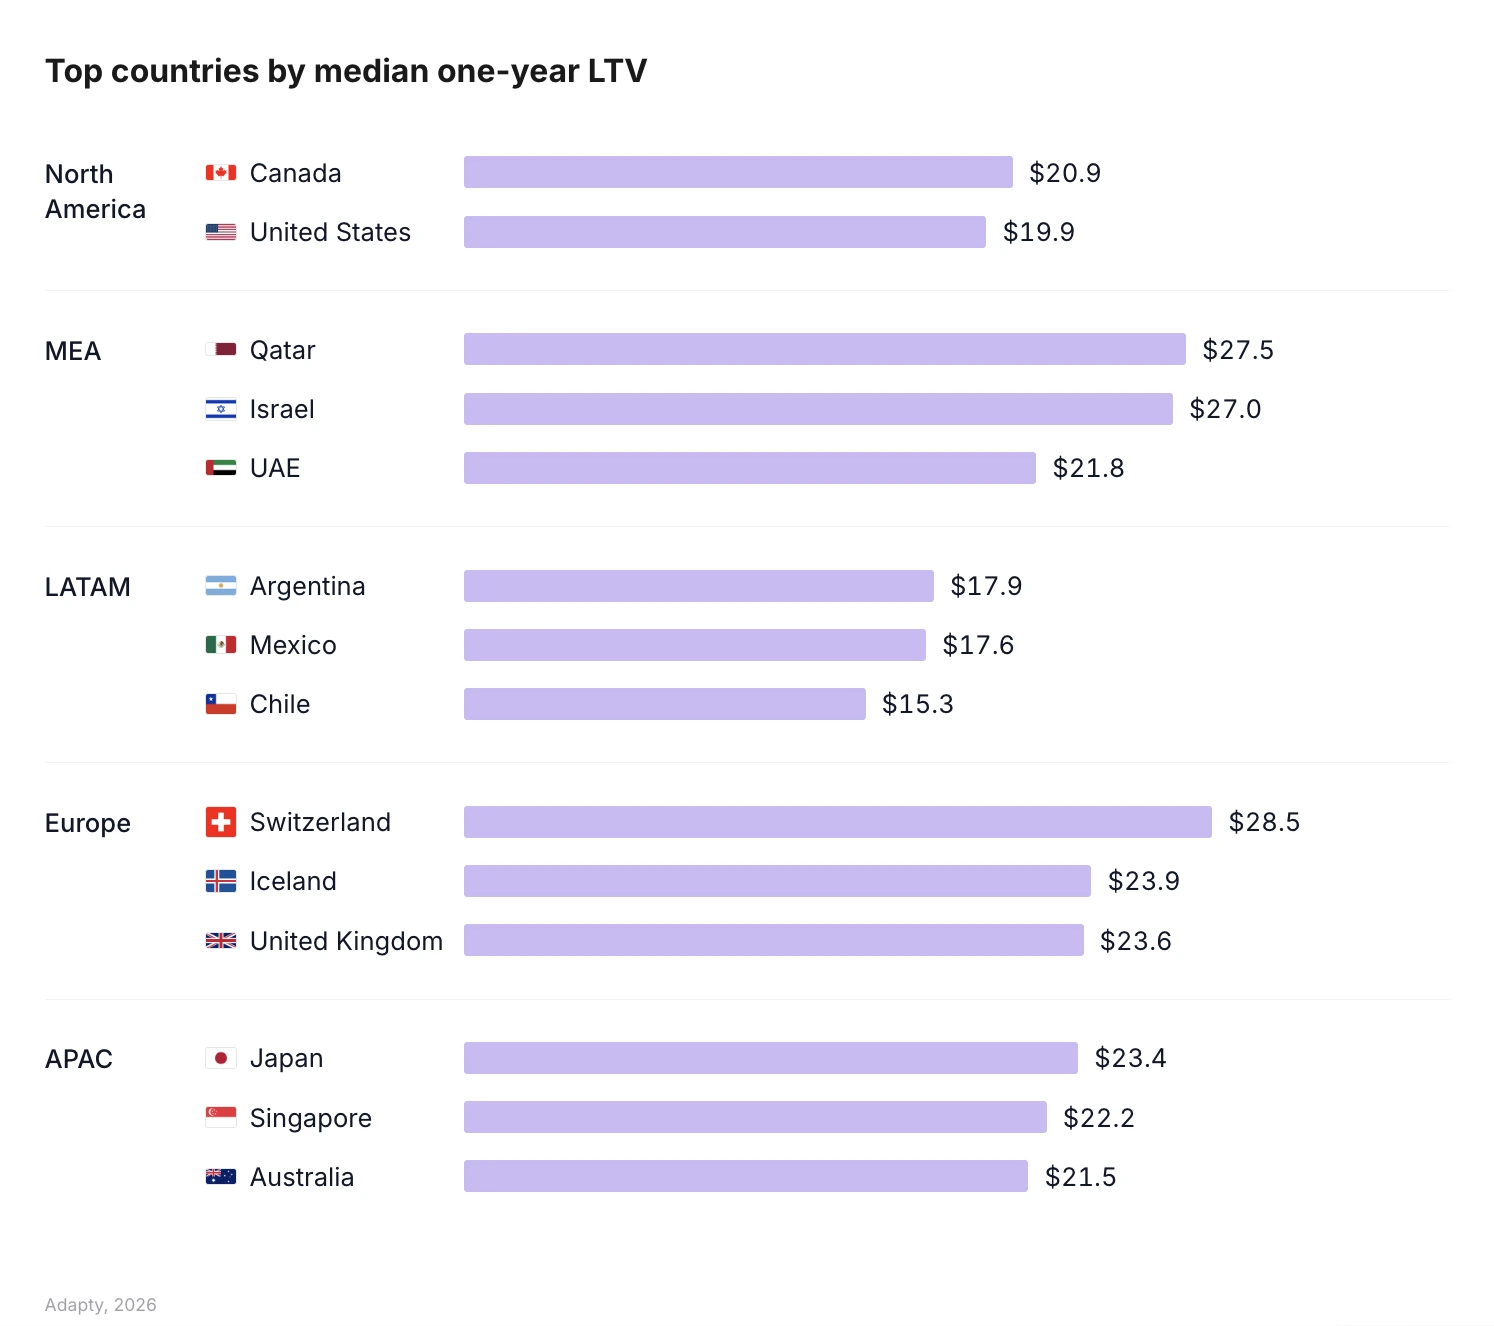
Switzerland, Qatar, and Israel lead the global LTV table — yet none of them sit at the center of most monetization roadmaps. Switzerland has the most evenly distributed premium LTV in the dataset, meaning its high values reflect typical users, not just outliers. Israel has the highest average LTV in the entire dataset with a solid sample size, making it both a revenue opportunity and a statistically reliable test market.
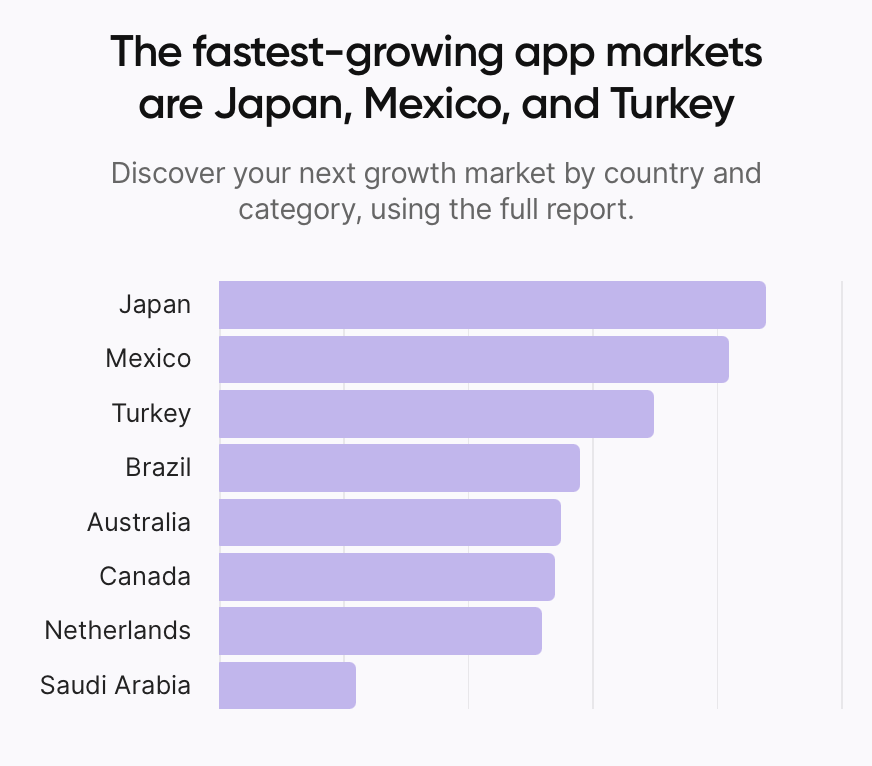
Japan, Mexico, and Turkey are the three fastest-growing App Store markets by subscription revenue. They're also among the markets most teams are ignoring in favor of squeezing another 2% out of US paywall optimization.
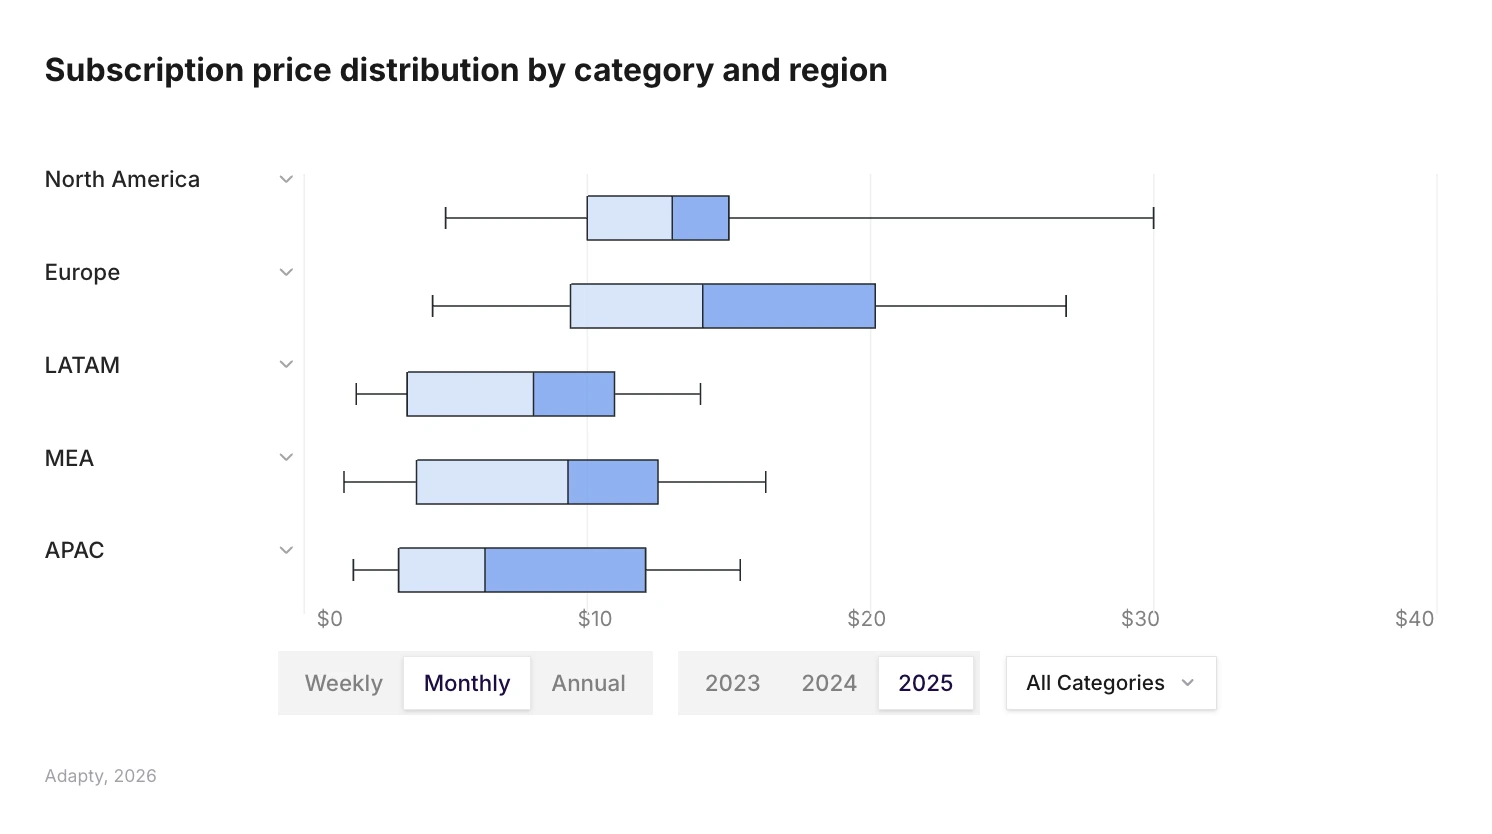
And then there's the pricing gap between Europe and North America that has quietly opened up. European apps now charge 29-39% more than North American apps across every billing period. In 2023, the monthly gap was 6%. By 2025, it's 39% ($15.25 vs $10.95). European subscribers are accepting higher prices and staying longer — Europe has the best D380 annual retention of any region (21.3% vs NA's 20.0%).
If you're using global pricing — one price for everyone — you're almost certainly undercharging in Switzerland, Qatar, Israel, and most of Europe, and potentially overcharging in markets like LATAM where local purchasing power is lower.
The practical implication: locale tests are the highest-LTV experiment type in the dataset (62.3% LTV uplift). Before your next price test, localize your top five markets. The revenue upside is larger than almost any other single experiment.
The bottom line
Every year, the SOIS data pushes back on assumptions that feel settled. This year, the biggest ones are:
- The paywall that looks worst on Day 0 often delivers the best 12-month LTV. Weekly+trial is the proof point.
- Trials don't work the same way in every category. In half of app verticals, direct buyers are worth more than trial users. Know which camp you're in before building your acquisition strategy around trial volume.
- 90% of your trial acquisition happens in the first session. Everything else is a rounding error by comparison.
- Translating your paywall beats repricing it. Structure beats copy. Both beat price changes.
- And the hardest truth: below $100K in revenue, most subscription challenges are product-market fit challenges. The tactics in this report compound when you have something users genuinely want. They don't rescue products that don't.
The full state of in-app subscriptions 2026 report has a lot of insights structured across global patterns, category-specific breakdowns, and regional data — including the complete data tables behind everything covered here.