The mobile app landscape is evolving rapidly. With over 299 billion app downloads projected for 2025 and users spending nearly 5 hours daily on their devices, the competition for user attention has never been fiercer. But here’s the reality check: downloads don’t equal success. The average smartphone user has 80 apps installed but actively uses only 9 per day and 30 per month.
What separates thriving apps from forgotten ones? The answer lies in understanding and optimizing engagement metrics. According to recent data, 88% of mobile time is spent in apps rather than browsers, presenting both an opportunity and a challenge. For subscription-based apps, this becomes even more critical – engaged users are exponentially more likely to convert and retain.
What is app engagement?
App engagement measures how users interact with your application – not just whether they’ve downloaded it, but how frequently they return, how long they stay, and what actions they take. It’s the difference between an app sitting dormant on someone’s home screen and one that becomes an essential part of their daily routine.
True engagement goes beyond vanity metrics. It reflects the value users find in your app and their willingness to invest time and, ultimately, money into it. For subscription apps, engagement directly correlates with conversion rates and lifetime value.
Why is app engagement important?
First, the economics: engaged users generate revenue. Apps with higher engagement see retention rates that can reach 35% after one year in top-performing categories, compared to industry averages hovering around 5-7% for day-30 retention.
But engagement metrics also serve as an early warning system. Declining session frequency or duration signals problems before they become churn. These metrics help you identify friction points, validate new features, and understand which aspects of your app deliver real value.
Perhaps most importantly, engagement data enables you to build the right product. Rather than guessing what users want, you can observe actual behavior patterns and make data-driven decisions about where to invest development resources.
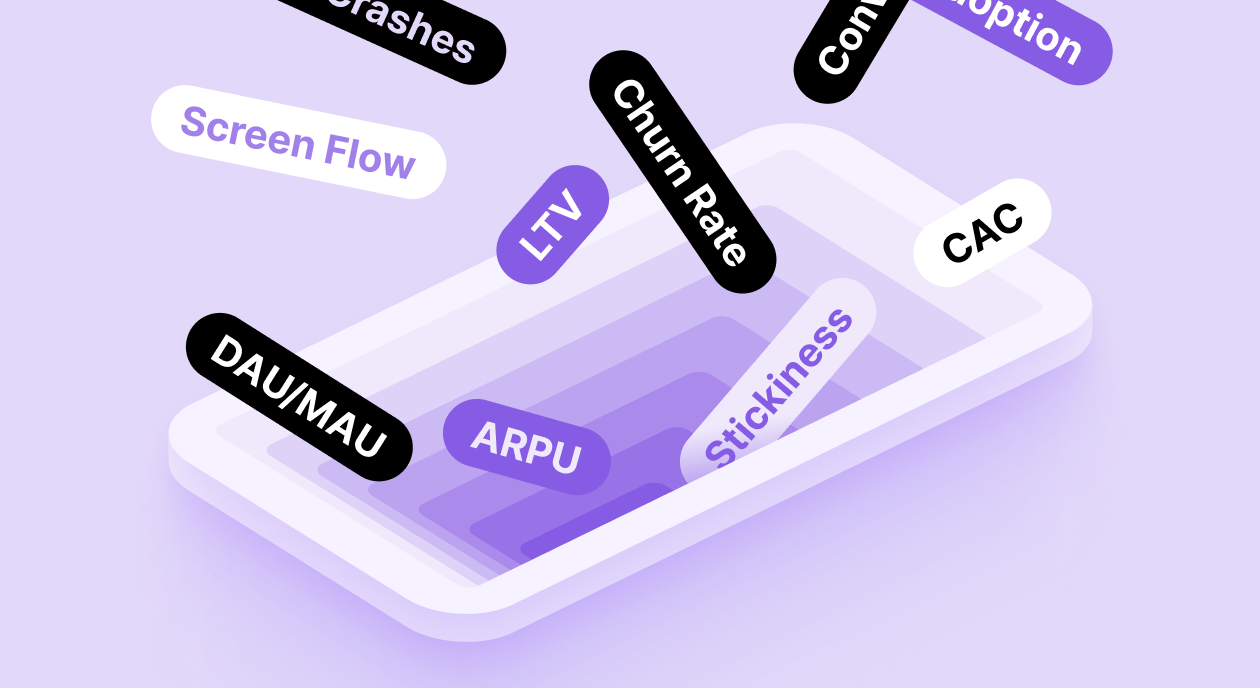
12 core app engagement metrics in 2026
| Metric | Description |
| Active users (DAU/MAU) | Number of unique users engaging with your app daily or monthly |
| Average session duration | Time users spend in your app per session |
| Conversion rate | Percentage of users completing desired actions (e.g., subscribing) |
| Customer retention rate | Percentage of users who continue using your app over time |
| Churn rate | Percentage of users who stop using your app within a given period |
| Lifetime value (LTV) | Total revenue expected from a user throughout their lifecycle |
| Average revenue per user (ARPU) | Revenue generated per user, typically measured monthly or annually |
| Customer acquisition cost (CAC) | Cost to acquire a new user through marketing efforts |
| Stickiness ratio | DAU/MAU ratio indicating how frequently users return |
| Feature adoption rate | Percentage of users engaging with specific features |
| Screen flow | User navigation patterns and paths through your app |
| App crashes | Frequency of technical failures disrupting user experience |
1. Active users – DAU and MAU
Daily Active Users (DAU) and Monthly Active Users (MAU) form the foundation of engagement measurement. These metrics tell you how many unique users open your app within a specific timeframe.
Why it’s important: DAU and MAU provide visibility into your app’s health and growth trajectory. A rising MAU with stable DAU suggests successful acquisition, while declining numbers signal retention issues requiring immediate attention.
How to optimize: Define what constitutes an “active” user for your app – merely opening it, or completing a meaningful action? Then focus on triggers that bring users back. Implement personalized push notifications based on user behavior, create content that updates regularly, and build features that solve daily problems rather than occasional needs. Apps that successfully boost DAU often employ habit-forming features and timely reminders, like fitness apps prompting morning workouts or language learning apps with streak systems.
2. Average session duration
Session duration measures how long users spend in your app from opening to closing. Entertainment apps average 7 minutes per session, but optimal duration varies significantly by app category.
Why it’s important: Longer sessions generally indicate higher engagement, though context matters. A meditation app might aim for 10-15 minute sessions, while a payment app should optimize for quick transactions. This metric reveals whether users find your app compelling enough to explore or if they’re quickly abandoning after opening it.
How to optimize: Analyze where users spend time within your app. Are they exploring features or stuck on confusing interfaces? Implement progressive onboarding that reveals features gradually, reducing initial overwhelm. Create clear paths to high-value actions and remove friction from critical flows. Consider adding engaging content loops, like social feeds or personalized recommendations, that naturally extend session time without feeling forced.
3. Conversion rate
Your conversion rate tracks the percentage of users who complete desired actions, whether that’s subscribing, making a purchase, or finishing a trial period.
Why it’s important: This metric directly impacts revenue. For subscription apps, conversion rate determines how effectively you’re transforming free users into paying customers. Even small improvements, moving from 2% to 3% conversion, can dramatically impact your bottom line.
How to optimize: Reduce friction in your conversion funnel. Map every step from first touch to subscription and identify drop-off points. Implement strategic paywall placement that demonstrates value before asking for payment. Offer appropriate trial lengths that match your app’s value delivery timeline – users need enough time to experience benefits before deciding to pay. Use social proof, clear value propositions, and flexible pricing tiers to appeal to different user segments.
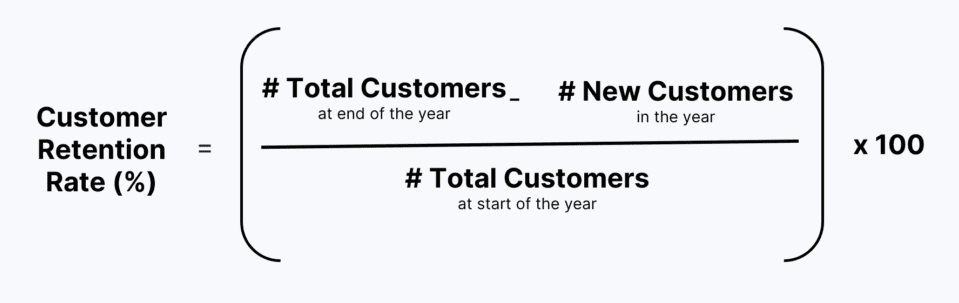
4. Customer retention rate
Retention rate measures the percentage of users who continue engaging with your app over specific periods – commonly measured at days 1, 7, and 30 post-install.
Why it’s important: Retention is the ultimate engagement metric. Industry data shows that average day-30 retention hovers around 6%, but top-performing apps can achieve rates of 25-40%. High retention indicates product-market fit and predicts long-term success better than download numbers ever could.
How to optimize: Create an onboarding experience that quickly demonstrates value. Users who experience your app’s core benefit within the first session are significantly more likely to return. Build habit loops into your product design – daily rewards, progress tracking, or social accountability features. Engage users throughout their journey with personalized communication, highlighting features they haven’t tried and celebrating milestones they’ve reached.
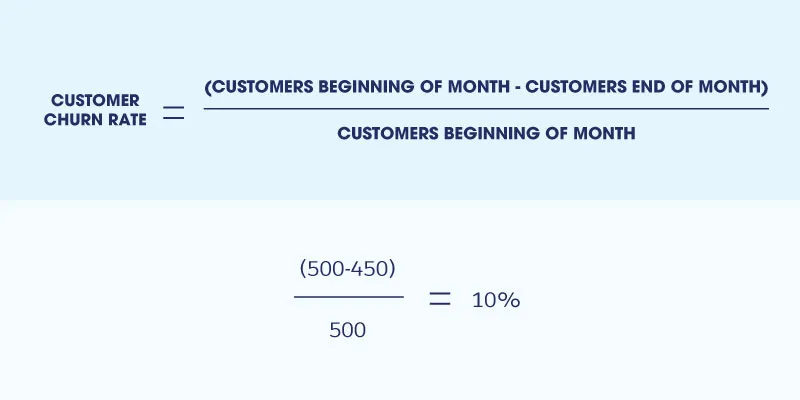
5. Churn rate
Churn rate is the flip side of retention – it measures how many users stop engaging with your app within a given timeframe.
Why it’s important: Understanding churn helps you identify problems before they’re irreversible. Users who churn represent lost revenue and wasted acquisition costs. More importantly, high churn rates signal fundamental product issues requiring immediate attention.
How to optimize: Implement early warning systems that flag at-risk users based on declining engagement patterns. Reach out proactively with targeted interventions – special offers, helpful content, or feature highlights. Conduct exit surveys to understand why users leave. Address technical issues promptly, as app crashes and bugs are leading causes of churn. Consider win-back campaigns for churned users, offering incentives to return and try new features or improvements.
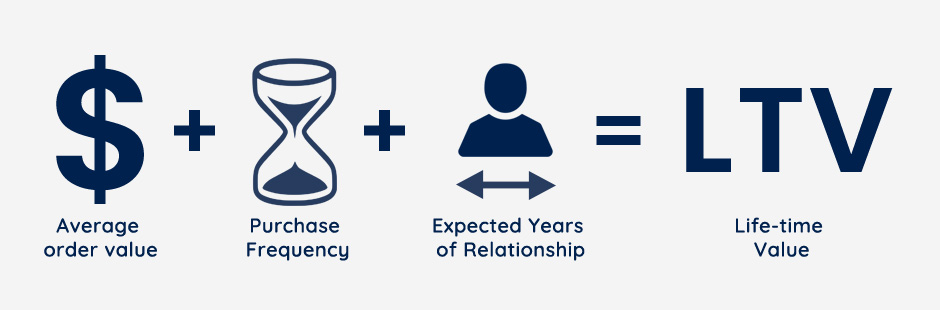
6. Lifetime value (LTV)
LTV calculates the total revenue you expect to generate from a user throughout their entire relationship with your app.
Why it’s important: LTV determines how much you can afford to spend on user acquisition while maintaining profitability. It’s also a powerful indicator of product stickiness and value delivery. Apps with high LTV have successfully created products that users can’t imagine living without.
How to optimize: Increase LTV through multiple levers. Improve retention to extend the customer lifecycle. Introduce upsells, add-ons, or premium tiers to increase average revenue per user. Develop features that become more valuable over time, creating switching costs that discourage churn. Subscription apps should focus on seamless renewal experiences and communicate ongoing value between billing cycles.
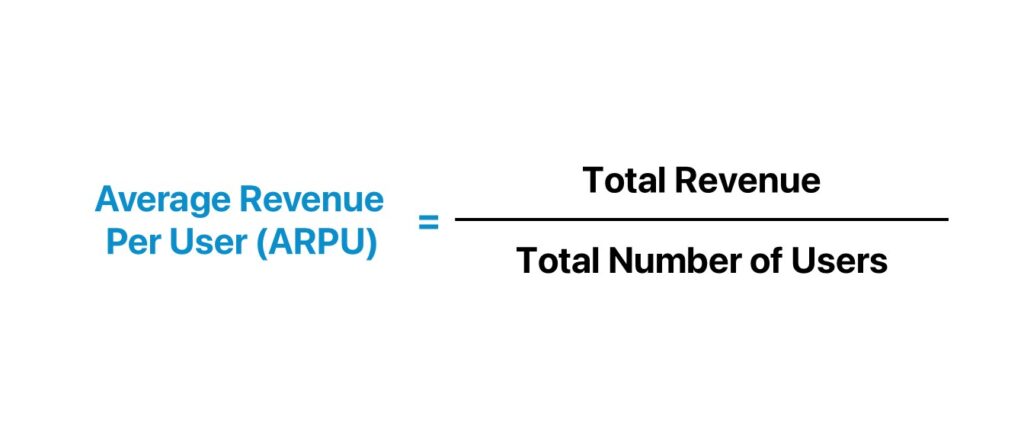
7. Average revenue per user (ARPU)
ARPU measures the revenue generated per user, typically calculated monthly or annually. It’s calculated by dividing total revenue by the number of active users.
Why it’s important: ARPU helps you understand the monetary value of your user base and compare performance across different user segments or time periods. Rising ARPU indicates successful monetization strategies, while declining ARPU may signal pricing issues or decreased engagement with revenue-generating features.
How to optimize: Experiment with pricing structures that capture value across different user segments. Implement tiered subscription plans catering to various needs and willingness to pay. For apps with in-app purchases, optimize your product catalog and pricing based on user behavior data. Use personalization to recommend relevant upgrades or purchases. Consider annual subscription options that improve upfront revenue while reducing churn.
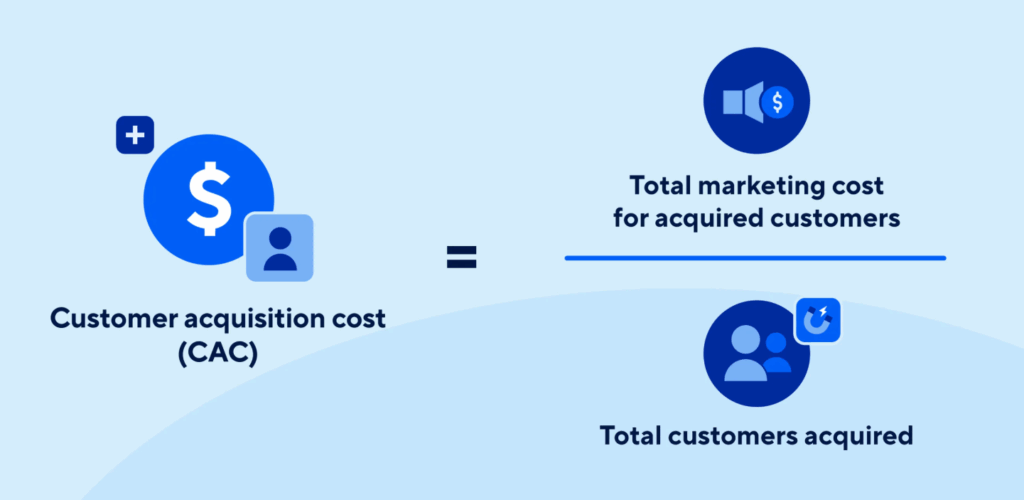
8. Customer acquisition cost (CAC)
CAC measures the total cost of acquiring a new user, including marketing spend, sales expenses, and related overhead.
Why it’s important: CAC must be significantly lower than LTV for sustainable growth. The ideal LTV:CAC ratio is 3:1 or higher. With user acquisition costs rising across channels, particularly in competitive categories like fintech and gaming, optimizing CAC has become critical for profitability.
How to optimize: Improve targeting to reach users more likely to convert and retain. Analyze which acquisition channels deliver the highest-quality users and double down on those sources. Optimize your app store presence through ASO to capture more organic installs. Implement referral programs that turn existing users into acquisition channels. Test different creative approaches and messaging to improve conversion rates from ads to installs.
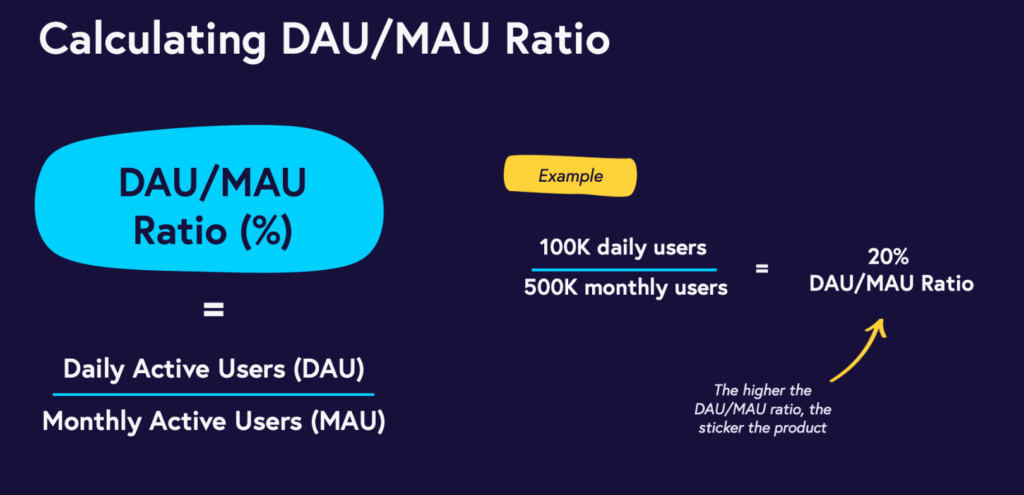
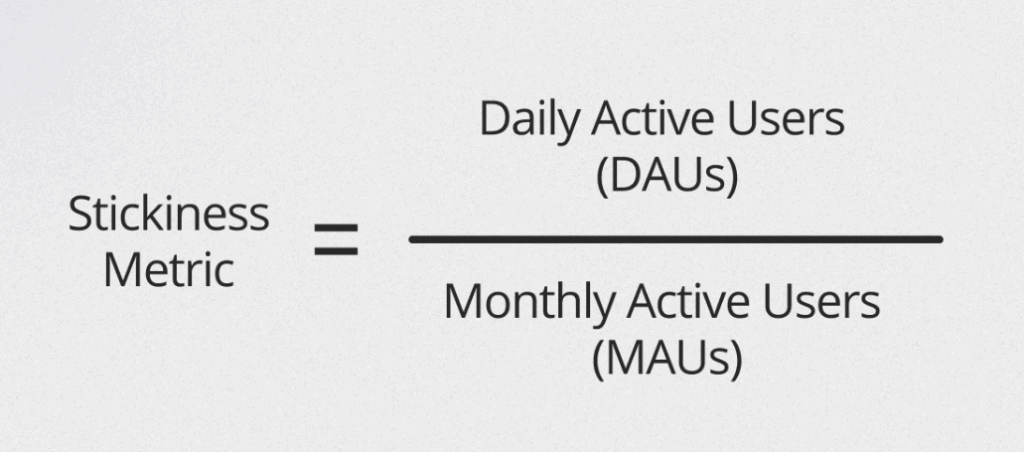
9. Stickiness ratio
Stickiness ratio, calculated as DAU/MAU, indicates how frequently monthly users engage with your app. A 20% stickiness ratio means that 1 in 5 monthly users opens your app daily.
Why it’s important: Stickiness reveals habit formation. Apps with high stickiness ratios have successfully become part of users’ daily routines. Social media apps often achieve stickiness ratios of 50-60%, while utility apps might target 20-30%. This metric helps you understand if users find ongoing value or only engage occasionally.
How to optimize: Design for daily utility. What problem can your app solve every day? Implement features that benefit from daily engagement – streaks, daily rewards, fresh content, or social interactions. Send timely notifications that create reasons to return. Consider adding widget functionality that keeps your app visible and accessible without requiring a full app open.
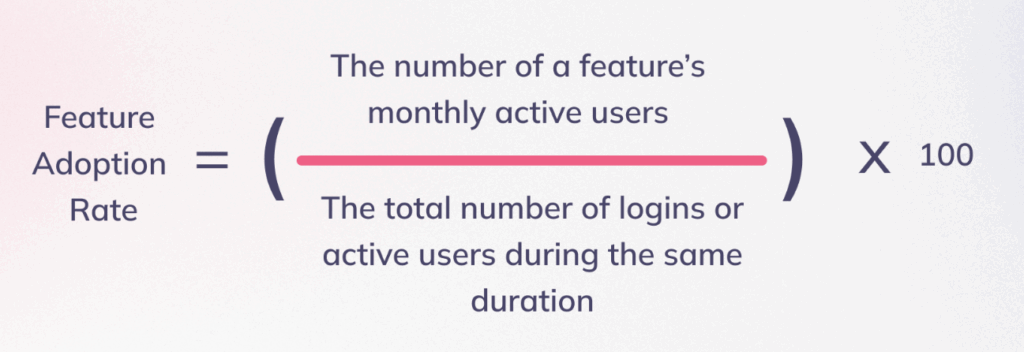
10. Feature adoption rate
Feature adoption rate tracks what percentage of users engage with specific features and how frequently they use them.
Why it’s important: This metric reveals which features deliver value and which fall flat. It guides product development priorities and helps identify features that might need better onboarding or positioning. Low adoption of key features can indicate UX issues or poor communication of feature benefits.
How to optimize: Implement progressive disclosure of features, introducing them when most relevant to the user’s journey. Use in-app messaging and tooltips to highlight new or underutilized features. Create contextual onboarding that demonstrates feature value through actual use rather than lengthy tutorials. Analyze the user journey to determine optimal timing for feature introduction. Remove or redesign features with persistently low adoption.
11. Screen flow
Screen flow analysis tracks how users navigate through your app – which screens they visit, in what order, and where they exit.
Why it’s important: Understanding screen flow reveals the actual paths users take versus the paths you designed. It exposes friction points where users get stuck or confused, opportunities to streamline journeys, and unexpected use patterns that might inform product development.
How to optimize: Use heatmaps and session recordings to visualize user behavior. Identify and eliminate dead ends where users frequently exit. Simplify complex flows by reducing steps to complete critical actions. Test different navigation structures to find what feels most intuitive. Ensure clear calls-to-action guide users toward high-value activities. For subscription apps, optimize the path to paywall and checkout, removing any unnecessary friction.
12. App crashes
App crashes measure how frequently your app fails or unexpectedly closes during use.
Why it’s important: Crashes destroy user trust and engagement. Users who experience crashes are significantly more likely to uninstall immediately or soon after. With 40% of users abandoning apps that crash, freeze, or produce errors, technical stability isn’t optional – it’s foundational to engagement.
How to optimize: Implement comprehensive crash reporting to quickly identify and prioritize issues. Monitor crash rates across different devices, OS versions, and use cases to spot patterns. Establish a rapid response protocol for critical crashes affecting large user segments. Conduct thorough testing before releases, including edge cases and older devices. Optimize app performance to prevent crashes from memory issues or slow loading times. Communicate proactively with users when crashes occur, keeping them informed about fixes.
Benefits of mobile app engagement analytics
Mobile app engagement analytics transform raw data into actionable insights that drive growth. Rather than making decisions based on hunches, you can see exactly how users interact with your product.
These analytics help you identify your most valuable user segments – those who engage deeply and convert at higher rates. You can then tailor experiences to different cohorts, personalizing features, content, and messaging based on behavior patterns.
Engagement analytics also enable experimentation and optimization. You can test new features with a subset of users, measure impact on key metrics, and roll out changes confidently. They provide the feedback loop necessary for continuous improvement.
Perhaps most valuably, engagement data helps you allocate resources effectively. Instead of guessing which features to build next, you can see which improvements would have the greatest impact on retention and revenue.
How to increase mobile app engagement
Focus on onboarding excellence
First impressions are critical. Users decide within minutes whether your app is worth their time. Create an onboarding flow that quickly demonstrates your app’s core value proposition. Avoid overwhelming users with lengthy tutorials – instead, use interactive walkthroughs that let them experience benefits firsthand. Personalize onboarding based on user goals or preferences collected during signup.
Implement push notifications strategically
Push notifications can boost engagement by 88% when done right – or drive uninstalls when done poorly. Send notifications that provide genuine value: personalized recommendations, time-sensitive opportunities, milestone celebrations, or useful reminders. Respect user preferences and avoid notification fatigue. Let users customize what notifications they receive and when.
Build habit-forming features
Design features that benefit from regular use and create positive habit loops. Incorporate streak counters, daily challenges, or progressive unlocks that reward consistency. Use variable rewards – occasional surprises that keep experiences fresh and engaging.
Personalize the user experience
Leverage data to create individualized experiences. Recommend content or features based on past behavior. Customize interfaces to highlight each user’s most-used functions. Send targeted messages acknowledging user milestones or suggesting relevant features they haven’t tried.
Continuously optimize performance
Technical excellence isn’t glamorous, but it’s essential. Fast load times, smooth animations, and crash-free experiences form the foundation for engagement. Users won’t engage with apps that frustrate them, regardless of how great the features are.
Create social connection opportunities
Social features dramatically boost engagement. Let users connect with friends, share achievements, or participate in communities around shared interests. Social accountability and friendly competition drive repeated engagement.
Iterate based on data
Treat engagement as an ongoing optimization challenge rather than a one-time fix. Regularly review your metrics, identify opportunities for improvement, test hypotheses, and measure results. The apps with the highest engagement didn’t achieve it overnight – they continuously refined their approach based on user feedback and behavioral data.