TL;DR
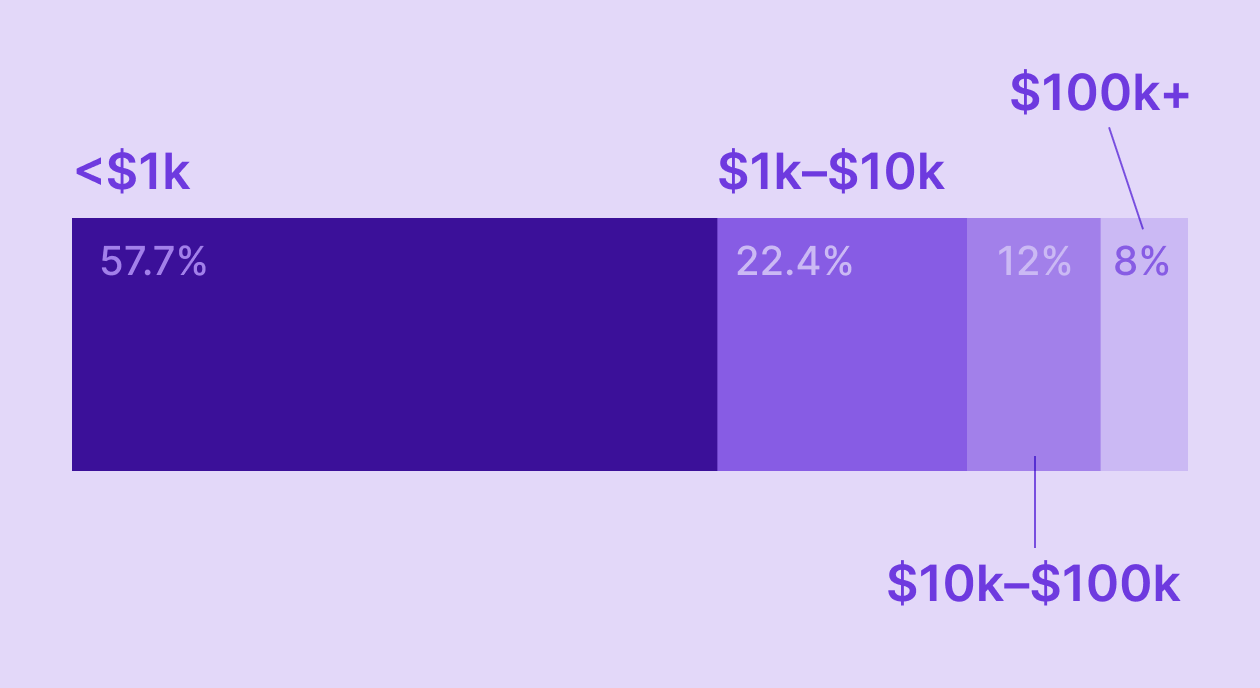
- 58% of new apps earn under $1K in their first year — and zero-earners aren’t even in that count.
- The top 10% of apps take 94.5% of all subscription revenue. That share keeps growing.
- Apps that experiment consistently make up to 40x more than those that don’t.
Everyone talks about the app economy like it’s a gold rush. $210B in global in-app purchase revenue by 2026. Millions of new installs every day. Plenty of that is true.
What nobody leads with: 58% of new subscription apps earn under $1,000 in their first year. The top 10% take 94.5% of everything. And the number of new apps launching grew 31% in 2025, while median revenue per new app dropped 22%.
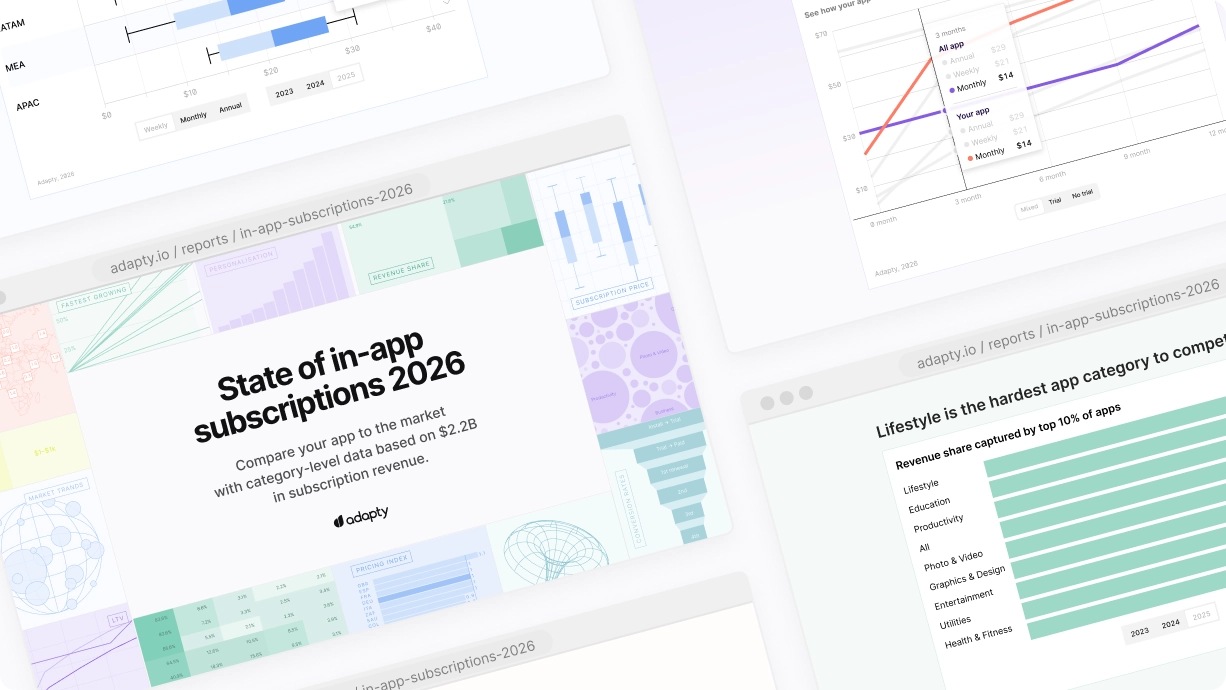
So, how much does a subscription app make? We looked at $3B in real subscription revenue across 16,000+ apps. Here’s what the data actually says — broken down by category, platform, and whether you’re building an AI app or not.
Most apps make almost nothing. Here’s the actual distribution
Let’s start with the number nobody leads with: 58% of new subscription apps earn under $1,000 in their first year. And that’s only counting apps that earn something. Apps with zero revenue aren’t even in that figure.
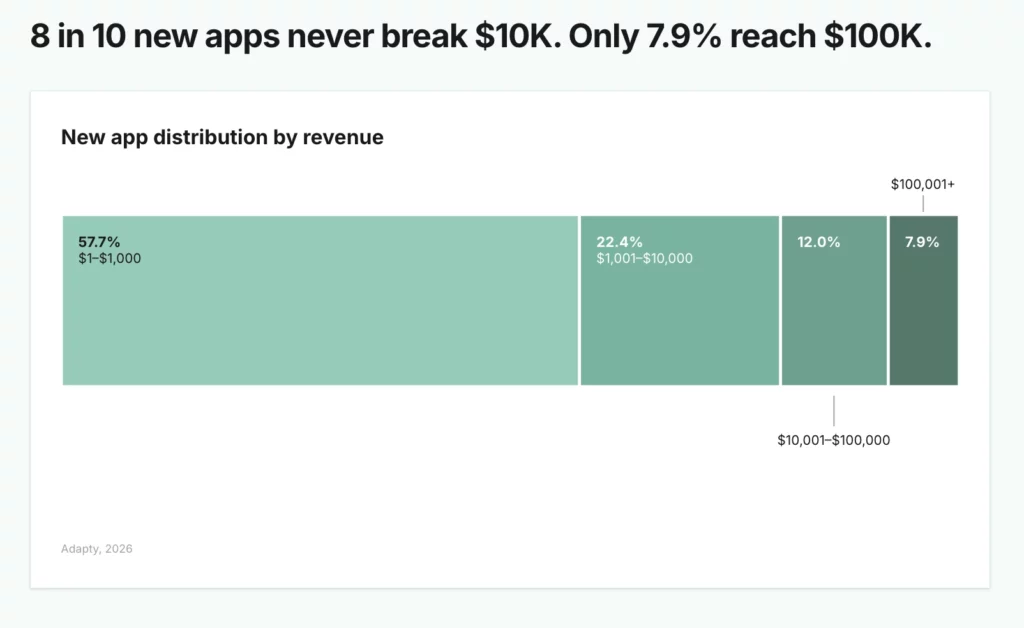
Only 7.9% of new apps reach $100K. And that’s the cohort you’re competing in when you launch.
This isn’t meant to discourage you. But if you’re planning your app’s monetization strategy around “the market is growing fast,” you need to zoom in on the distribution, not the total.
The market growing to $210B doesn’t mean the average app makes more money. It means the top apps are making a lot more money.
The top 10% take almost everything
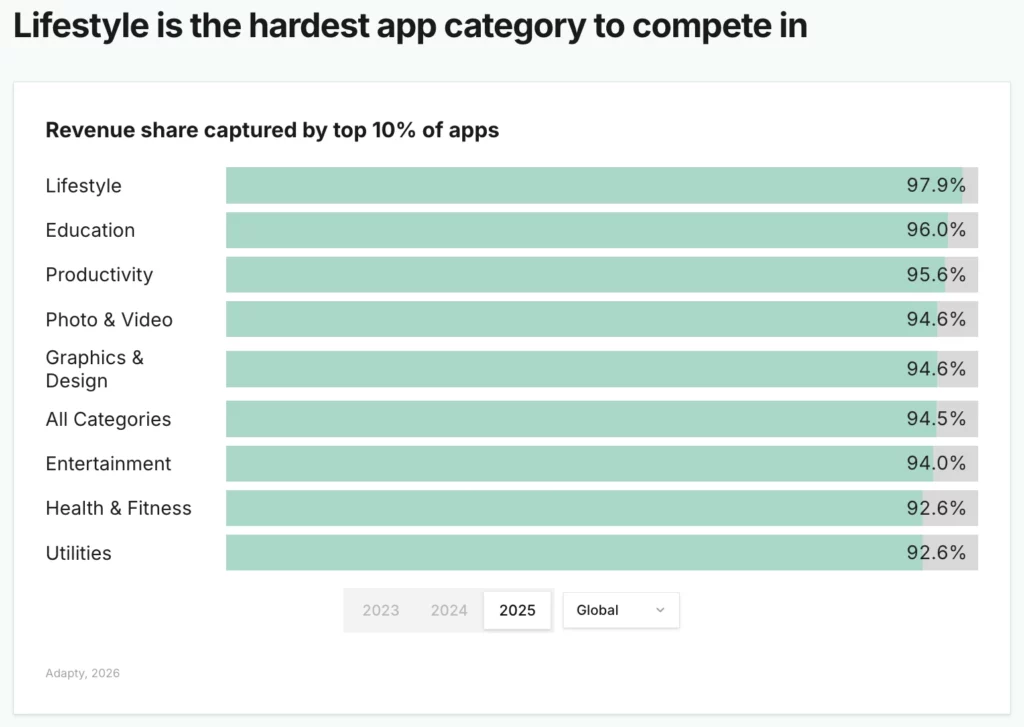
The concentration of subscription revenue is one of the most important structural facts about the app economy — and one of the least discussed.
Lifestyle is the most extreme: 97.9% of revenue goes to the top 10%. Health & Fitness and Utilities are slightly more forgiving at 92.6% each — but “slightly more forgiving” still means the bottom 90% share 7.4% of the market.
The number of subscription apps grew 31% in 2025. Median revenue per new app dropped 22%. More competition + more concentration = harder for everyone except the leaders.
What this means in practice: it’s not enough to build a good app with reasonable monetization. You need to be in the top tier of your category. That requires data, iteration, and a willingness to treat monetization as a product problem — not an afterthought.
What does a “typical” app actually earn? LTV benchmarks by category
If you do break through into meaningful revenue territory, here’s what one-year LTV looks like across categories. These are median figures — meaning half the apps in each category are above, and half are below.
| Category | Median 1-Year LTV | Best plan + strategy |
| Productivity | $46.97 | Any plan with trials |
| Utilities | $46.30 | Annual with trials ($68.90) |
| Education | $45.10 | Annual with trials |
| Photo & Video | $0.82 (install LTV) | Weekly with trial |
| Lifestyle | $0.70 (install LTV) | Direct > trial |
| Health & Fitness | $1.21 (install LTV) | Annual with trials |
| Entertainment | $0.59 (install LTV) | Low price, high volume |
| Graphics & Design | $0.78 (install LTV) | Weekly with trial |
A few things worth calling out: Productivity leads overall at $46.97, but in Productivity specifically, direct buyers are worth more than trial users — $56.95 vs $49.13. If you’re in Productivity and defaulting to “always offer a trial,” you may actually be acquiring your worst subscribers. Trial conversion rates vary significantly by category.
Utilities tell a different story. Utilities lead all categories in long-term retention, and the logic is simple: a tool that solves a real, recurring problem gets used daily. Understanding your unit economics first helps you see why annual plans with trials generate a median of $68.90 per user over 12 months.
iOS vs. Android: still a 5x revenue gap — but it’s changing
If you’re building cross-platform and trying to figure out where to focus your monetization efforts, the numbers are pretty clear: iOS still dominates.
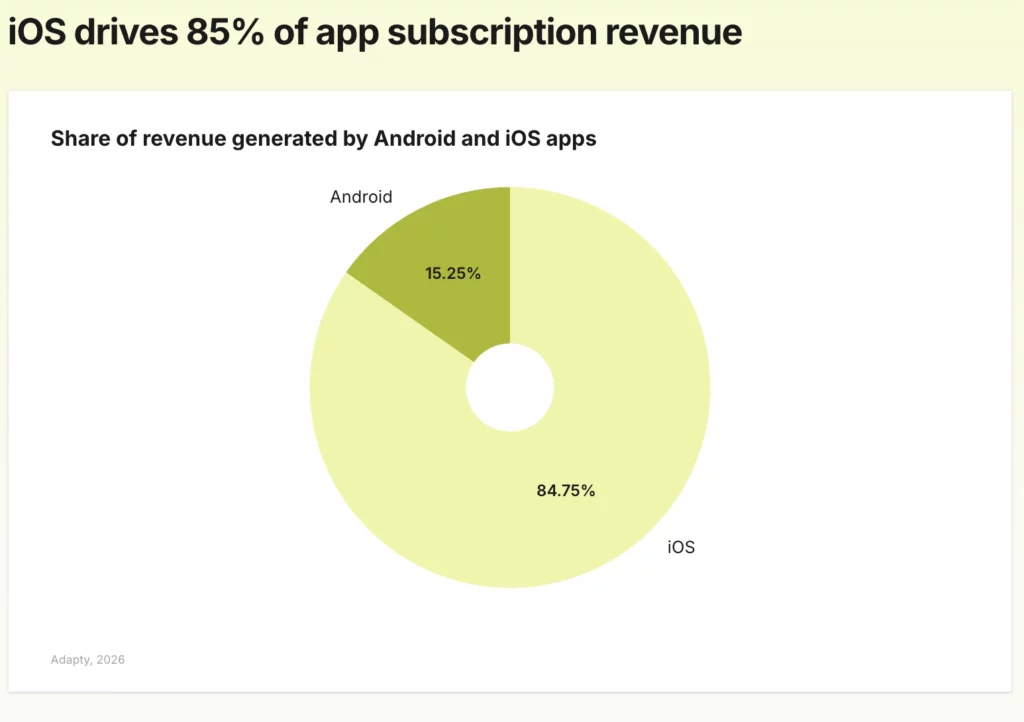
iOS generates 5.6x more subscription revenue than Android. That’s not primarily because iOS users pay more per plan — Android users actually pay almost the same once they subscribe. The gap is almost entirely about conversion. iOS converts 3x better than Android on average. On annual plans, the gap is 3.6x.
Here’s what actually makes iOS so dominant: the install-to-paid funnel is fundamentally different. Once an Android user converts to a trial, their trial-to-paid conversion and retention nearly match iOS. The problem is getting them to start.
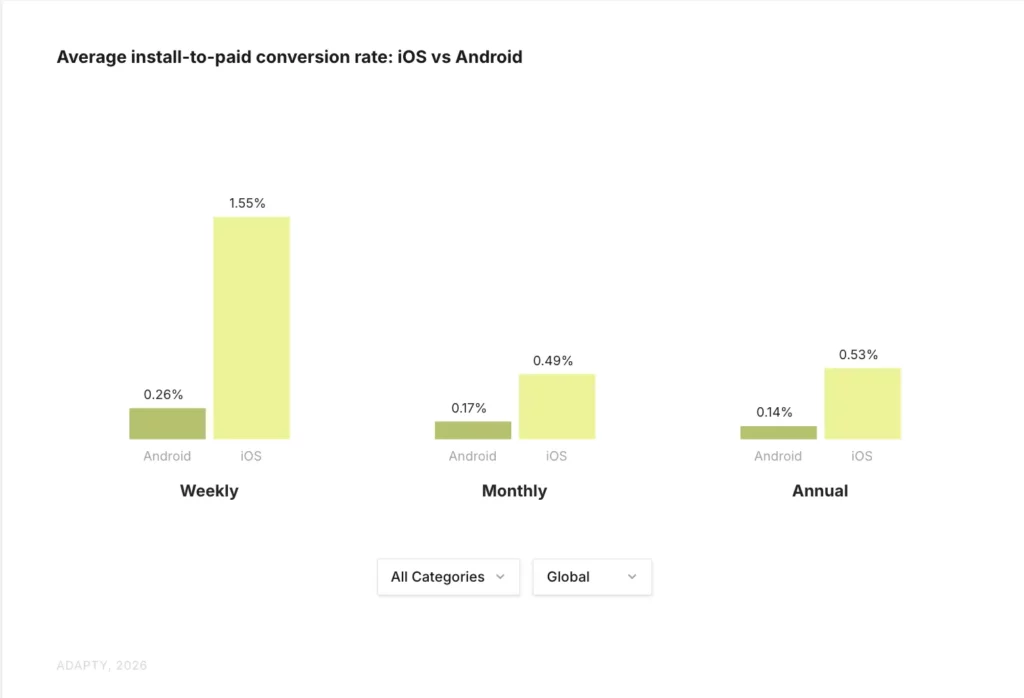
That said, the gap is closing. For the first time, install-to-paid conversion for monthly subscriptions reached parity between iOS and Android in the Entertainment niche. Android is also a strong play if you plan to launch web-to-app funnels — it unlocks a large share of users while giving you the flexibility of web payments and the ability to bypass store fees.
What this means for your strategy
- Weekly plans lower the psychological barrier on Android. Smaller commitments work better in emerging markets where Android is dominant.
- Location-specific pricing matters more on Android. Users are more price-sensitive.
- If you’re in Entertainment, Lifestyle, Photo & Video, or building AI tools — Android is worth a real monetization investment.
- Web-to-app funnels on Android can significantly improve unit economics if you’re running paid acquisition.
AI apps: the highest LTV category, with a catch
AI apps are the most interesting segment in the 2026 data — and probably not in the way you’d expect.
That’s the upside. Here’s the full picture:
| Metric | Average App | AI Apps |
| Install → Trial | 10.92% | 5.31% (2x worse) |
| Trial → Paid | 25.59% | 20.60% |
| Install → Direct | 3.71% | 4.20% (+14%) |
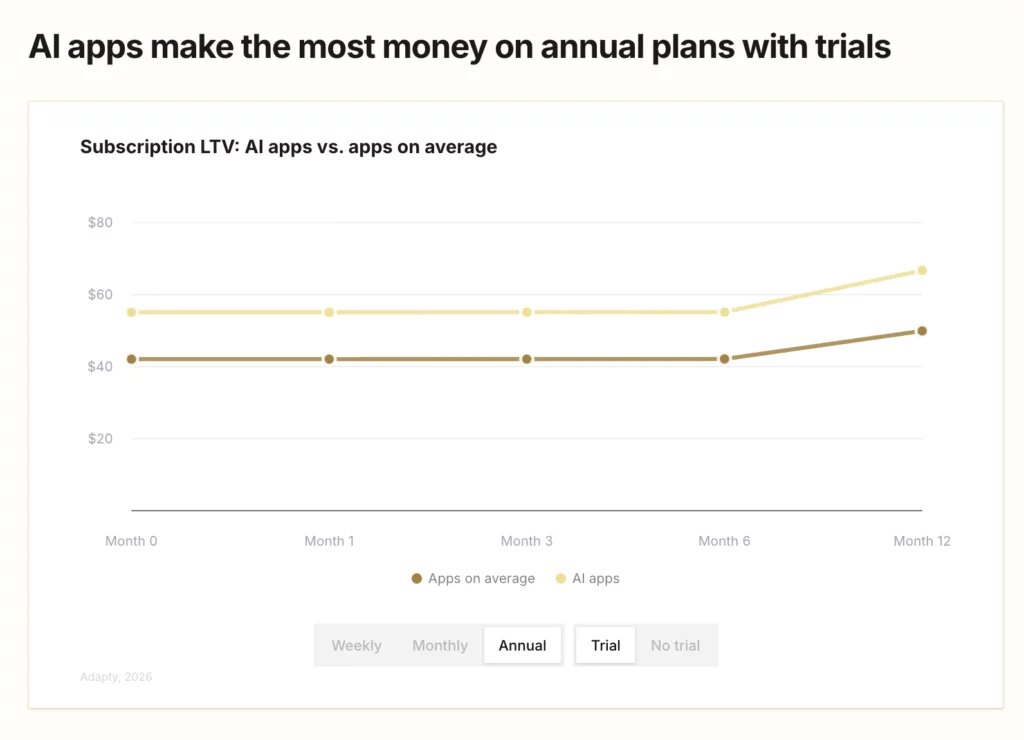
| Annual + trial LTV | $49.92 | $66.70 |
| Install LTV (median) | $0.84 | $1.44 (+70%) |
| 1-year retention | Baseline | ~20% worse |
AI apps are harder to convert into trials — likely because users are more skeptical, the competition is loud, and the value proposition often needs more proof. But the users who do pay, pay more. Annual plans with trials are where AI apps pull ahead: $66.70 vs $49.92 one-year LTV.
The retention story is the honest challenge. AI apps lose about 20% more annual subscribers by year’s end compared to the average app. They churn faster but charge more per user — so LTV still wins. But it means your acquisition and paywall strategy needs to compensate for that churn.
Revenue growth is extraordinary in some categories. Lifestyle AI apps saw 691% YoY revenue growth in 2025. Graphics & Design was up 202%, Utilities 174%. If you’re building in any of these spaces, the ceiling is real — but so is the challenge of holding onto users.
The pricing problem is specific to AI apps
Building an AI-powered app means your underlying costs scale with usage. This makes pricing optimization not just a growth lever but a unit economics survival question.
Subscription prices grew 7-10% from 2023-2025 across the market, with annual plans seeing the largest increases. High-priced subscriptions drove 1.5-5x more revenue per install than low-priced ones. If you’re still pricing your AI app at $4.99/month because it feels “approachable,” you may be pricing yourself out of profitability.
What moves revenue: the factors that matter most
Across 16,000+ apps, a few patterns are consistent enough to be worth treating as principles rather than hypotheses.
Weekly plans dominate — and the gap is widening
Two years ago, weekly plans generated 43.3% of app subscription revenue. In 2025, it’s 55.5%. Weekly plans with trials are the top-performing paywall configuration overall. A weekly plan with a trial generates $54.50 in 12-month LTV vs $7.40 without a trial — a 636% difference.
Health & Fitness is the exception: annual plans dominate there and are still growing their share. If you’re in any other category, the data strongly supports testing weekly.
Trials: not a universal win
7 in 10 apps offer trials — that number has barely moved in two years. The industry has accepted trials as standard. But the data shows they’re not uniformly positive.
- In Utilities, Health & Fitness, and Education — trials boost LTV significantly.
- In Productivity and Lifestyle, direct buyers are worth more than trial users. In Lifestyle, trial users end up 21% less valuable.
- The right question isn’t “should I offer a trial” — it’s “what does a converted trial user look like in my category vs. a direct buyer.”
Experimentation compounds
This is the single most actionable finding in the report: apps that run experiments make up to 40x more revenue than those that don’t. The average testing app runs 14.7 experiments. They don’t stop at one.
Localization tests drive the largest LTV uplift (62.3% of tests show positive results). Visual/text-only changes are the hardest to win on — only 34.6% of tests improve LTV. If your entire experimentation program is “change the headline on the paywall,” you’re testing the wrong thing.
Pricing: most apps are undercharging
High-priced apps earn 3x the LTV of low-priced apps. In Health & Fitness, expensive annual plans earn 4.5x more per user than cheap ones. Europe overtook North America as the most expensive region — European prices are now up to 40% higher, and European users are paying it. For a tactical breakdown of how to price your subscription, the data on willingness to pay by region is the place to start.
9 in 10 subscriptions sell at full price. Discounts are rare across every category. The data do not support the idea that you need to discount to convert.
The honest answer: where does your app land?
Here’s a realistic framework for thinking about where subscription apps fall in the distribution.
| Revenue tier | What it looks like | What separates them |
| Under $1K/year | 58% of new apps | Usually: weak conversion, no iteration |
| $1K–$10K/year | ~34% of new apps | Some traction, not yet optimized |
| $10K–$100K/year | ~8% of new apps | Active experimentation, strong paywall |
| $100K+/year | ~8% of new apps | Data-driven, category-level positioning |
| Top 10% | Earn 94.5% of all revenue | Constant iteration + structural advantages |
The gap between $1K and $100K/year isn’t mainly about product quality. It’s usually about how seriously the team treats monetization as a discipline — how frequently they experiment, how well they understand their conversion funnel, and whether they’re pricing based on data or intuition.
Building is the easy part. Knowing what to price, how to convert, and when to change — that’s the actual work.
All data in this article comes from Adapty’s state of in-app subscriptions 2026 — built on $3B in subscription revenue across 16,000+ apps. Filter benchmarks by your category, region, and plan type.