TL;DR
- Weekly plans with a free trial produce the highest 12-month LTV of any paywall setup. Adding a trial to a weekly plan takes LTV from $7.40 to $54.50 — a 636% increase.
- “Always offer a trial” is wrong for at least three categories. In Productivity and Lifestyle, direct buyers are worth significantly more than trial users.
- 9 in 10 subscriptions sell at full price. Discounts work — but only when timed to catch users who didn’t convert, not broadcast to everyone.
- Hard paywalls produce 21% higher LTV. Soft paywalls convert ~50% better. The right answer is neither — it’s testing both.
- Apps that run experiments consistently earn up to 40x more revenue. The average number of experiments among top performers is 14.7. Most teams are testing the wrong things first.
Most apps have a paywall. Almost none have spent serious time questioning whether the structure is right.
The paywall gets built at launch — plan type chosen based on what a competitor was doing, trial length set by gut feel, placement decided by whoever had the strongest opinion in the room. Then it stays that way. When conversion looks low, the instinct is to change the headline or test a new color. That instinct is almost always wrong.
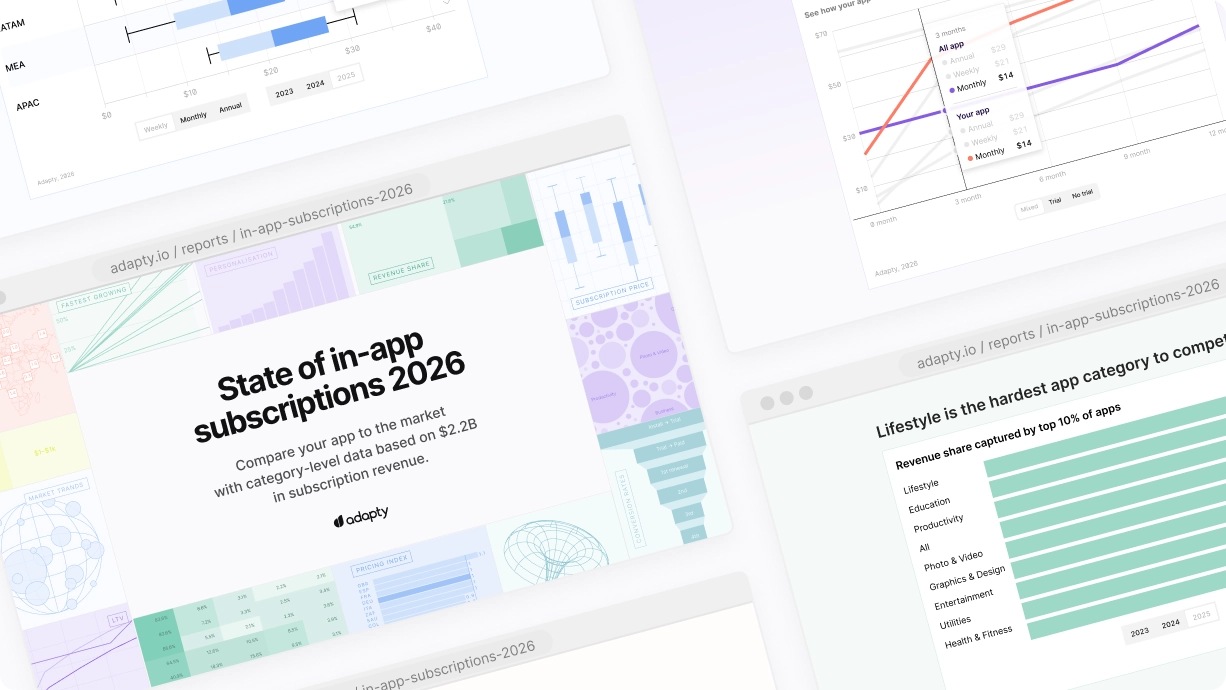
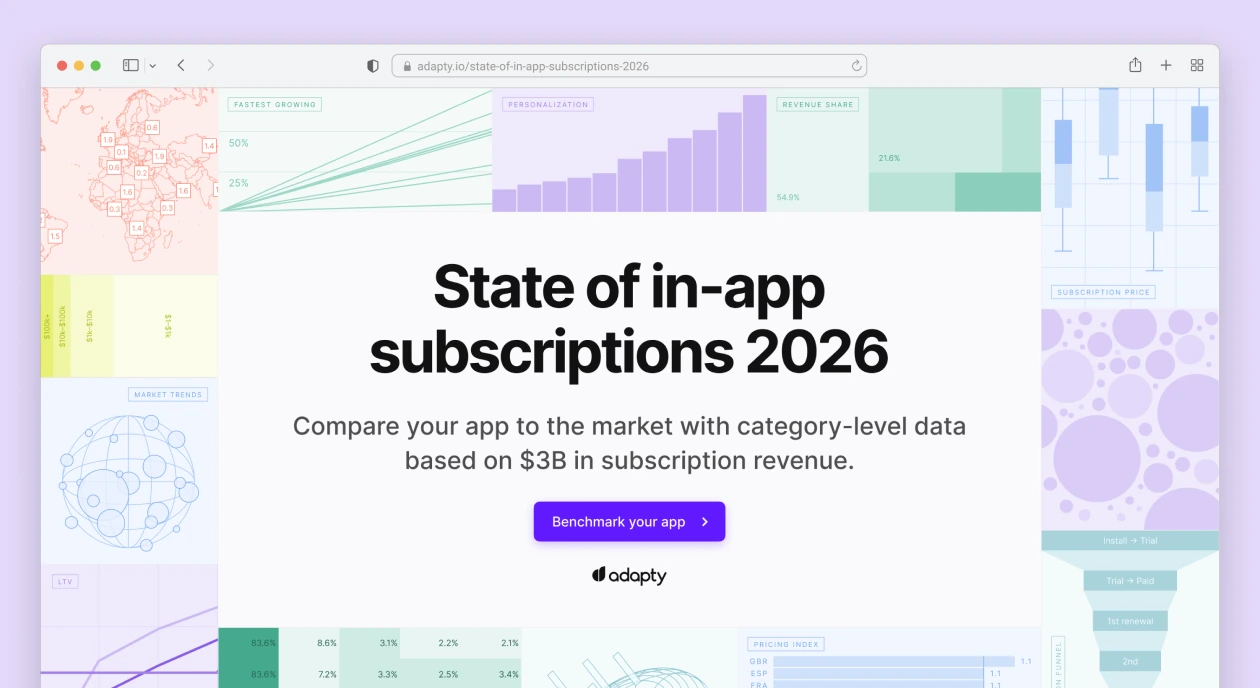
The data from Adapty’s state of in-app subscriptions 2026 report — built on $3B in subscription revenue across 16,000+ apps — makes the cost of that approach measurable. The gap between the best and worst paywall configurations isn’t 10%. It’s 636% on LTV. The gap between apps that test systematically and apps that don’t is up to 40x in revenue.
Here’s what a high-performing paywall actually looks like, what the structural decisions are, and what top apps are testing right now.
What “right” actually means: six structural decisions
Most paywall conversations focus on design. The data says design is the last thing to optimize. What actually drives the difference between a paywall that works and one that doesn’t comes down to six structural decisions — and most apps have never deliberately tested any of them.
1. Plan type: why weekly took over
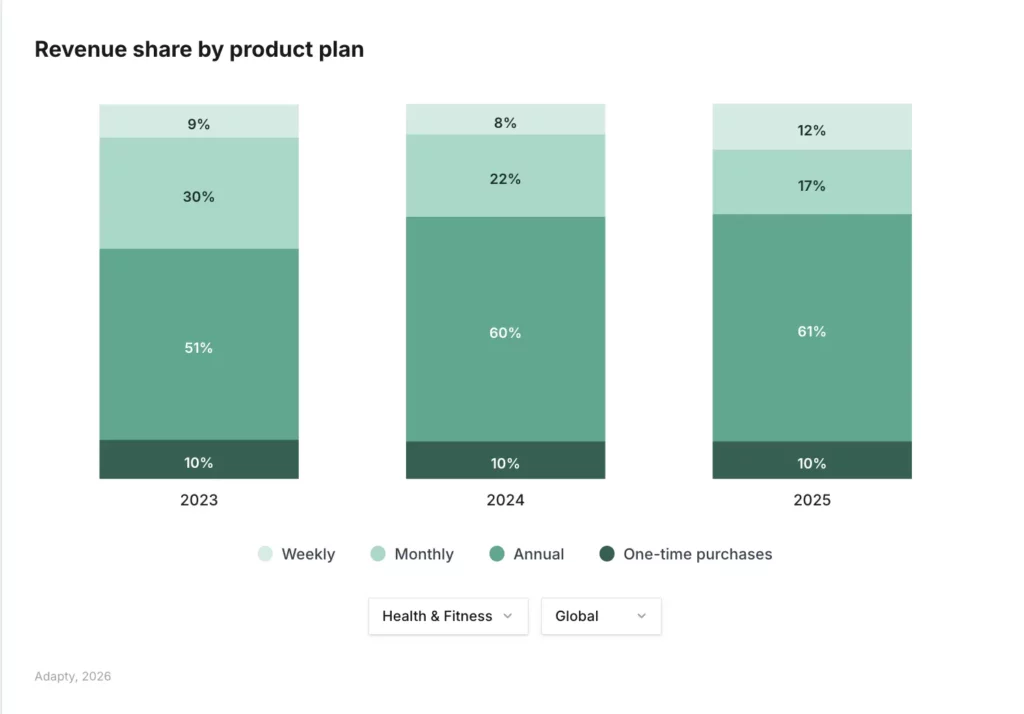
Two years ago, weekly plans generated 43.3% of all app subscription revenue. In 2025, that number is 55.6%. It’s already the dominant model, and the LTV data explains why.
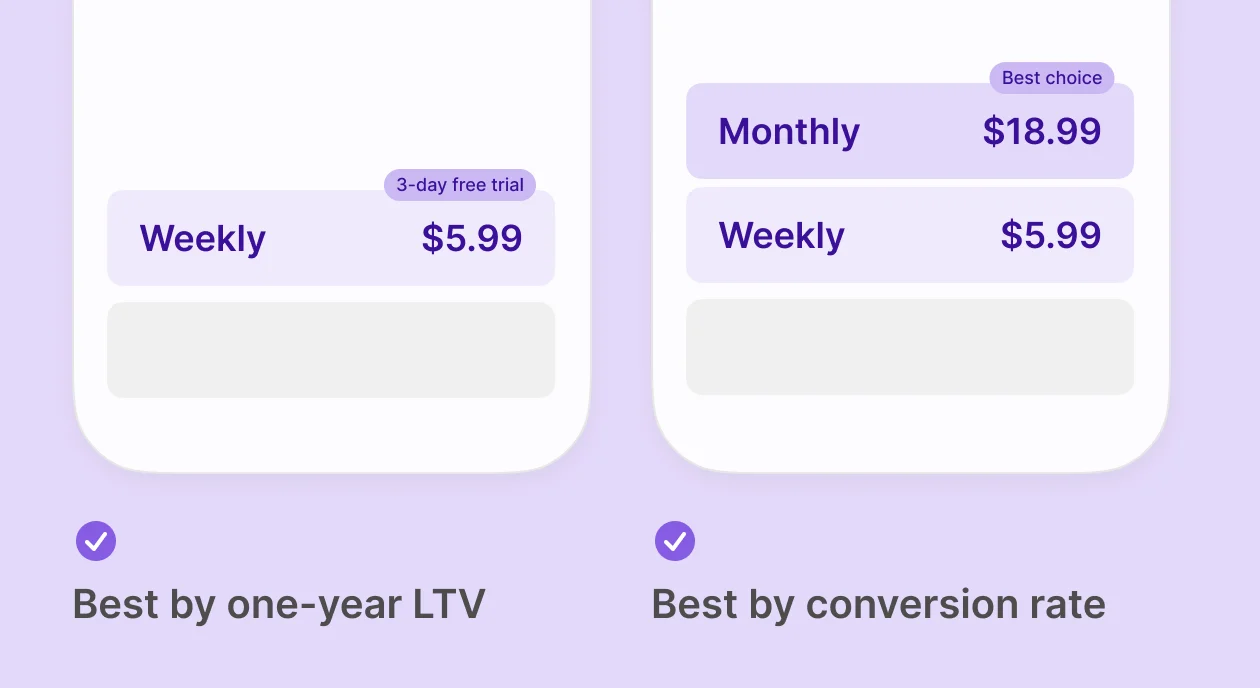
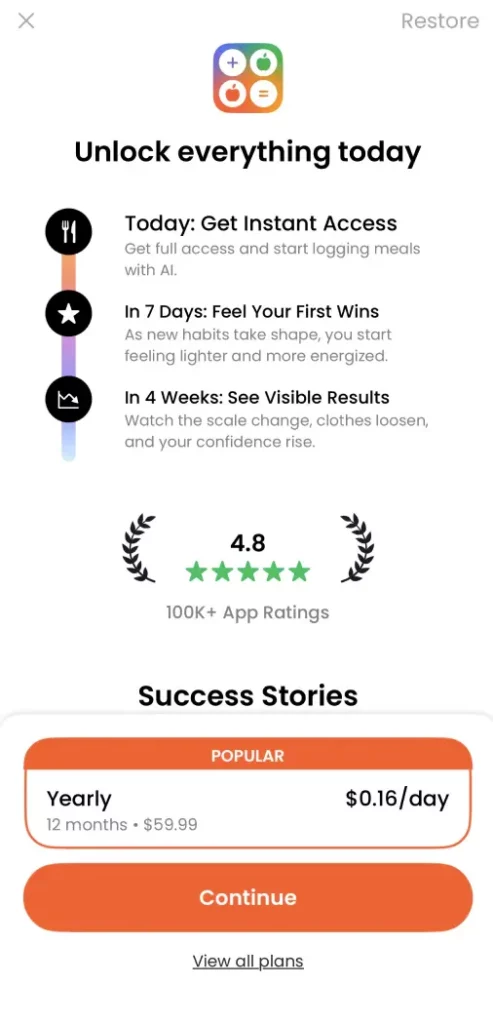
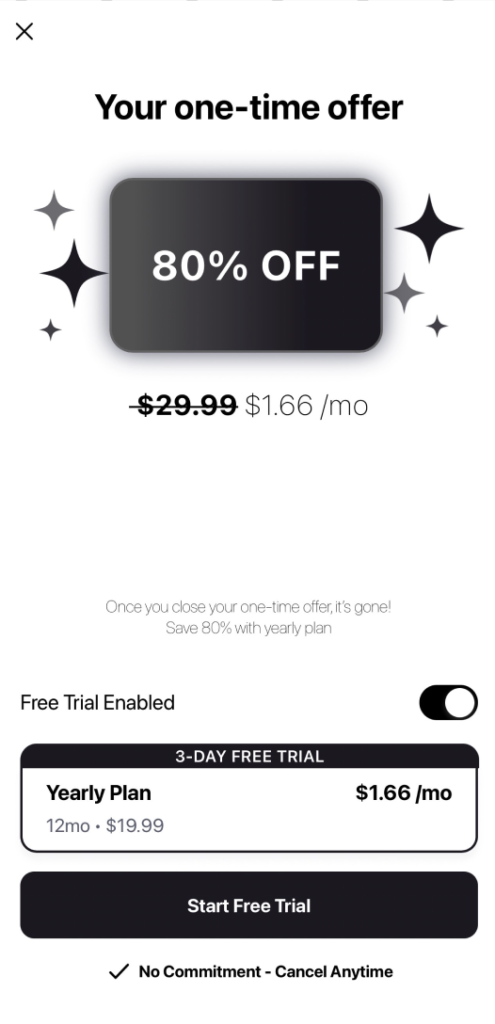
The best setup by one-year LTV: Weekly plan with a 3-day free trial. This brings in 1.5x the average LTV of all other configurations. The worst by LTV: annual plan with no trial. Many apps still lead with this.
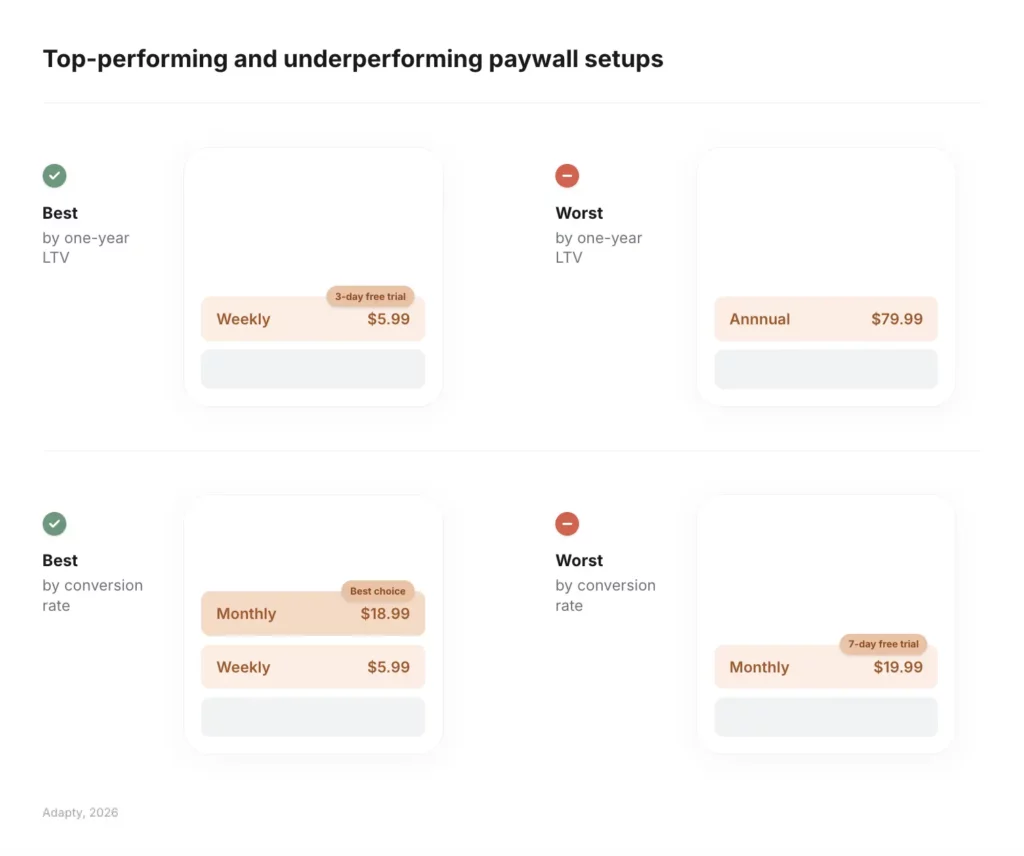
Weekly plans lower the commitment barrier, which gets more users into the billing relationship. Once inside, with the right trial setup, those users retain better and generate more revenue over time than a $5.99 entry point would suggest.
One category exception worth noting: Health & Fitness is the only category where annual plans are not just holding but continuing to grow their share. If that’s your category, the weekly playbook applies differently. For most others — Productivity, Lifestyle, Utilities, Entertainment, Photo & Video — weekly with trial is now the benchmark.
2. Trial: the rule that’s wrong for three categories
The standard advice is to always offer a free trial. The data says that advice is wrong for at least three categories, and following it blindly is actively costing some apps money.
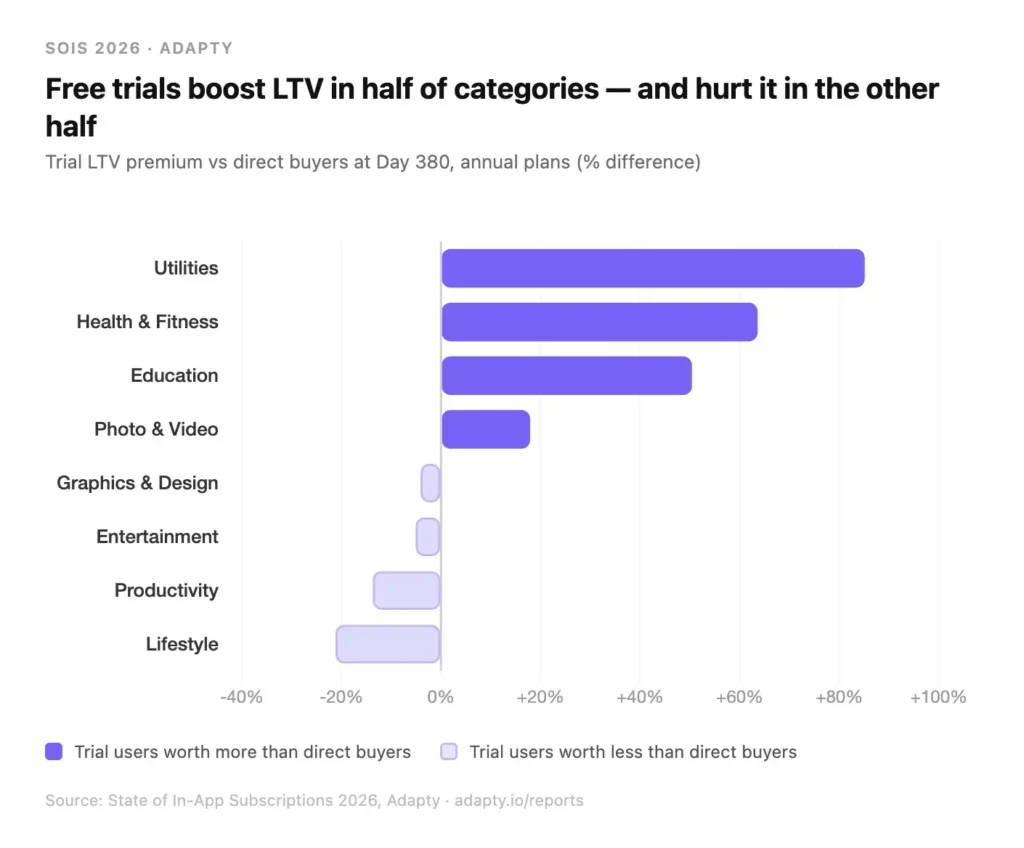
In Productivity, direct buyers generate $56.95 in one-year LTV compared to $49.13 for trial users. In Lifestyle, trial users end up 21% less valuable than direct buyers. Graphics & Design shows the same pattern.
Trials clearly work in Health & Fitness, Education, and Utilities — categories where users need time to experience the value before committing financially. In these categories, trial users retain significantly better at first renewal.
“Always offer a free trial” is bad advice. The data breaks it. In Productivity, direct buyers are worth $56.95 vs $49.13 for trial users. In Lifestyle, it’s even wider: trial users end up 21% less valuable than direct buyers. Trials are a quality filter in some categories and a churn magnet in others. The question founders should ask is not ‘should we offer a trial’ but ‘what does a converted trial user look like in our category compared to a direct buyer.’
— Sven Jürgens, App Growth Consultant & Advisor
3. Placement: the paywall isn’t a moment, it’s the moment
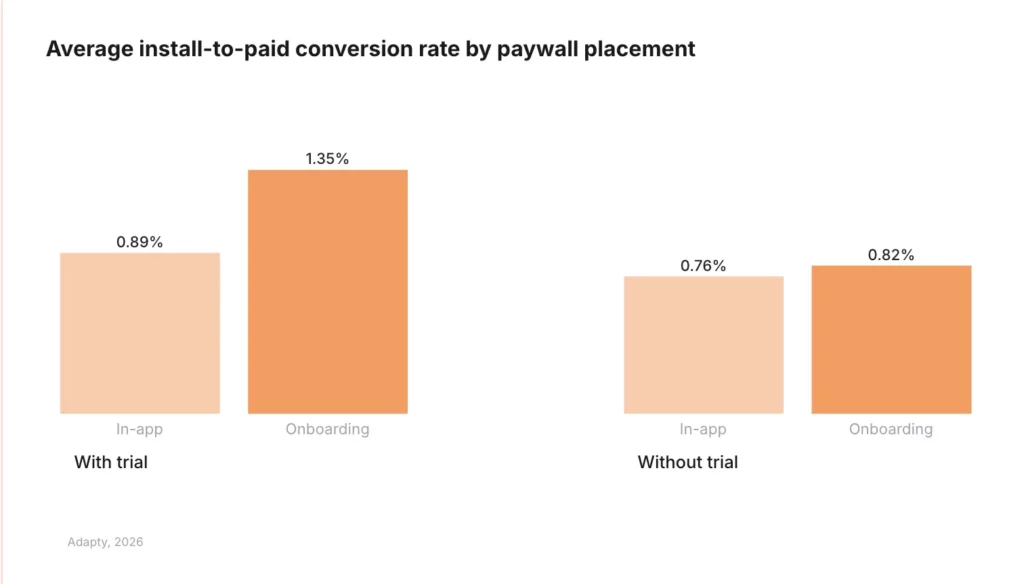
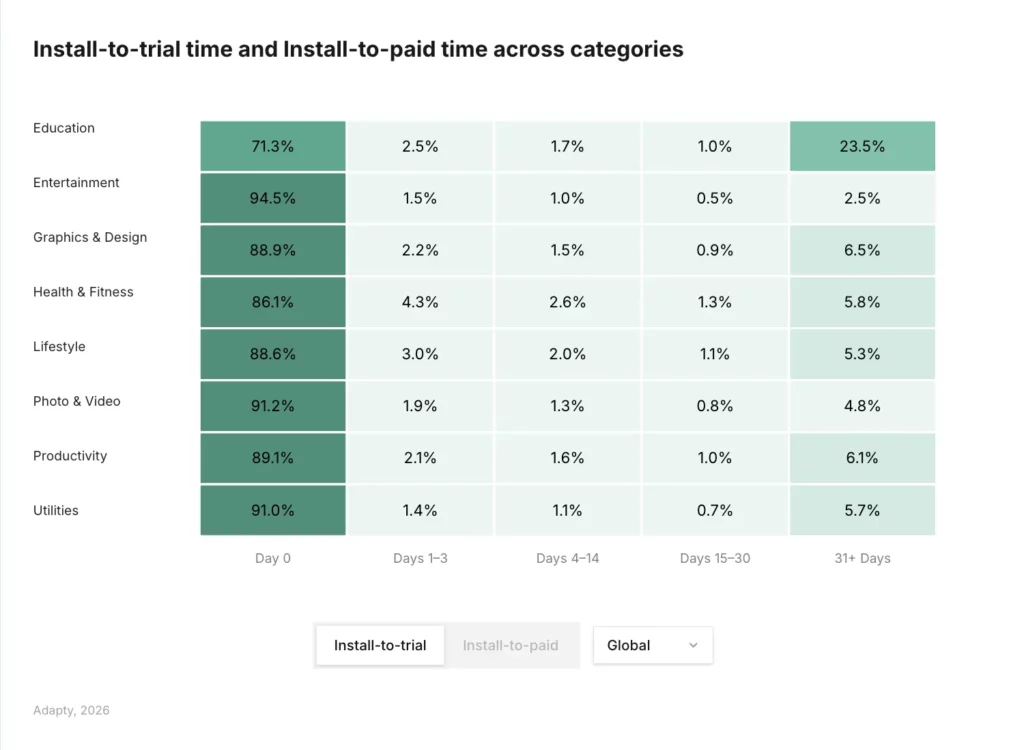
Onboarding paywalls with trials convert at 1.35% on average — the highest of any placement and trial combination in the report. And 90% of trial starts happen on Day 0. 44.5% of all purchases happen on Day 0.
Most users who don’t convert during onboarding never come back to the paywall. The decision happens once, on Day 0, and then it’s done. Building elaborate re-engagement strategies around paywall conversion is optimizing the wrong problem.
A lot of apps show the paywall before those questions are answered. When that happens, the paywall becomes a moment of doubt rather than momentum. The apps that convert well tend to do something different. They create a small experience before the paywall that proves the product is useful. Timing matters too. A paywall that appears before any progress creates skepticism. One that appears right after progress feels like a continuation.
— Hannah Parvaz, Founder, Aperture
The practical implication: the onboarding and the paywall are one funnel. What happens in the five screens before the paywall determines whether it converts — not the paywall design itself.
4. Price: most apps are underpriced and don’t know it
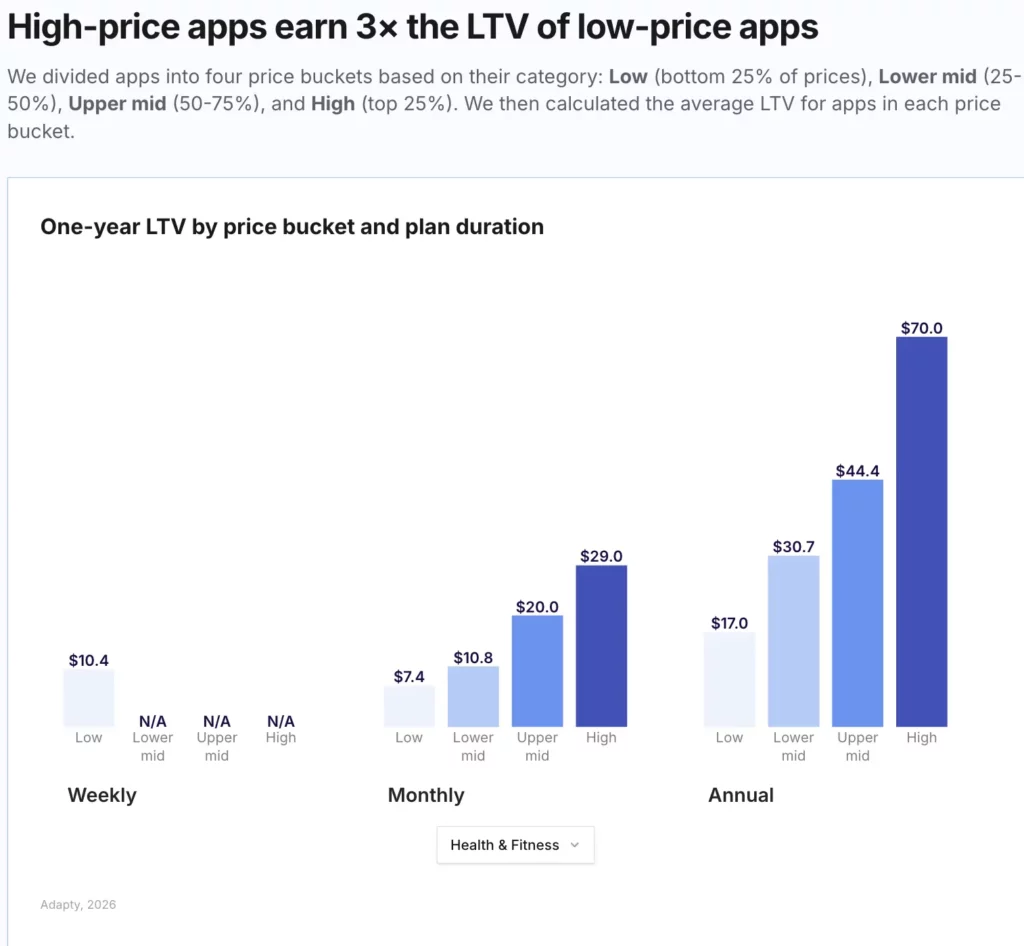
High-priced apps earn 3x the LTV of low-priced apps. In Health & Fitness specifically, expensive annual plans earn 4.5x more per user than cheap ones. In APAC, the gap between cheap and expensive weekly plans is 3.1x — the widest of any region.
The pricing data from 2025 adds another dimension: European subscription prices jumped 18% year-over-year, with Europe now overtaking North America as the most expensive region on annual, monthly, and weekly plans.
Price tests rarely improve conversion — only a 28.3% win rate on conversion in the experiment data. But they lift LTV 45.5% of the time. Raising prices doesn’t bring in more users; it brings in users worth more. For apps that haven’t tested a price increase in 12 months, this is significant.
5. Hard vs. soft paywall: the false choice
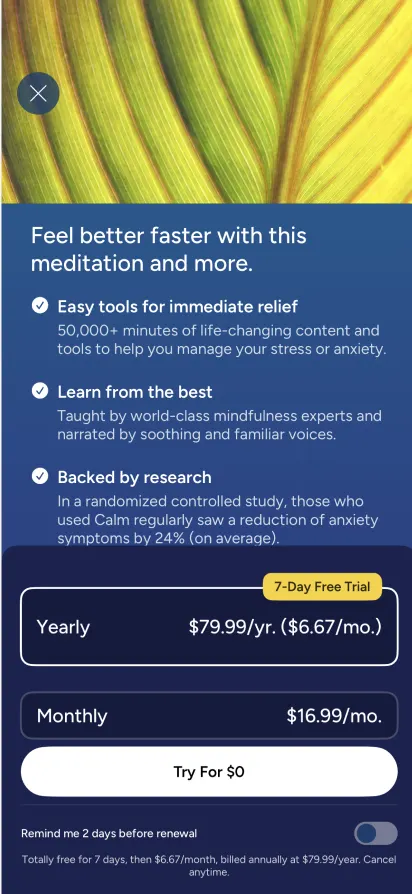
Hard paywalls produce 21% higher LTV. Soft paywalls convert ~50% better. Both are true simultaneously, which is why picking one and sticking with it is the wrong approach.
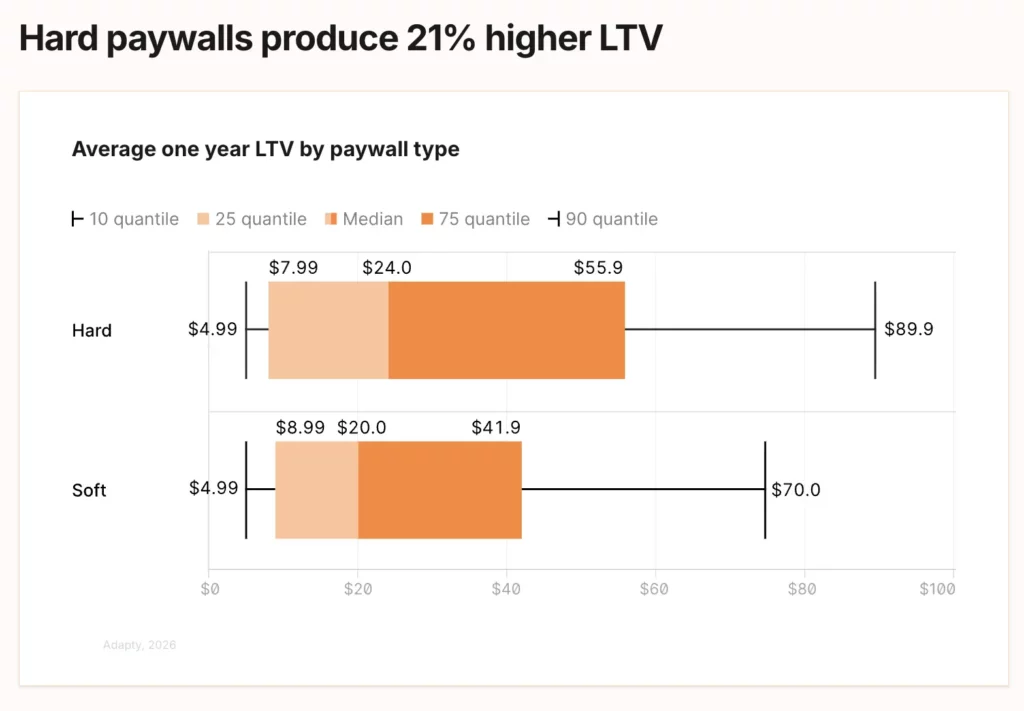
The difference shows up at the top of the distribution: hard paywall users spend 20–33% more than the median. Soft paywalls bring in more users, including users who would never have converted with a hard gate. The lowest-spending users pay about the same either way.
The hard/soft question is one of the highest-leverage tests you can run.
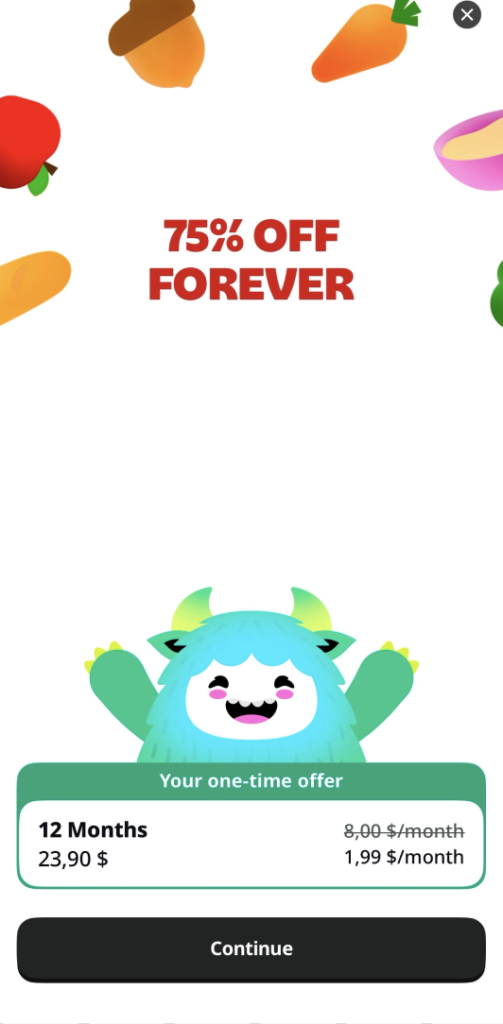
6. Discounts: rare, but they work — if timed correctly
Nine in ten subscriptions sell at full price. Nine in ten subscriptions sell at full price. Most teams see low conversion and reach for a discount. The data says that instinct is usually wrong.
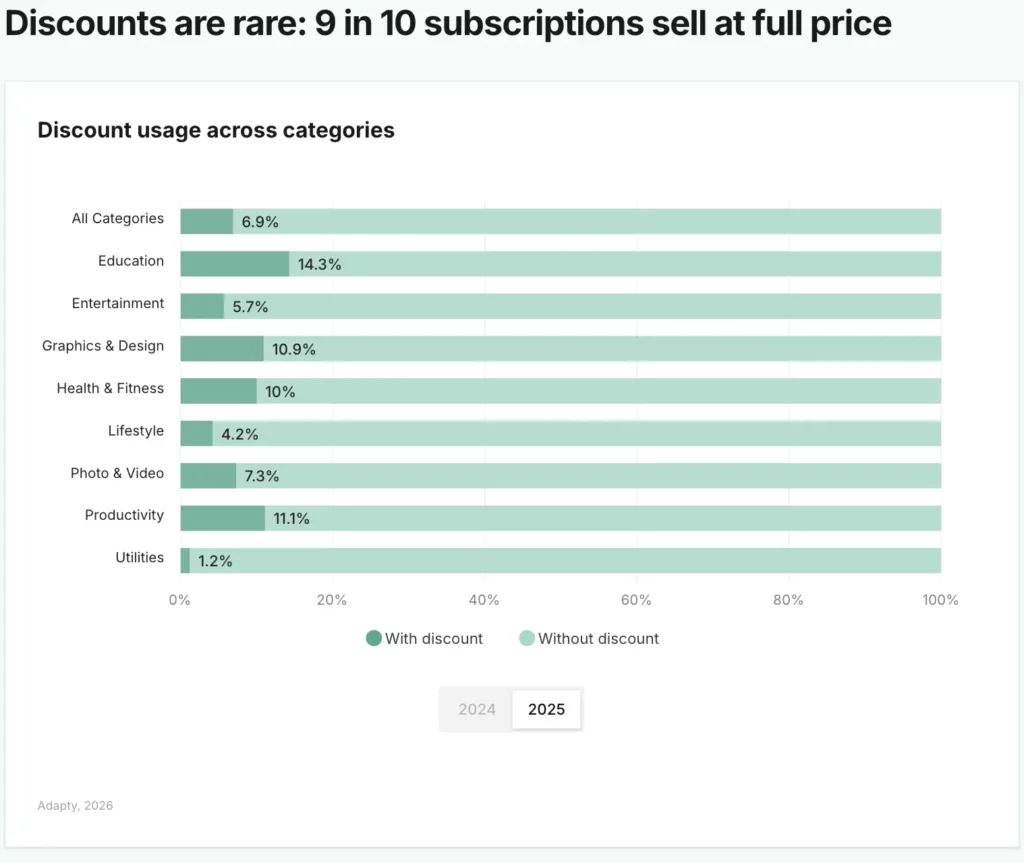
Discounts are rare across every category. Education uses them the most at 14.3% of apps. Utilities barely discount at all — just 1.2%. Most apps default to full price, and LTV reflects that positively.
Nine in ten subscriptions sell at full price. Discounts are still rare — only 14% of Education apps use them, and that’s the highest of any category. However, I’ve seen discounting work when timed well. The best time to offer a discount is when a user is most likely to convert but needs a little push to get over the hurdle.
— Steve P. Young, Founder, App Masters
The pattern that works consistently: show a time-limited discount after a user closes the onboarding paywall without converting. A 24-hour welcome offer, targeted only at non-converters, captures price-sensitive users without devaluing the product for the majority who would have paid full price anyway. The expected impact is typically 10–15% ARPU — not from discounting everyone, but from recovering near-converts at exactly the right moment.
The contrast with broad discounting matters: an app that puts a discount on the main paywall trains every user to expect a lower price and trains future users to dismiss the full-price paywall and wait. The post-close timing avoids this entirely.
What paywall experiments are worth running first?
Apps that run experiments consistently earn up to 40x more revenue than apps that don’t. The average number of experiments among the top-performing testers is 14.7. These teams don’t run one test per quarter — they treat experimentation as continuous operational practice.
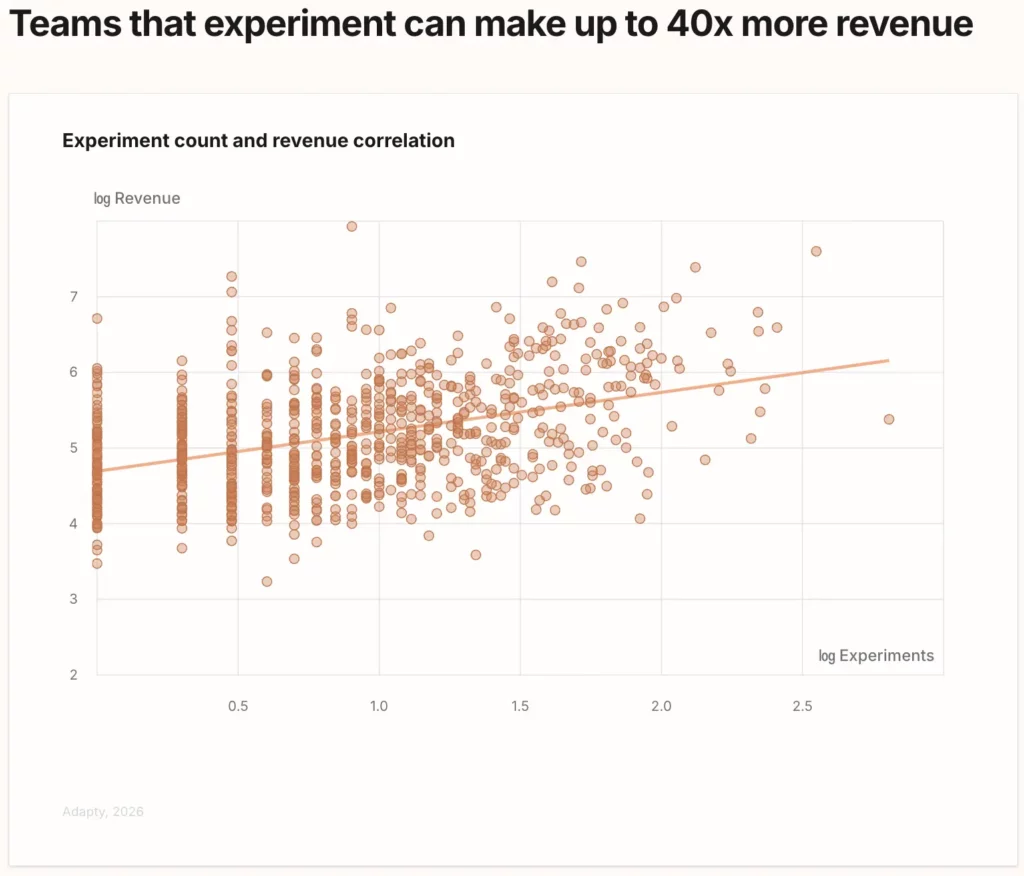
But frequency alone isn’t the point. The type of experiment matters as much, and here’s where most teams get it wrong.
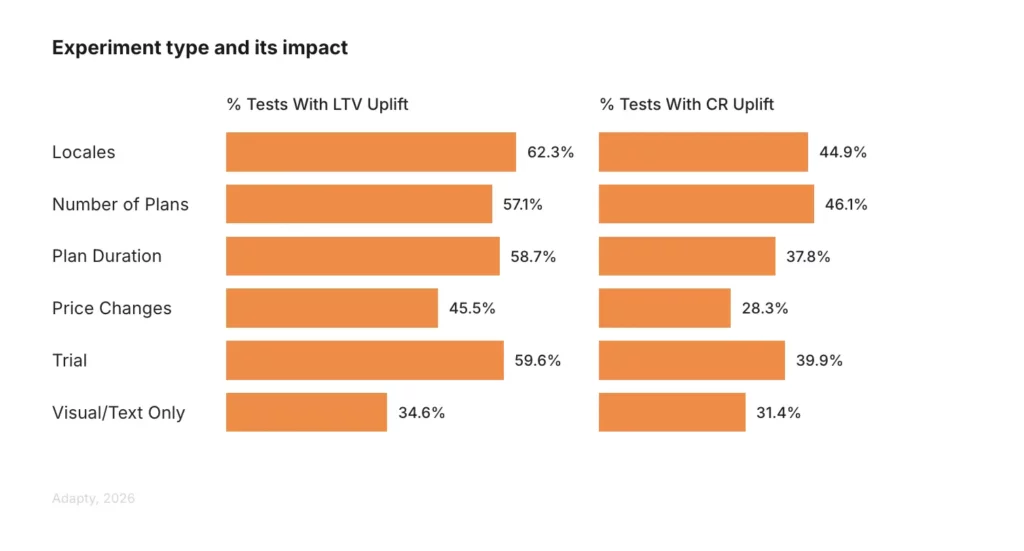
Win rates by experiment type (LTV uplift):
- Localization tests: 62.3% win rate on LTV — the highest of any category
- Trial structure tests: 59.6% win rate on LTV
- Plan duration tests: 58.7% win rate on LTV
- Number of plans tests: 57.1% win rate on LTV
- Price change tests: 45.5% win rate on LTV
- Visual and copy-only tests: 34.6% win rate on LTV — the lowest
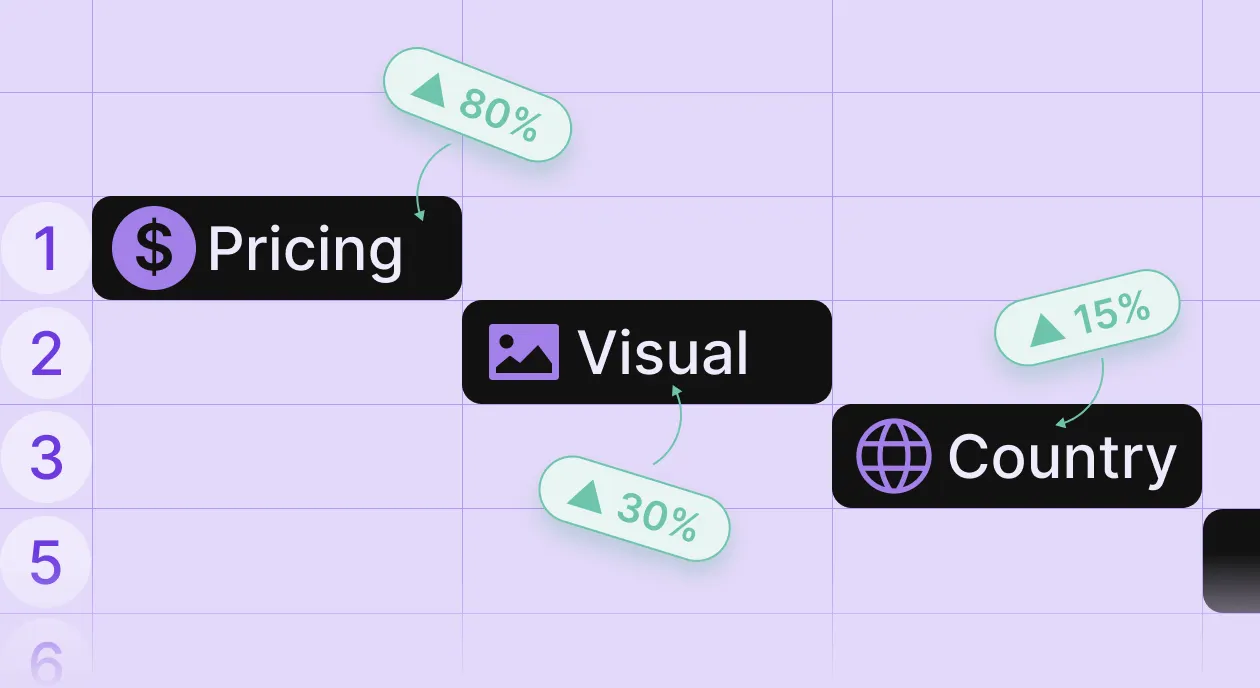
Visual and copy tests have the lowest win rate of any experiment type — and they’re the first thing most teams reach for when they want to optimize the paywall. Localization, trial structure, and plan duration tests win at nearly twice the rate, but they require more confidence to run because they feel like bigger decisions.
Localization specifically is chronically underrated. Most apps treat it as something to do after all the “real” optimization work is done. But with European prices up 40% and Japan, Mexico, and Turkey among the fastest-growing markets, localization is a pricing and structure question with higher expected returns than redesigning your paywall hero image. It has the highest LTV win rate in the entire dataset.
Pick a specific niche within a competitive category and experiment with monetization to find your unlocks: base pricing (more than discounts), plan durations (particularly weekly), and trial/no-trial (watch retention closely). With AI lowering the effort required, consider localizing for growing markets like Japan, Mexico, and Turkey.
— Sylvain Gauchet, Head of Growth, Reading.com
The other finding worth building into your testing roadmap: the apps in the top revenue tier didn’t stop at one test. The compounding effect of 14+ experiments per year — each one building on the last — is what separates the distribution. A single winning experiment moves a metric. Fourteen experiments restructure your monetization.
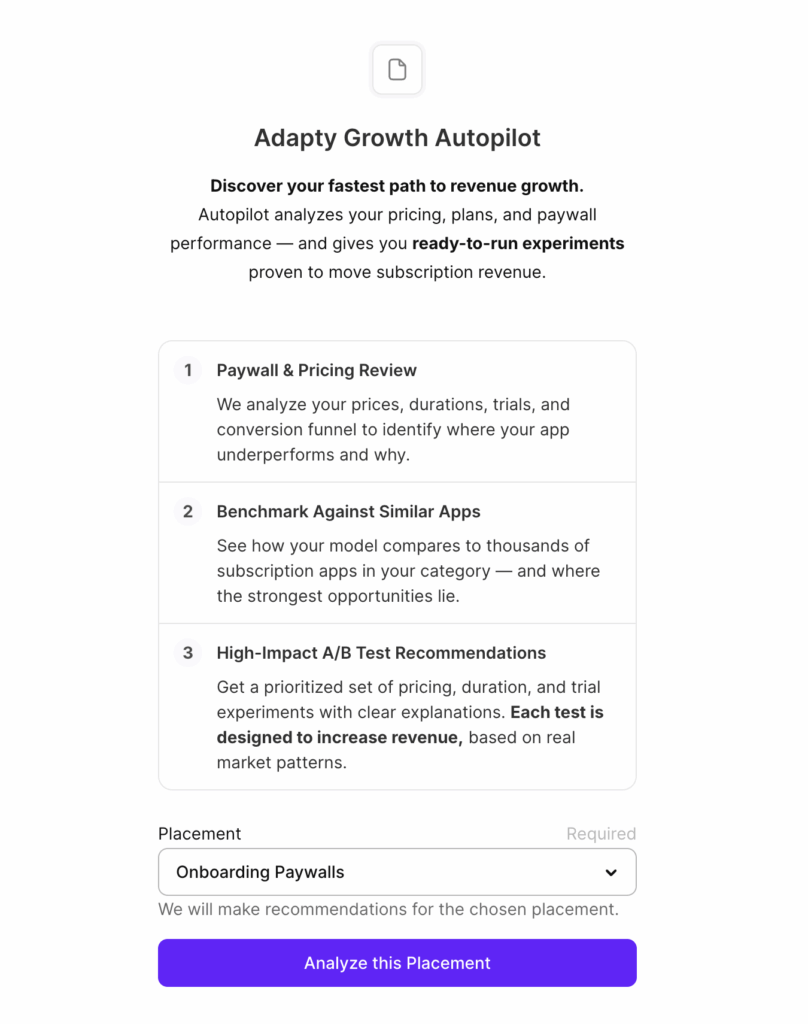
Adapty’s Growth Autopilot is built for exactly this kind of structured experimentation. It compares your paywall metrics against competitors and category benchmarks, identifies where you’re underperforming, and generates a sequenced growth plan — each step is an A/B test, with later stages building on earlier results.
What top apps are testing in 2026?
All of these patterns come from competitive audits of major apps in fitness, education, productivity, AI tools, and media. They’re showing up across growth roadmaps consistently enough to treat as the current baseline.
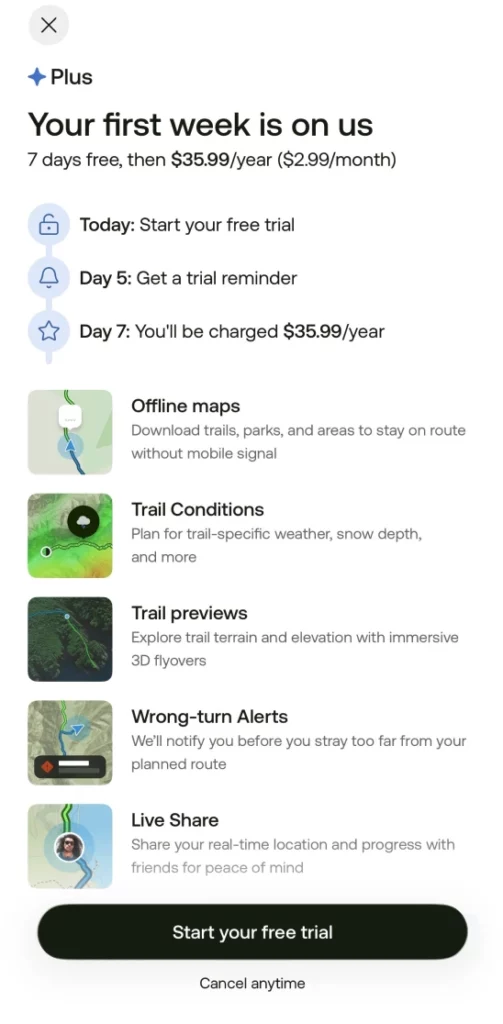
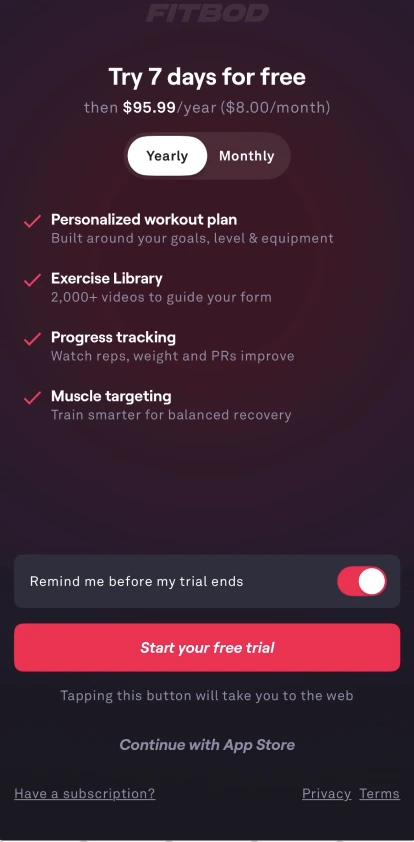
Annual-only trials
Moving the free trial exclusively to the annual plan — and dropping it from monthly — is one of the most consistent patterns in top-performing apps right now. The logic: it shifts purchase behavior toward the higher-value plan, increasing ARPU, while the trial still serves its core function of reducing commitment anxiety for users who need it.
This might seem to contradict the earlier finding that trials hurt LTV in some categories. Monthly trials tend to subsidize your least valuable subscribers. Annual trials don’t — the commitment barrier is high enough that trial users who convert tend to stay. Apps still offering trials on monthly plans are effectively creating a low-friction path to their least profitable subscribers.
Shorter trials
The shift from 14-day or 30-day trials to 7-day (or even 3-day) trials is appearing across nearly every category. The data supports it: shorter trials push faster activation-to-pay decisions, and users who need more than a week to decide whether a product is valuable tend to have higher churn regardless. A shorter trial doesn’t cost you the users you want to keep — it just removes the ones who were never going to stay.
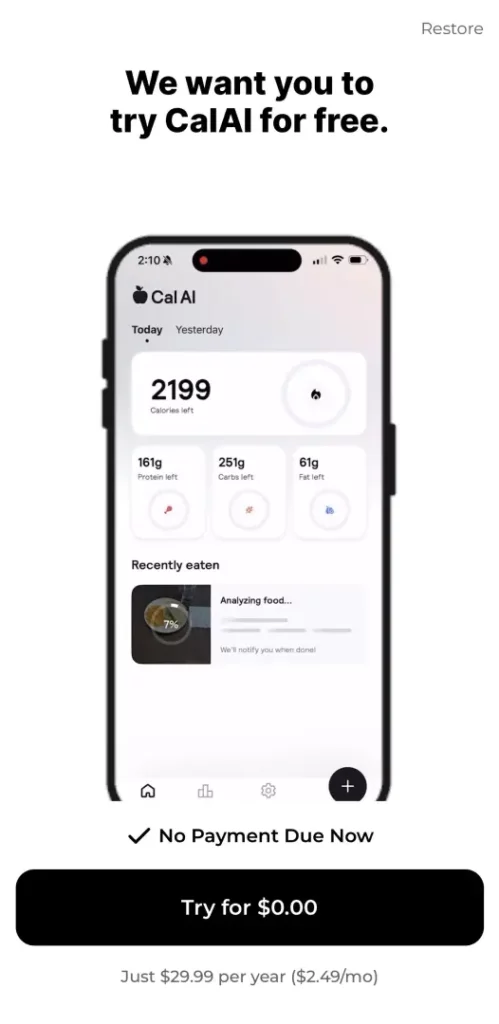
Personalized plan loaders
Adding a loading screen between the final onboarding question and the paywall — “Analyzing your preferences, building your plan…” — with social proof elements while it loads has become table stakes in top-performing onboarding flows. It serves two functions simultaneously: it makes the personalization feel earned (users feel the system did actual work for them), and the social proof at a high-attention moment reduces trust friction right before purchase.

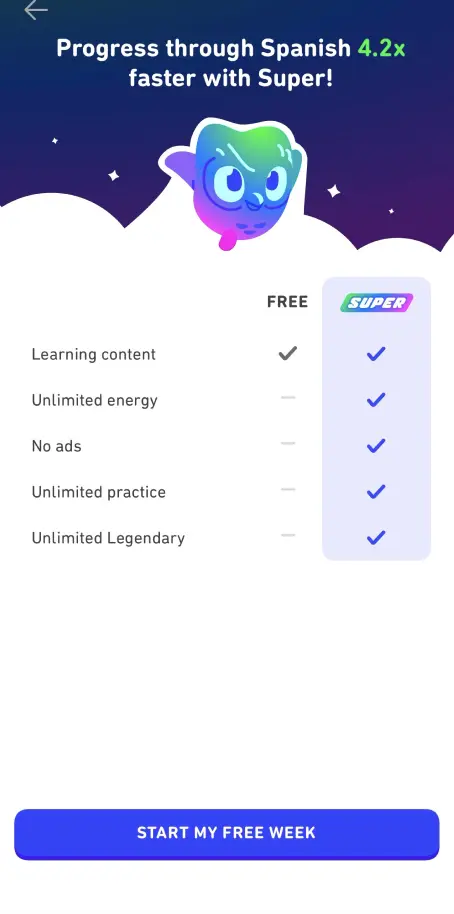
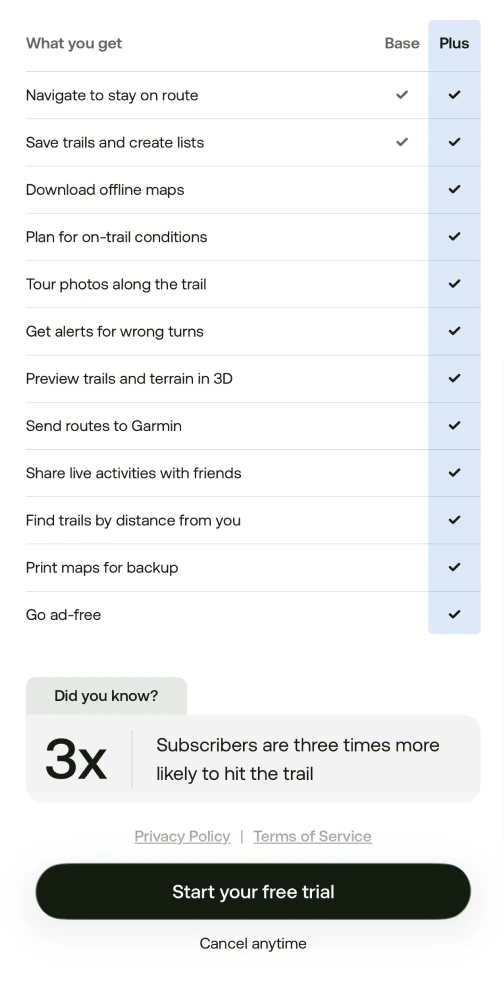
Comparison tables on the paywall
Free vs. Pro comparison tables are one of the most consistent paywall additions among top apps right now — appearing across fitness, education, productivity, design, and AI tools. The reason is straightforward: a significant percentage of users at the paywall still don’t fully understand what they’re paying for. A clear, scannable comparison removes the “what do I actually get?” objection without requiring the user to leave the paywall to find out. Apps that bury feature information in a long text list are asking users to do work they won’t do.
Post-paywall welcome offers
Covered in the discounts section above, but worth repeating as a 2026 trend. Post-close welcome offers are now common across every major category. The pattern is consistent enough that not having one is the unusual choice. The implementation is simple — a banner or screen that appears after the onboarding paywall is dismissed, offering a 24-hour discounted annual plan. The targeting precision is what makes it work: only users who showed intent but didn’t convert see it. Everyone else paid full price.

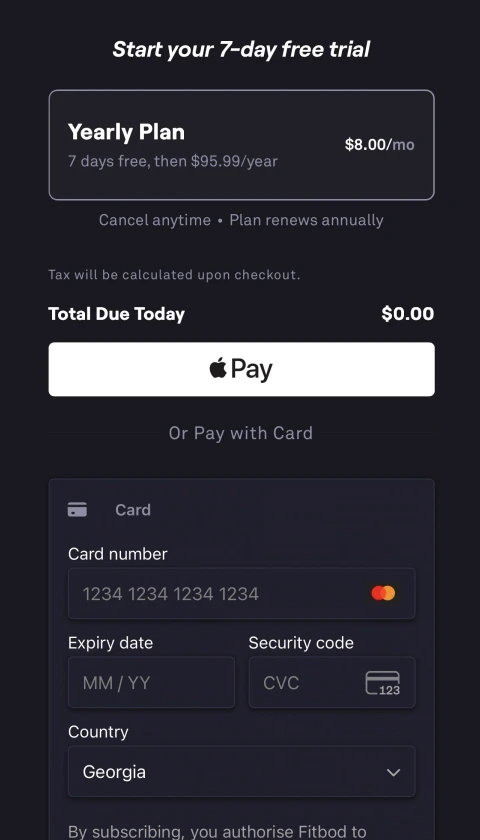
Web checkout testing
Web checkout testing has picked up significantly. The data is nuanced: in-app paywalls still convert 45% better than web paywalls (1.60% vs 1.10%), and in-app LTV is $40.10 vs $35.80 for web — even accounting for the eliminated App Store commission, web LTV still comes out lower due to faster retention drop-off after Month 1.
But web checkout unlocks access to Android users at scale and to web-to-app funnels, which have become one of the dominant acquisition strategies. For apps in Lifestyle, Entertainment, and AI tools in particular, the web channel is worth testing in 2026 — not as a replacement for in-app, but as a parallel acquisition path with different economics.
AI apps: a different playbook
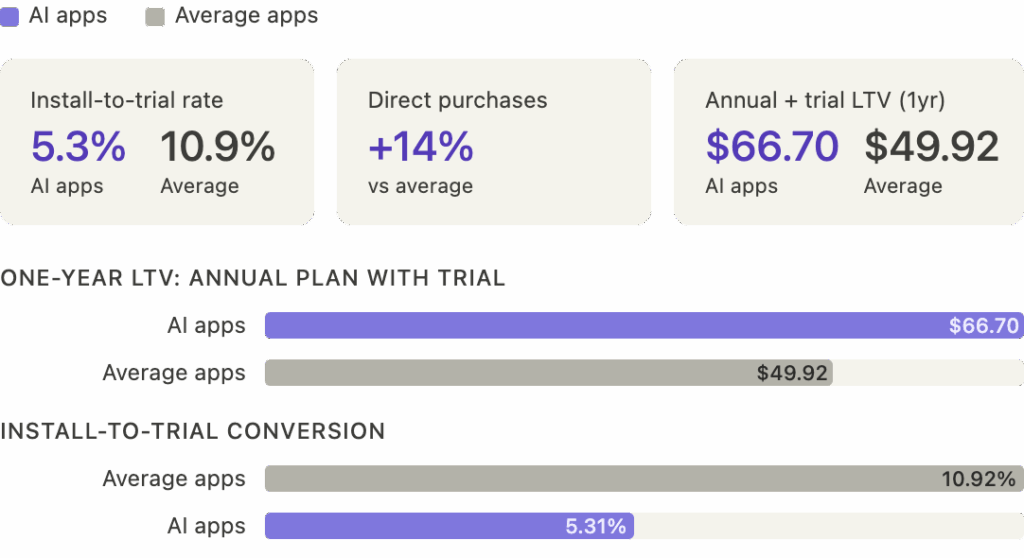
AI-powered apps deserve a separate note. They convert into trial at roughly half the rate of average apps (5.31% vs 10.92% install-to-trial), but get 14% more direct purchases. Where they pull ahead: annual plans with trials generate $66.70 one-year LTV vs $49.92 for average apps. AI apps charge more, churn faster, and still come out ahead on LTV.
The 2025 revenue growth numbers are striking: Lifestyle AI apps grew 691% YoY, Graphics & Design AI apps 202%, Utilities 174%. The pricing expectations for AI features are genuinely different from traditional subscription apps, and the paywall strategy should reflect that — higher price points, annual-first, trial on annual only.
Paywall audit checklist
Before running any tests, work through these questions honestly. Most teams find at least two or three they’ve never explicitly answered.
Plan structure
- Do you offer a weekly plan? If not, have you tested one against your current setup?
- Is your trial attached to the annual plan only, or available on a monthly basis too?
- When did you last test a different plan combination (e.g., weekly + annual vs. monthly + annual)?
Trial setup
- Have you compared the 12-month LTV of trial converters vs. direct buyers in your category?
- Is your trial length 7 days or shorter? If longer, have you tested shortening it?
- Do you offer a trial-end reminder to reduce cancellation anxiety?
Placement & onboarding
- Does your paywall appear after onboarding, not before users have experienced product value?
- Do you have a personalized plan loader or progress screen before the paywall?
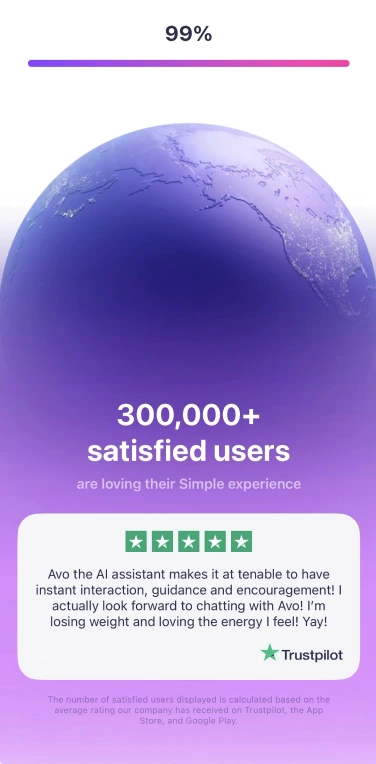
- Is there social proof (ratings, testimonials, user count) visible before or on the paywall?
Paywall design
- Is there a Free vs. Pro comparison table on the paywall?
- Is the paywall hard or soft — and have you tested the alternative?
- Does the paywall fit on a single screen without scrolling?
Pricing & discounts
- Have you tested a price increase in the last 12 months?
- Do you have region-specific pricing for at least Europe and APAC?
- Do you show a post-paywall-close welcome offer to non-converters?
- Is your main paywall at full price, with discounts reserved for the post-close offer only?
Experimentation
- How many paywall experiments have you run in the last 12 months?
- Is your last test structural (plan, trial, duration, localization) rather than visual?
- Can you publish paywall changes without an app release?
The revenue gap between those apps and the ones treating paywall setup as a testable system is up to 40x
The State of in-app subscriptions 2026 report covers LTV by category and region, conversion benchmarks by plan type and trial setup, pricing data across 22 countries, paywall performance by placement and gate type, and experiment win rates by test type. It’s based on $3B in subscription revenue across 16,000+ apps, and you can benchmark your own app directly in the interactive version.
If you’re ready to run the tests: Adapty’s A/B testing tools let you test paywall structure, plan combinations, trial length, and pricing without app store releases. The Paywall Builder and Onboarding Builder let you build, iterate, and publish instantly. Growth Autopilot takes the guesswork out of what to test next — it benchmarks your paywall against competitors and category averages, identifies where you’re underperforming, and builds a sequenced growth plan where each step is a ready-to-run A/B test.
Most apps will keep running the same paywall they launched with, tweaking headlines, and wondering why conversion hasn’t moved. The ones treating paywall setup as a structural, testable system — and running 14+ experiments a year — are the ones the revenue data reflects.