TL;DR
- Health & Fitness has the highest install LTV of any app category — $1.21 per install globally.
- It’s also the only category where annual plans are not just dominant but growing their revenue share year over year.
- Trials work here. For annual subscriptions, they boost LTV meaningfully — unlike Productivity or Lifestyle, where direct buyers are worth more.
- Annual plan pricing gaps across countries can reach 4.4x (Germany vs Turkey). If you’re charging everyone the same, you’re underpricing half your market.
- The top 10% of Health & Fitness apps capture 92.6% of all category revenue. That concentration is actually lower than most categories — there’s still room to compete.
- Users either convert on Day 0 or between Days 4–7. There’s almost nothing in between. Build your paywall strategy around that.
Health & Fitness is one of the best categories to monetize — if you know the rules
Health & Fitness sits at an interesting crossroads. On one hand, it has the highest install LTV of any app category in the App Store. On the other hand, it follows monetization patterns that don’t match conventional mobile wisdom — and if you’re applying playbooks from Productivity or Lifestyle apps, you’re probably leaving real money on the table.
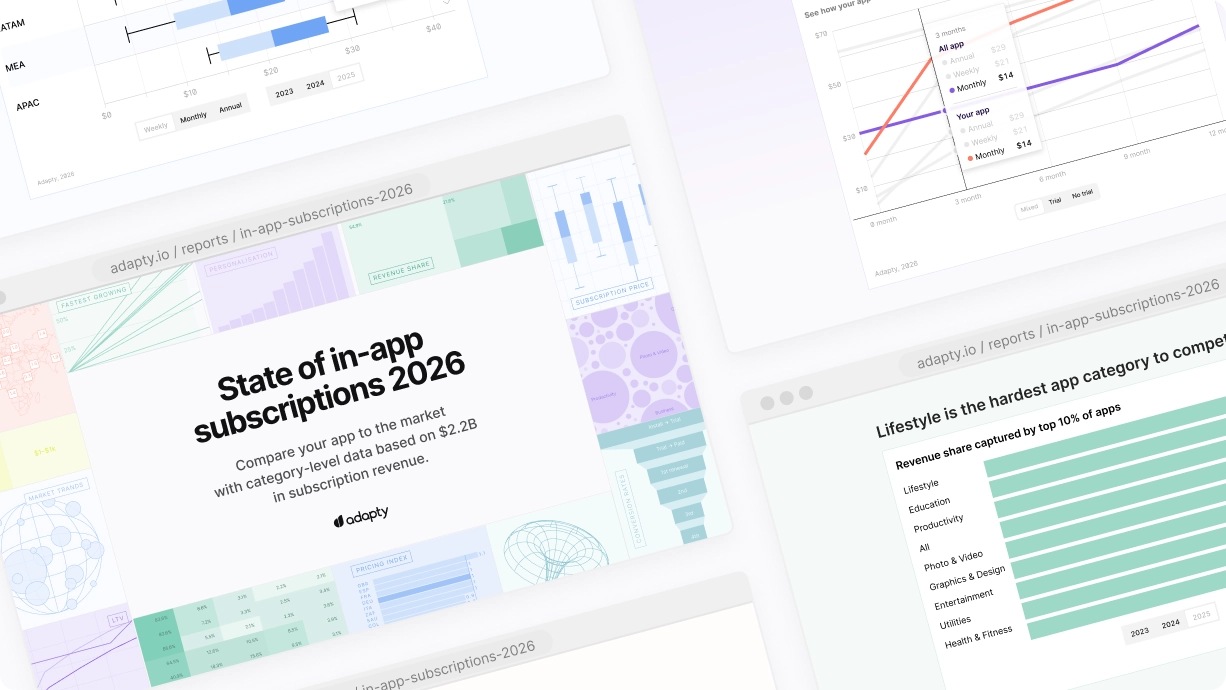
This benchmark report pulls from Adapty’s State of in-app subscriptions 2026, based on $3B in subscription revenue across 16,000+ apps. The data covers pricing, conversion, retention, LTV, and paywall strategy — filtered specifically for Health & Fitness where available.
Here’s how your app compares to the market, and what the numbers actually mean for your monetization decisions.
Health & Fitness leads all categories in install LTV
Install LTV measures how much revenue a new install generates over 12 months, accounting for both conversion rates and per-user revenue. It’s the clearest single number for how well your category monetizes traffic.
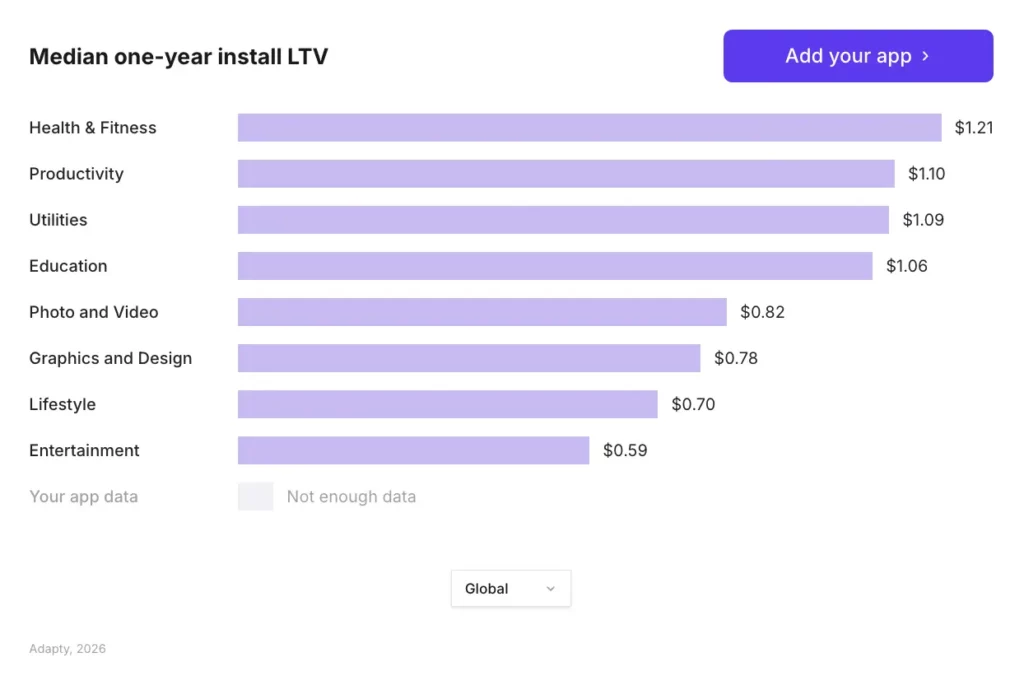
The gap between Health & Fitness and Entertainment — the lowest-performing category — is more than 2x. That’s not a rounding error. It reflects genuine user intent: someone downloading a fitness app is already motivated to commit, which translates into higher conversion and stronger retention.
In North America specifically, the install LTV is roughly 2x the global average across most categories. If your user base skews US/Canada, your actual numbers should be significantly above the benchmarks here.
Where trials fit into the LTV picture
The SOIS 2026 data makes a clear distinction between categories where trials help and categories where they don’t. Health & Fitness lands firmly in the “trials help” column — specifically for annual subscriptions.
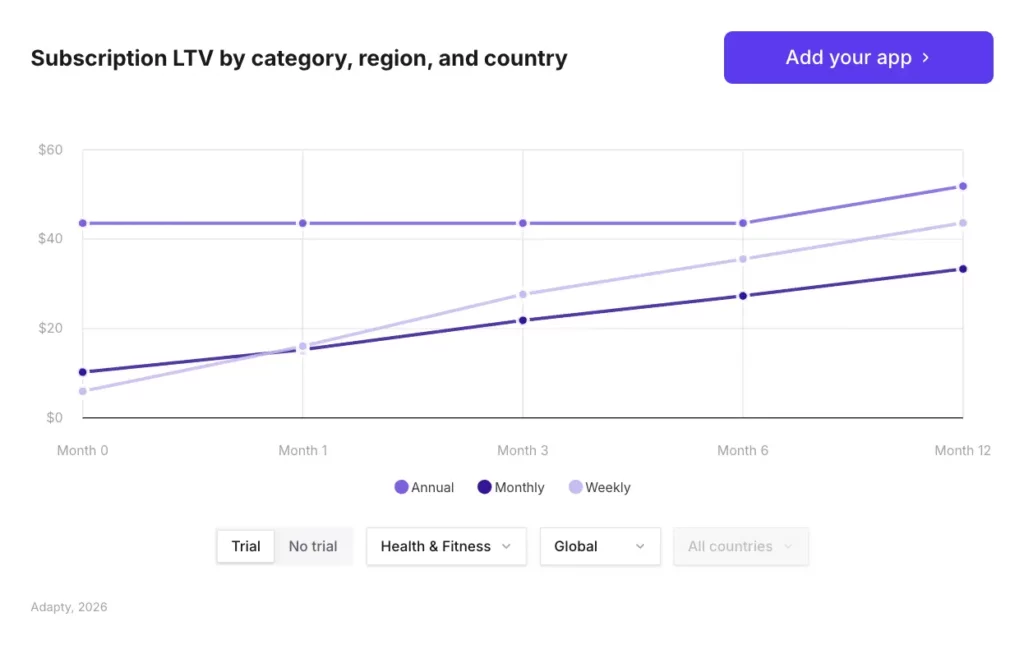
For annual subscribers who start with a trial, LTV is higher than for direct buyers in Health & Fitness.
Compare this to Productivity, where direct buyers generate $56.95 vs $49.13 for trial users — a meaningful gap in the other direction. In Lifestyle, trial users end up 21% less valuable than direct buyers. Health & Fitness behaves differently because of the user’s relationship with the product: fitness goals are inherently long-horizon, and a trial gives users time to build the habit that makes them want to stay.
Pricing: the 4.4x gap you probably aren’t using
Health & Fitness has the widest annual plan pricing gap of any category in the dataset. Germany charges 4.4x more than Turkey for the same annual subscription.
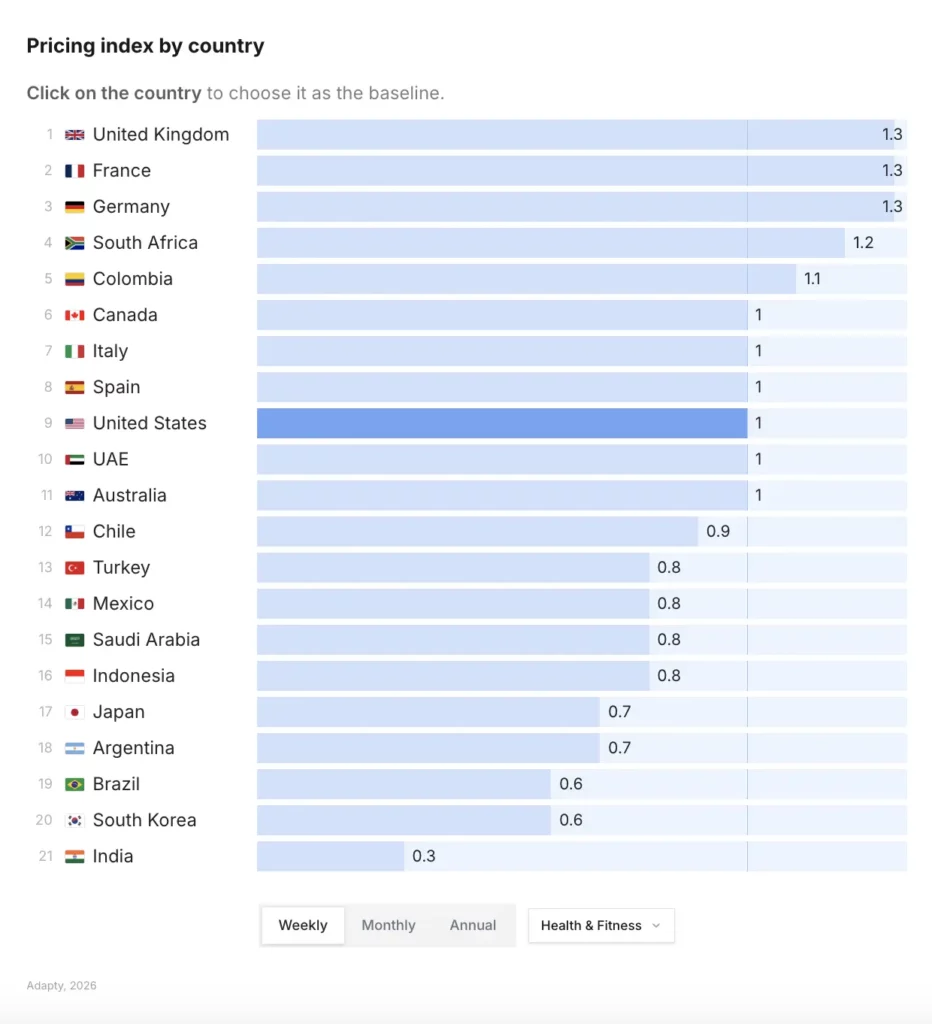
The practical implication: if you’re running a single global price, you’re almost certainly overpricing emerging markets (and getting churned out) while underpricing high-willingness-to-pay markets like Germany, Japan, and Switzerland.
High-priced apps earn dramatically more — even in this category
Across the full dataset, high-priced apps (top 25% by price in their category) earn 3x the LTV of low-priced apps. In Health & Fitness specifically, the effect is even stronger:
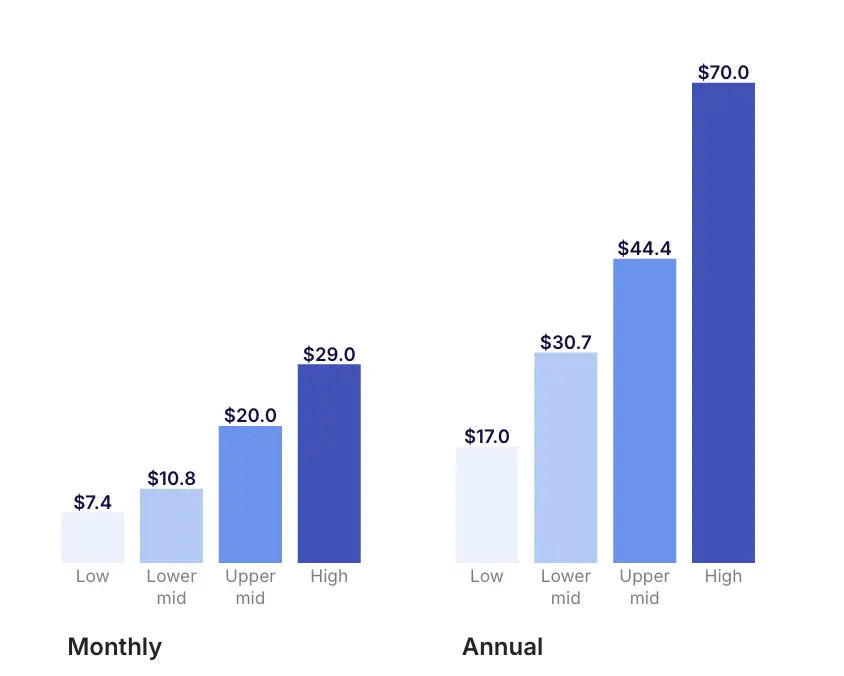
This doesn’t mean you should blindly raise prices. It means that if you’re in the bottom 25% on pricing in your niche, you’re probably not just leaving money on the table — you may be actively attracting the wrong users. Price acts as a quality filter. Users who convert at $79.99/year have fundamentally different retention than users who convert at $19.99/year.
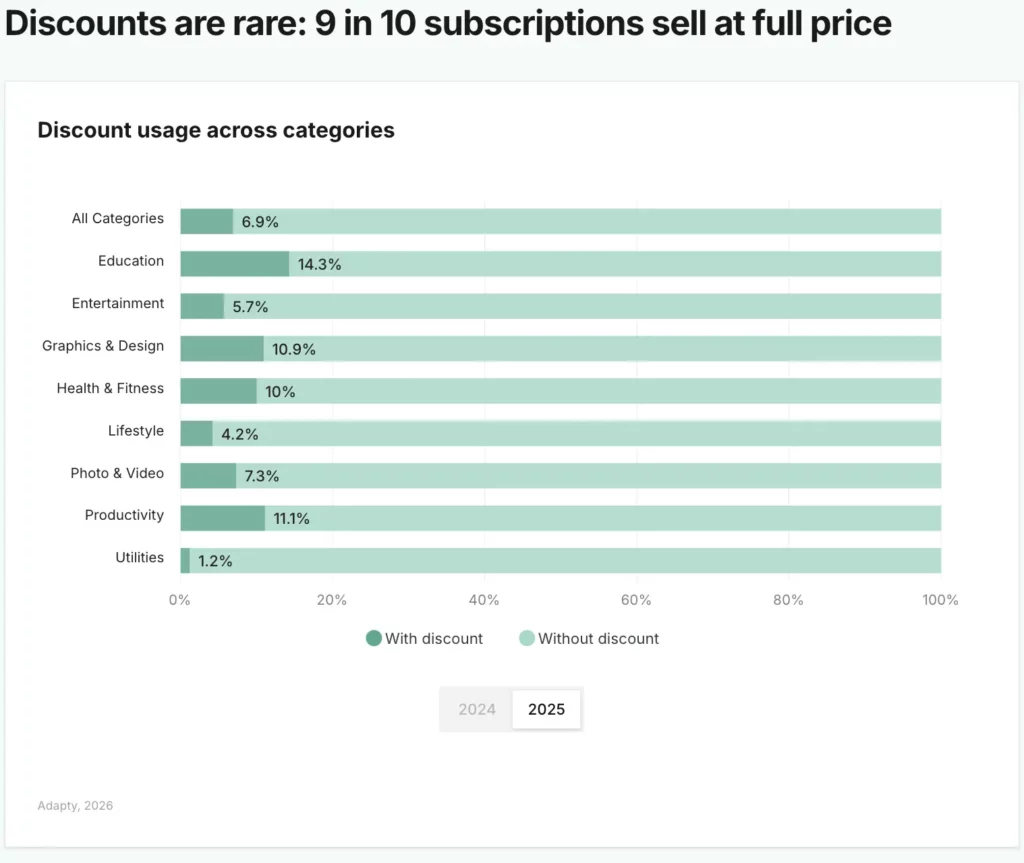
What about discounts?
Only about 10% of apps across all categories use discounts. Health & Fitness follows this pattern. The data doesn’t break out discount usage specifically for the category, but the broader signal is clear: the vast majority of subscriptions sell at full price. Discounts work best when they’re timed to a decision point — a cancellation flow, a win-back sequence, a seasonal push. Outside of those contexts, they don’t add much.
Annual plans dominate Health & Fitness — and they’re growing
This is the single most distinctive thing about Health & Fitness monetization. Across the broader app market, weekly subscriptions now generate 56% of all subscription revenue. Weekly plans have been eating annual plans’ share for two years running.
Health & Fitness is the exception.
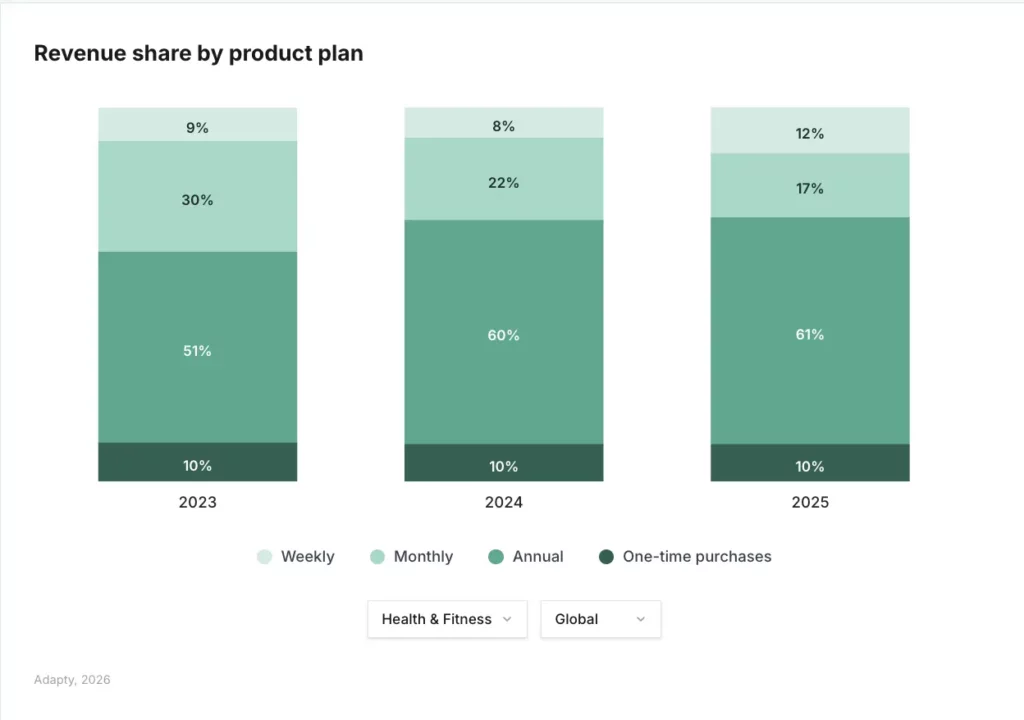
Why? Fitness goals are annual in nature. New Year’s resolutions, marathon training cycles, 90-day transformation programs — users in this category are already thinking in longer timeframes when they download your app. The conversion to annual isn’t a hard sell. It’s aligned with how they’re already thinking about the product.
This has real implications for paywall design. The conventional wisdom of “lead with weekly to lower friction, then upsell” may be exactly backwards in Health & Fitness. Leading with annual — with the right framing and trial — likely converts better than the data from other categories would suggest.
Weekly plans still have a role, but it’s different here
Across the full dataset, weekly plans with trials produce the highest 12-month LTV of any paywall configuration — and LTV grows from $7.40 to $54.50 over the year when a trial is added. That’s a compelling data point for most categories.
In Health & Fitness, though, annual’s dominance means your primary monetization engine is almost certainly your annual plan. Weekly plans work as an entry point for users who aren’t ready to commit — but they shouldn’t be your main event.
Conversion in Health & Fitness: the Day 0 / Day 4-7 split
Across all categories, 90% of trial starts happen on Day 0 — users decide their first session or not at all. Health & Fitness follows this pattern but with a notable secondary peak.
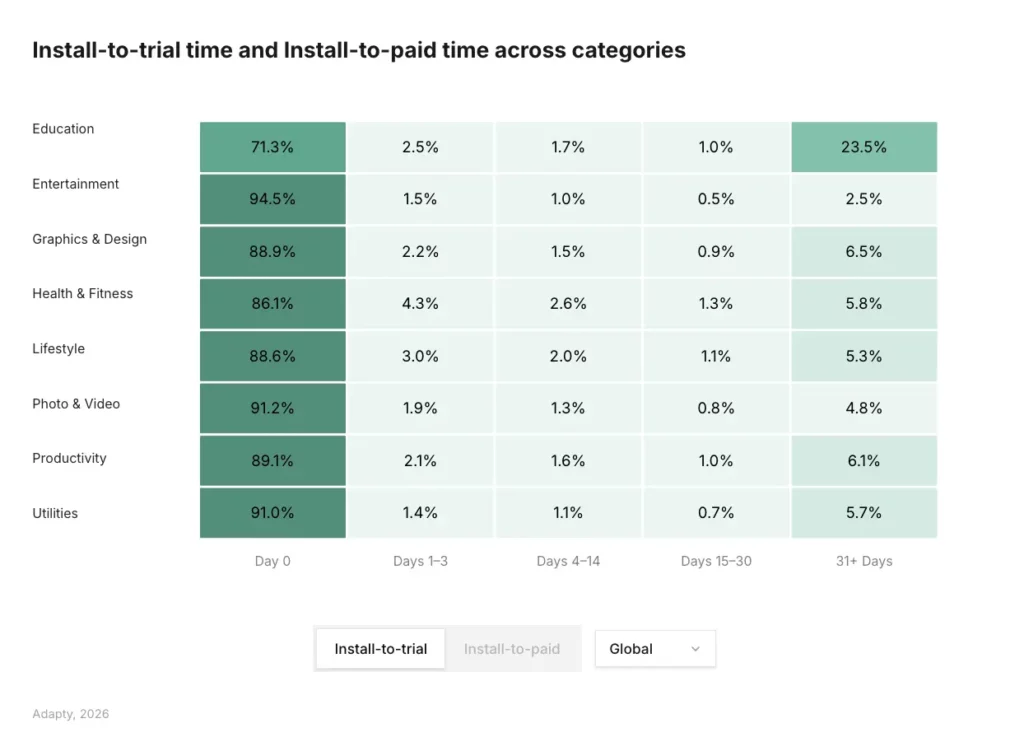
This bifurcation is meaningful. It tells you there are two distinct user behaviors to design for:
- Day 0 converters: users who arrive motivated and need minimal convincing. Your paywall’s job here is to not get in the way. Clear value proposition, low friction, prominent trial CTA.
- Day 4-7 converters: users who engaged with the app, experienced some value, and are now ready to commit. These users respond to re-engagement that ties back to what they’ve already done in the app — progress, streaks, goal proximity.
The Days 1-3 gap suggests that mid-week nudges and generic push notifications don’t work well in this category. Users need enough time to experience the product meaningfully before they’re ready to decide. Rushing the paywall into Days 1-3 likely has near-zero ROI.
Global conversion benchmarks
The full SOIS 2026 dataset provides these baseline conversion numbers across all categories. Use them as a starting point for where Health & Fitness should sit:
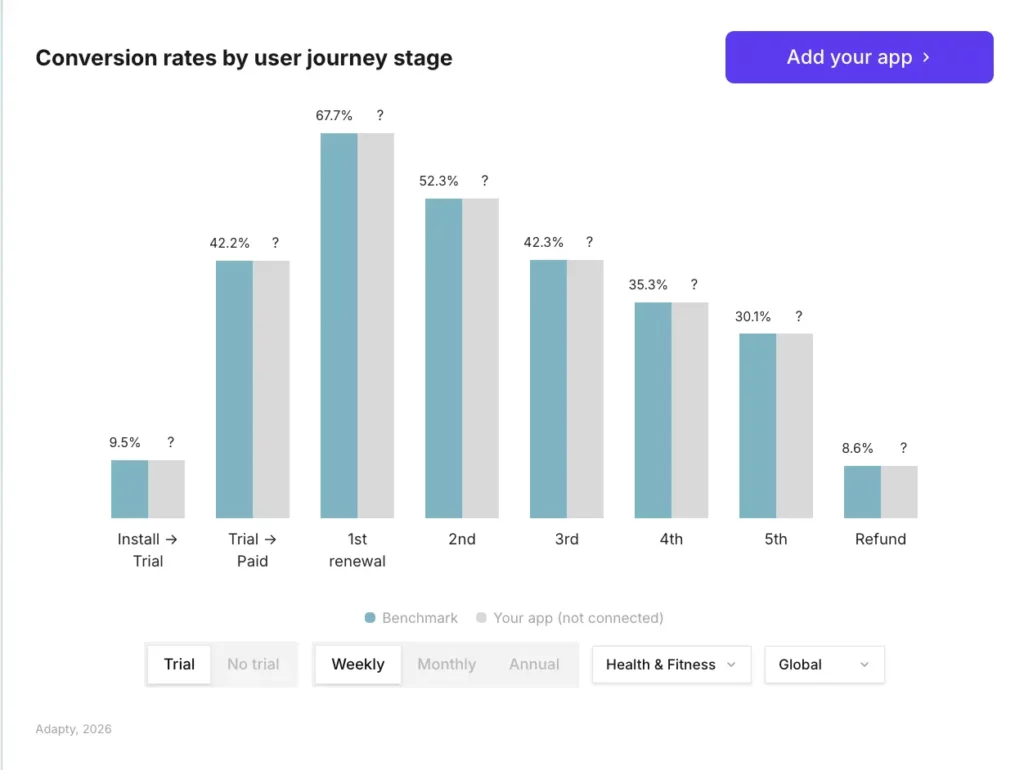
North American users consistently outperform global averages. Install-to-trial in North America runs at 14.5%, compared to 7.6-10.2% in other regions. If your Health & Fitness app is US-heavy, your install-to-trial benchmark should be meaningfully above the 11.2% global figure.
Trials boost first-renewal rates significantly
Trial users across all categories retain 8-60% better at first renewal than non-trial users, with the biggest gains on weekly plans. In categories where trials work well — and Health & Fitness is one of them — this makes trial strategy one of the highest-leverage decisions in your paywall setup.
The mechanism is simple: a trial user who chooses to stay has already decided the product is worth it. A direct buyer is making that judgment on day one with much less information. Health & Fitness benefits from this more than most categories because the product value (habit formation, visible progress, goal completion) takes time to demonstrate.
Retention: what the renewal curves tell you
Retention data from SOIS 2026 shows that annual plan users in Utilities lead all categories at 22.1% one-year retention. Health & Fitness doesn’t top this particular ranking, but annual plan dominance in the category means retention is still structurally strong — users who commit to a year have already passed the most critical churn point.
The broader retention pattern across all categories shows a consistent drop-off shape:
| Renewal | Global Average Retention |
|---|---|
| 1st Renewal | 59.2% |
| 2nd Renewal | 45.1% |
| 3rd Renewal | 37.1% |
| 4th Renewal | 31.6% |
| 5th Renewal | 27.6% |
For annual Health & Fitness subscribers, each “renewal” represents a full year. Getting a user to their second annual renewal — roughly 24 months in — is the point where churn stabilizes significantly and LTV compounds. This is the retention milestone worth building toward.
Price sensitivity at renewal
The data shows that for weekly plans, higher-priced apps actually retain 12% better at first renewal. Users who paid more have a stronger commitment. For annual plans in Health & Fitness, this effect matters at renewal time: users who subscribed at a premium price point are less likely to churn than users who subscribed via a deep discount.
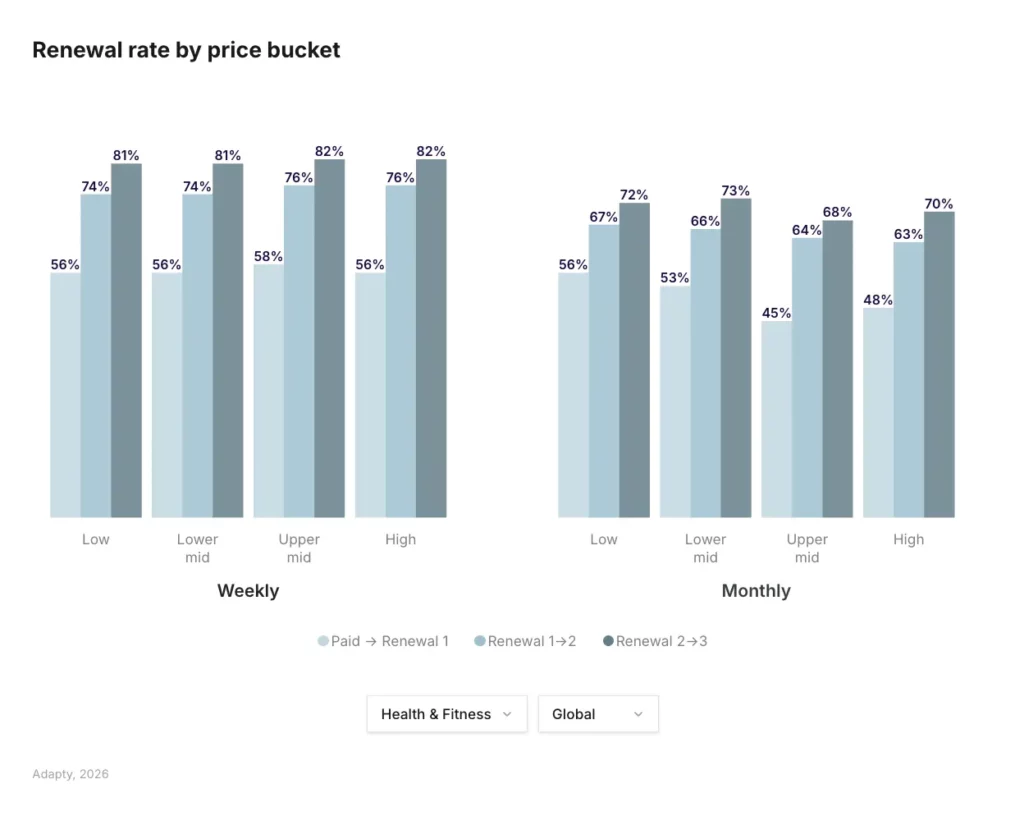
This is another argument against over-relying on discount-driven acquisition. Users who win on price are typically the first to leave when renewal comes.
Paywall setup: what the experiment’s data shows
The SOIS 2026 paywalls section covers experiment outcomes across thousands of A/B tests. A few findings are directly applicable to Health & Fitness:
Onboarding paywalls with trials convert best
Across all categories, onboarding paywalls with trials produce the highest install-to-paid conversion at 1.78% on average. For Health & Fitness — where the Day 0 / Day 4-7 conversion split is so pronounced — this means getting your paywall placement right in onboarding is critical. Users who encounter a well-timed paywall with a trial offer during onboarding are most likely to start the trial that eventually converts.
Hard paywalls produce 21% higher LTV
Hard paywalls (full gates, no free access) produce 21% higher LTV than soft paywalls. The mechanism is selection: hard paywalls filter out uncommitted users and attract higher-intent subscribers. The trade-off is lower volume — soft paywalls convert nearly 50% better on raw conversion rate.
The choice isn’t obvious. For Health & Fitness apps with strong organic acquisition and a clear value proposition, a hard paywall with a free trial can outperform soft paywalls on LTV. For apps that depend on virality or word-of-mouth, restricting the free experience may hurt growth more than it helps revenue.
What’s worth testing on your paywall?
| Experiment Type | % Tests with LTV uplift | % Tests with CR uplift |
|---|---|---|
| Localization | 62.3% | 44.9% |
| Number of plans | 57.1% | 46.1% |
| Plan duration | 58.7% | 37.8% |
| Trial changes | 59.6% | 39.9% |
| Price changes | 45.5% | 28.3% |
| Visual / Copy only | 34.6% | 31.4% |
Visual and copy-only tests have the lowest win rate of any experiment type — 34.6% for LTV, 31.4% for conversion. If you’re running paywall A/B tests and primarily changing layouts and headlines, you’re testing the wrong things.
The highest-impact tests are localization (62.3% LTV win rate), trial structure (59.6%), and plan duration (58.7%). For Health & Fitness specifically, testing whether to lead with annual vs. weekly, and testing trial length, will almost certainly produce larger lifts than redesigning your paywall UI.
Apps that experiment consistently earn dramatically more
Teams that run experiments regularly can earn up to 40x more revenue than those that don’t. The average number of experiments per active tester in the dataset is 14.7 — these are teams that treat monetization as an ongoing iteration loop, not a one-time setup decision.
Where Health & Fitness sits in the broader market
Revenue concentration is lower than in most categories
The top 10% of apps across all categories capture 94.5% of all subscription revenue. In Health & Fitness, that figure is 92.6% — which still sounds brutal, but it’s actually one of the lower concentration rates in the dataset, alongside Utilities.
| Category | Revenue share (Top 10%) |
|---|---|
| Lifestyle | 97.9% |
| Education | 96.0% |
| Productivity | 95.6% |
| Photo & Video | 94.6% |
| Graphics & Design | 94.6% |
| All Categories | 94.5% |
| Entertainment | 94.0% |
| Health & Fitness | 92.6% |
| Utilities | 92.6% |
Lower concentration means more revenue is distributed across mid-tier and growing apps. Health & Fitness is one of the more penetrable top categories in the App Store from a competitive standpoint — you don’t need to be a dominant player to build meaningful revenue.
The new app problem
Across all categories, 31% more subscription apps were launched in 2025 than in 2024, while the median monthly revenue per new app dropped 22%. Newer apps earn roughly 25% less at the median than apps launched a few years ago.
This isn’t unique to Health & Fitness, but it matters here: the category’s strong install LTV makes it attractive to new entrants. More competition, lower average revenue per new app, and rising user acquisition costs are the market conditions you’re operating in. Strong monetization fundamentals — pricing, trial strategy, paywall placement — matter more now than they did two years ago.
Applying the benchmarks: a practical checklist
Based on the SOIS 2026 data, here’s where Health & Fitness developers and growth teams should focus:
On pricing
- Run localized pricing — it’s the highest-LTV-win-rate experiment type in the dataset (62.3%). Germany vs Turkey alone is a 4.4x price gap opportunity.
- If you’re in the bottom 25% of prices in your Health & Fitness niche, test moving up. High-priced annual plans earn 4.5x more per user than cheap ones.
- Stop defaulting to discounts. Nine in ten subscriptions in the app market sell at full price for a reason.
On plan structure
- Annual should be your lead offer. This is the only category where annual plans are growing their revenue share. Design your paywall around the annual first.
- Use weekly as a fallback entry point, not your primary plan. Users who aren’t ready for annual can start weekly, but don’t let weekly become the default.
- Test adding a trial to your annual plan if you haven’t already. In Health & Fitness, trials boost LTV for annual subscribers — the opposite of what happens in Productivity.
On conversion and paywall timing
- Build two conversion paths: an immediate Day 0 path for motivated users, and a re-engagement path that triggers on Days 4–7. Don’t invest heavily in Days 1–3 nudges — the data suggests they don’t convert.
- Put your paywall in onboarding with a trial. Onboarding paywalls with trials convert at 1.78% on average — the highest of any placement.
- If you’re currently running only visual/copy A/B tests, switch to testing trial length, number of plans, and plan duration. These have 2x the LTV win rate of visual-only changes.
On retention
- The 24-month mark (two annual renewals) is your key retention milestone. Users who reach it churn at much lower rates. Design your product and communication strategy around getting users there.
- Don’t acquire users primarily via discounts. Discount-acquired users have lower commitment and churn faster at renewal.
Data source
All benchmarks in this article are drawn from Adapty’s State of In-App Subscriptions 2026 report, based on data from 16,000+ apps processing over $3B in subscription revenue. The full interactive report — filterable by category, region, and plan type — is available here.