In-app subscription benchmarks for Graphics & Design apps
TL;DR:
- Graphics & Design direct buyers out-earn trial users — one of only four categories in the report where trials hurt LTV instead of helping it
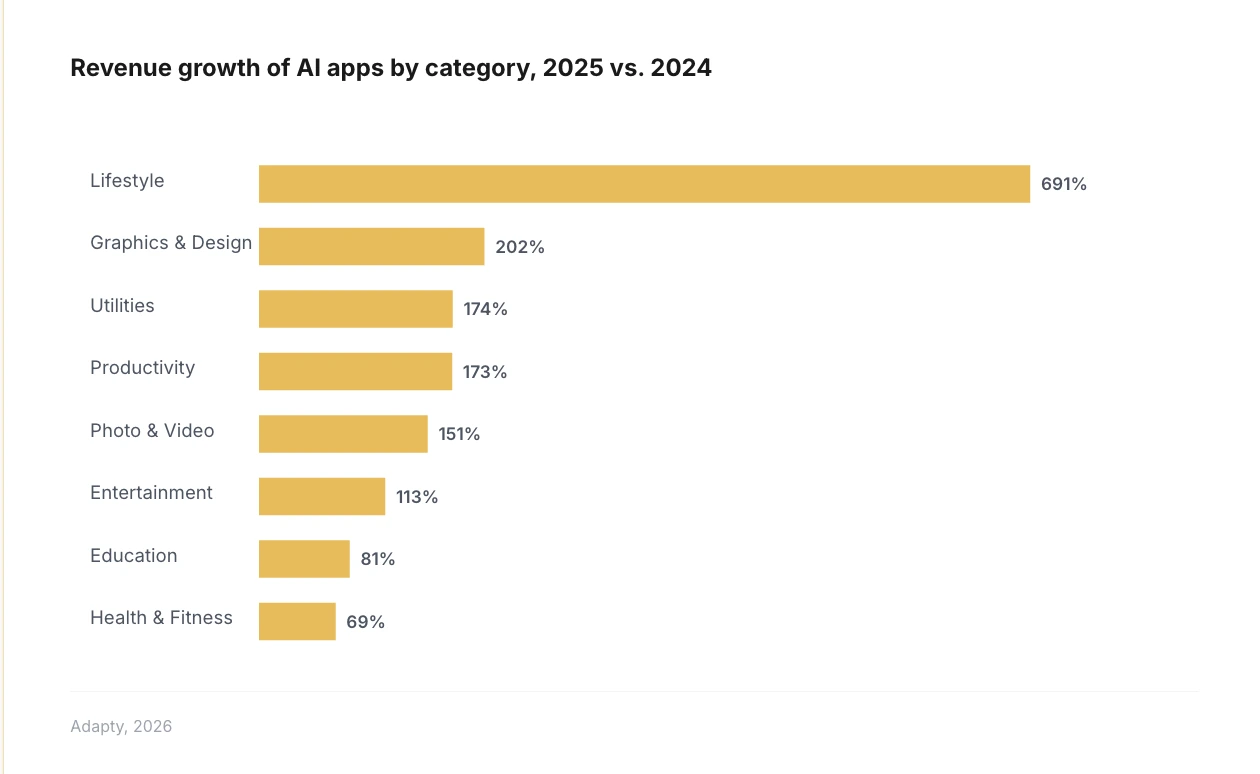
- AI Graphics & Design apps grew revenue 202% YoY in 2025 — the second fastest of any category, behind only Lifestyle AI at 691%
- Install LTV for Graphics & Design sits at $0.78 — below every category except Lifestyle and Entertainment, making acquisition economics tighter than the market average
- The top 10% of apps capture 94.6% of revenue in Graphics & Design — in line with the market, but the AI boom is reshaping who the top 10% are
- European subscription prices overtook North America in 2025, and creative tools priced for North American willingness to pay are leaving money in Europe
Graphics & Design is the category the SOIS 2026 report flags twice for opposite reasons.
On one hand, it posts the second-highest AI revenue growth of any category — 202% year over year, behind only Lifestyle AI. On the other hand, its install LTV is near the bottom of the pack, and it sits in the small group of categories where trials actively reduce per-subscriber value instead of boosting it.
Those two facts are the story. Graphics & Design is a category where the old monetization reflexes from Photo & Video don't apply, and where the AI wave has changed the economics fast enough that most teams are still operating on stale playbooks. The State of in-app subscriptions benchmarks below are what the $3B dataset says about the category in 2025.
How does Graphics & Design LTV compare to other categories?
Graphics & Design apps generate a median install LTV of $0.78 over 12 months, sixth of eight categories in the report. Only Lifestyle ($0.70) and Entertainment ($0.59) sit below it. For context, Health & Fitness leads at $1.21, and Utilities clears $1.09.
The per-subscriber picture in Graphics & Design diverges sharply from the trial-first narrative that dominates most subscription content. In Graphics & Design, Productivity, Lifestyle, and Entertainment, direct buyers generate more 12-month LTV than trial subscribers. In Utilities, Health & Fitness, and Education, trials boost annual LTV. Graphics & Design belongs to the direct-purchase camp.
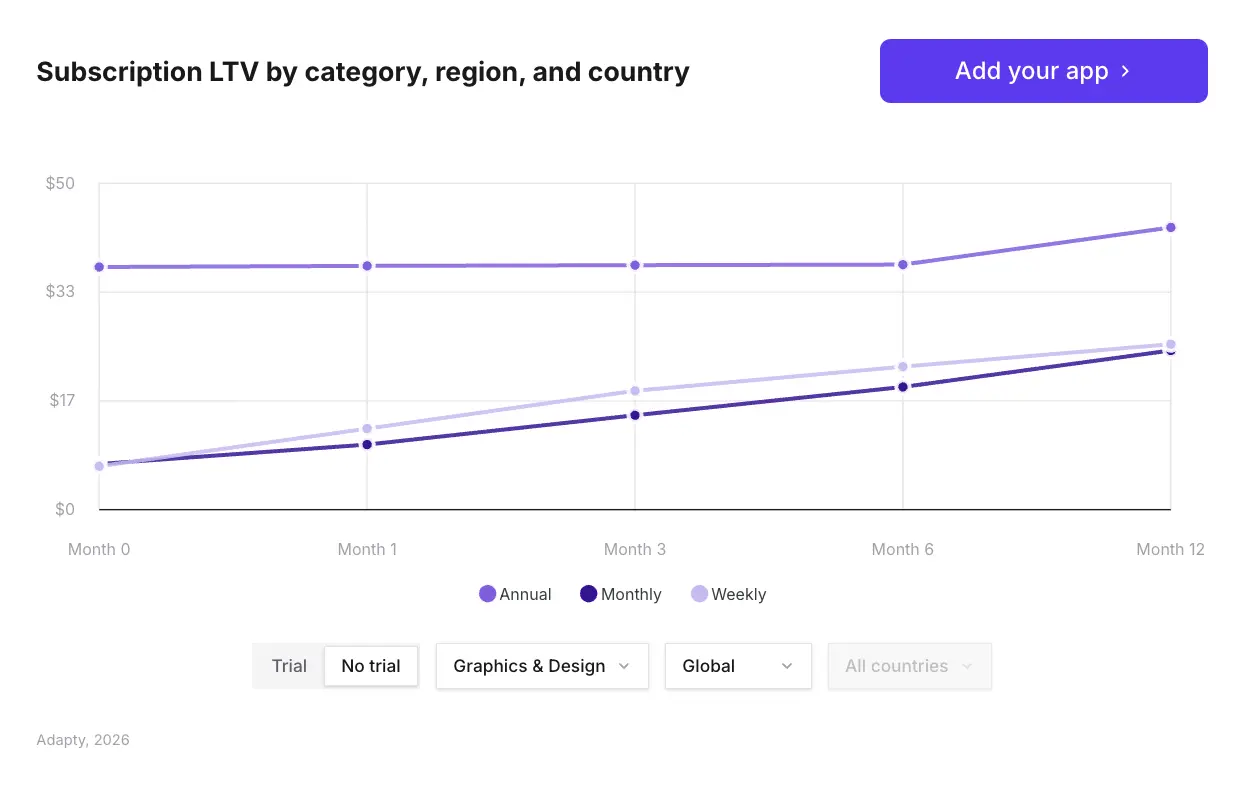
What that means for a Graphics & Design team running the default industry playbook: pushing trials harder is probably acquiring the wrong users. Sven Jürgens put it plainly in the SOIS report: "Always offer a free trial" is bad advice when the data in your category says otherwise. For a full breakdown of when trials help versus hurt across categories, see free trial vs. direct purchase: what $3B in app revenue says.
North American install LTV runs roughly 2x the global average across most categories. If your Graphics & Design app is already performing in the US, the LTV floor for your existing user base is higher than the global median suggests.
What do Graphics & Design apps charge — and how is pricing shifting?
The global median for weekly plans sits at $7.48, monthly at $12.99, and annual at $38.42. Those are all-category numbers. The SOIS 2026 data confirms three category-level patterns worth applying to Graphics & Design pricing decisions.
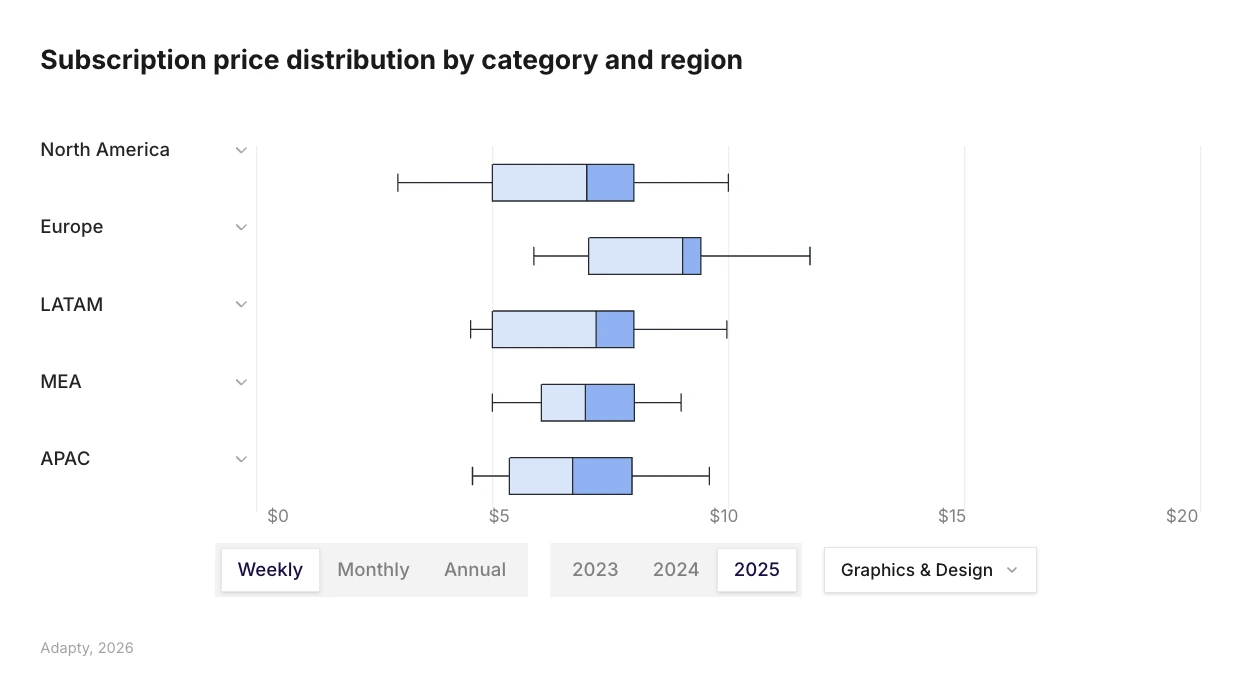
First, European subscription prices jumped 18% year over year in 2025, overtaking North America as the most expensive region on weekly, monthly, and annual plans. If your Graphics & Design app prices identically across regions, you are leaving measurable revenue on the table in Europe.
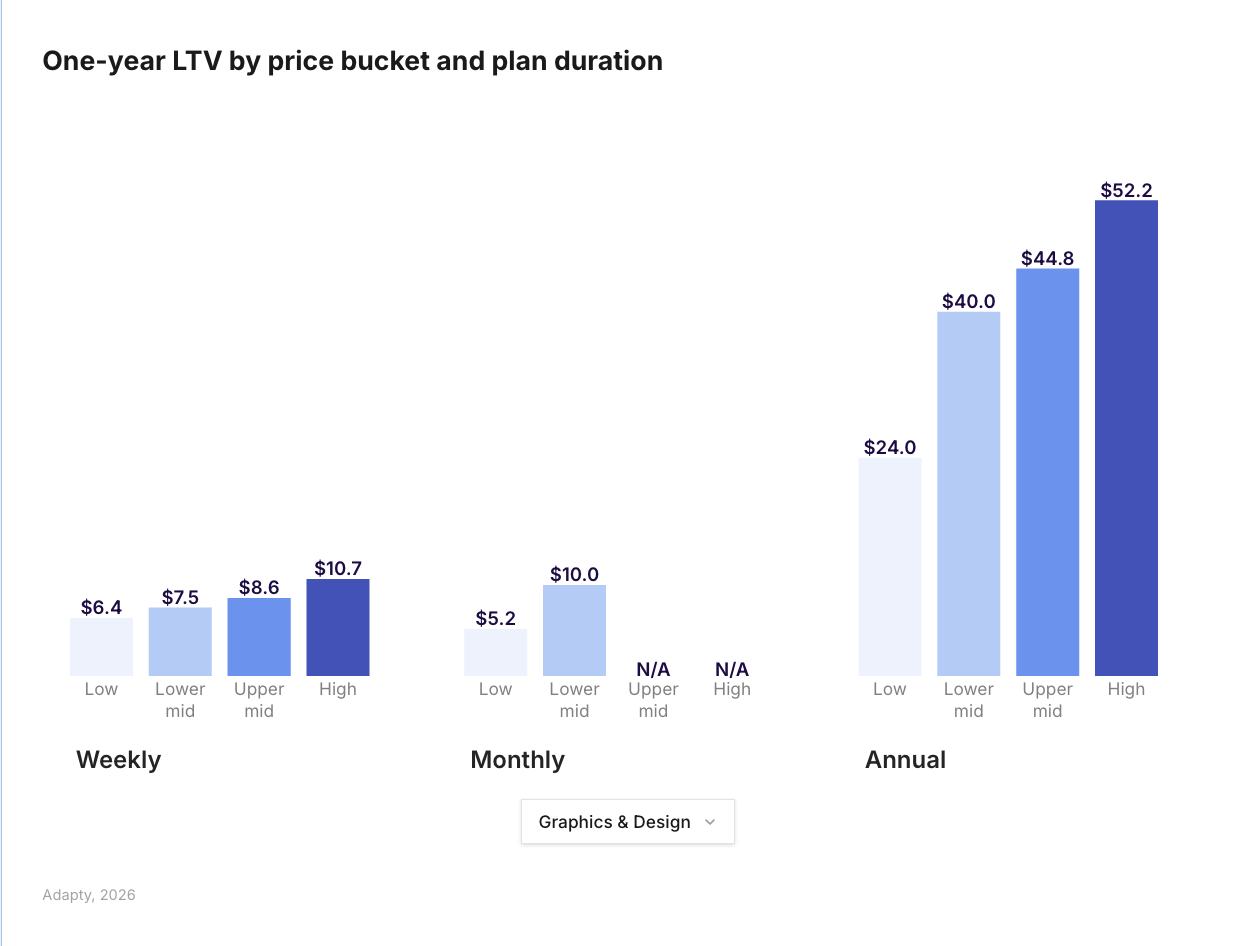
Second, high-priced apps out-earn low-priced apps by a factor of 3x on LTV across the market — and price alone is rarely what stops users from subscribing. Monthly plans are the most price-sensitive (conversion drops ~53% as prices move from low to mid range), but weekly plans show the opposite pattern: higher-priced weekly apps convert better into purchase than cheaper ones.
Third, discounts are rare and getting rarer. Nine in ten subscriptions across the market sell at full price. Only Education apps cross double digits on discount usage at 14.3%. In the creative-tools space, a discount strategy runs against the direction the category is moving.
Key pricing signal for Graphics & Design
The combination of direct-buyer dominance, AI-driven pricing flexibility (Phil Carter's analysis in the SOIS report flags AI subscription apps as needing higher ARPU to offset LLM costs), and European price ceiling rising creates a specific pricing directive: test higher prices in Europe, and test direct-purchase paywalls against trial paywalls before defaulting to the industry standard.
Weekly, monthly, or annual — what plan type should Graphics & Design apps use?
Weekly plans now generate 55.6% of all subscription revenue globally, up from 43.3% two years ago. That structural shift is market-wide, and Graphics & Design is part of it. The exceptions are Health & Fitness (the only category where annual plans still dominate and continue to grow) and any category-specific subniche with a distinct retention profile. For a data-driven breakdown of how each plan type performs on LTV, conversion, and retention, see which subscription plan to offer: weekly, monthly, or annual.
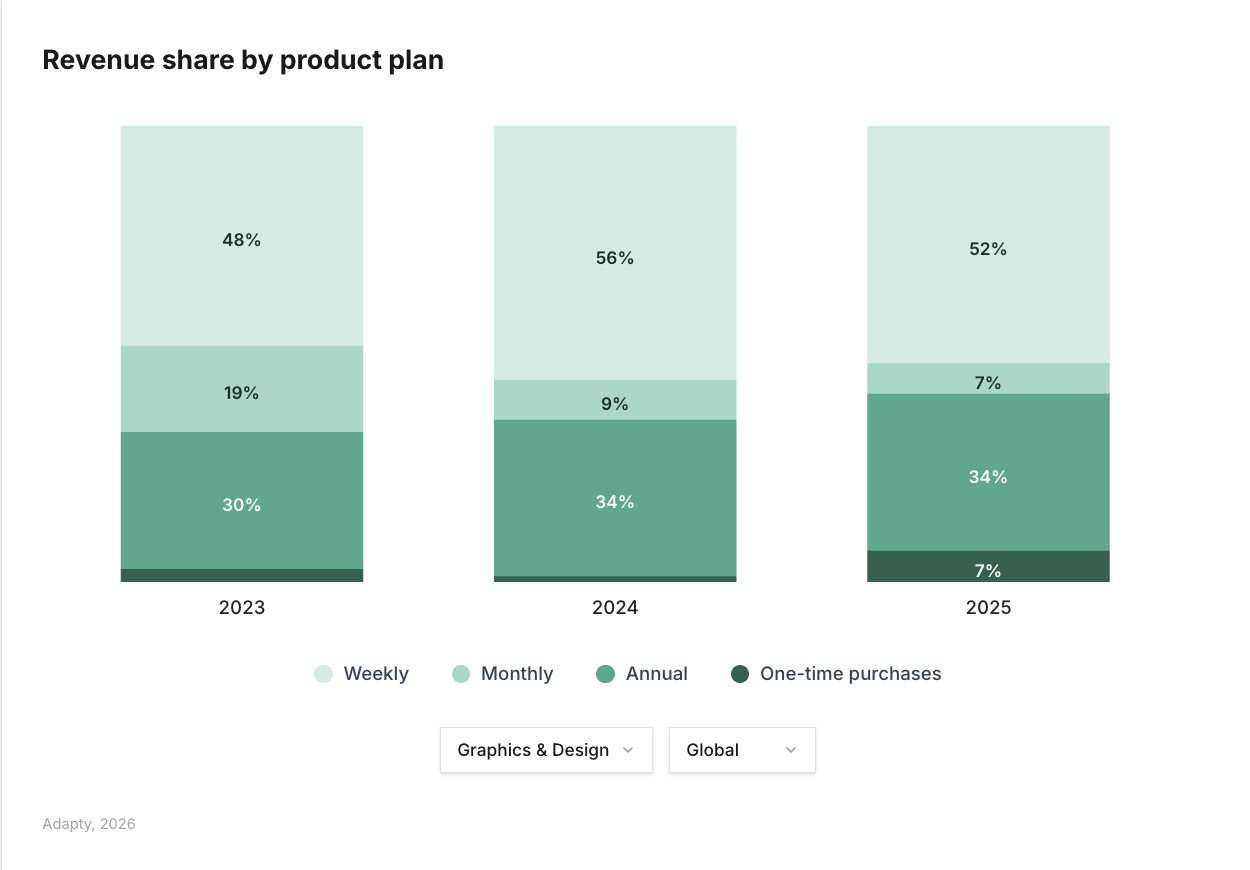
One-time purchases and lifetime subscriptions are also growing across the market — from 6.4% of revenue in 2023 to 10.3% in 2025. Graphics & Design apps with high per-use creative output (AI image generation, specialized editors, one-off templates) are natural candidates for this model. The full category-level breakdown is available in the interactive SOIS report.
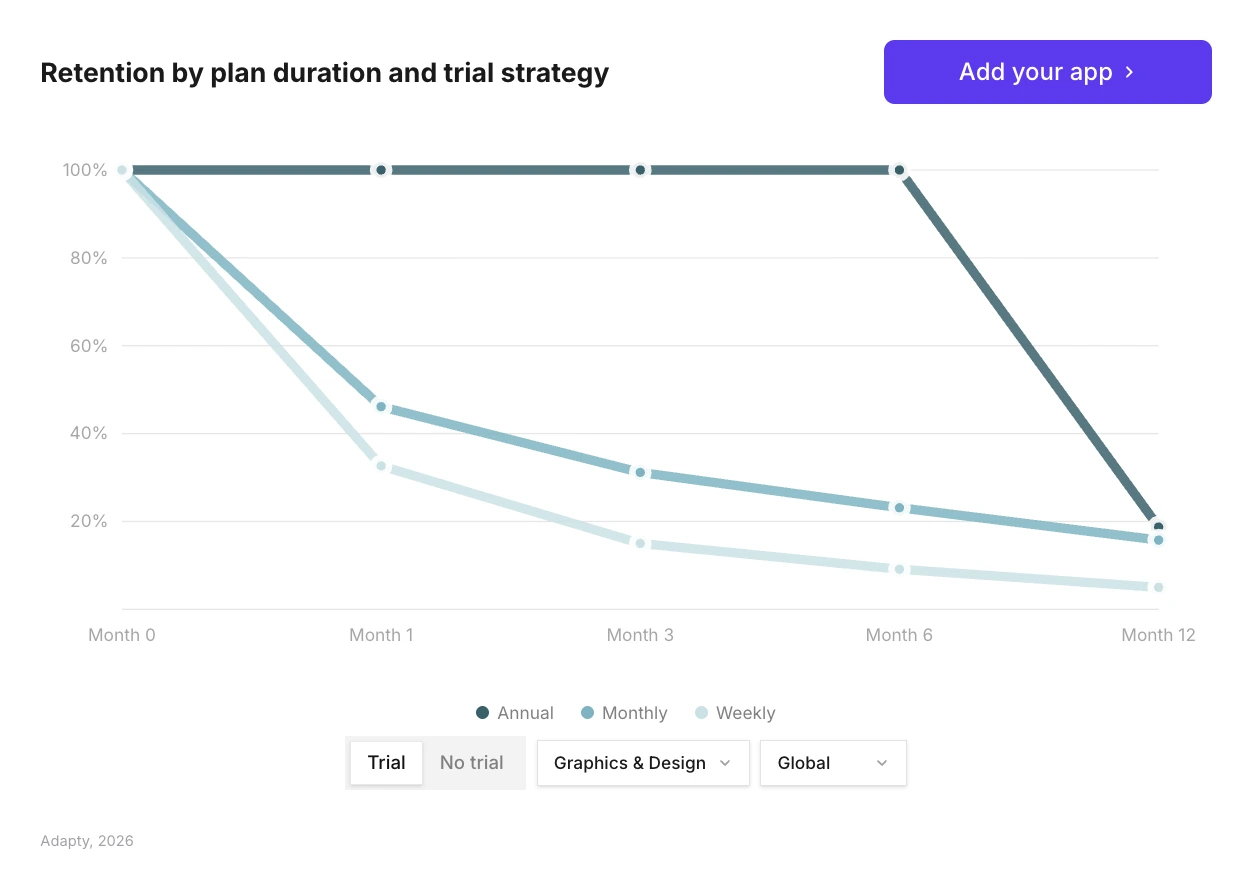
Productivity remains best overall, with 14% of users staying after one year. Utilities lead in one-year retention on annual plans at 22.1%. The category retention picture for Graphics & Design falls closer to Photo & Video — weaker long-term retention on annual plans, stronger trial-free direct purchase behavior. If you build in Graphics & Design, the plan-type question is better answered through A/B testing than through category assumption.
Should Graphics & Design apps offer free trials?
The data says: probably not by default.
Across the market, 7 in 10 apps offer trials, and that share has been stable. The SOIS 2026 data splits that adoption picture by category, and Graphics & Design sits alongside Productivity, Entertainment, and Lifestyle as the group where direct buyers generate more 12-month LTV than trial users. For the closest parallel case study, see in-app subscription benchmarks for Productivity apps — a category in the same direct-purchase camp.
The mechanism is straightforward. Graphics & Design users come to a creative tool with a specific output in mind: design a logo, retouch a photo, generate an AI asset, or prepare a social post. If the app delivers that output, users pay for it directly. A trial in this context invites users who want the output for free and will churn the moment they get it.
Hannah Parvaz makes a related point in the SOIS report: conversion is usually a belief problem, not a pricing problem.
For a Graphics & Design app, the belief is whether the tool produces the creative output the user needs. Apps that demonstrate that before asking for payment convert to direct purchase at rates that outperform trial setups. Lifestyle is the other category where this pattern shows up most clearly — see in-app subscription benchmarks for Lifestyle apps for the hard-paywall-plus-direct-purchase playbook applied to a habit-forming category. For benchmarks on what a healthy trial conversion rate looks like across categories, see free trial conversion rates for in-app subscriptions.
Healthy trial conversion rate looks like across categories, see free trial conversion rates for in-app subscriptions.
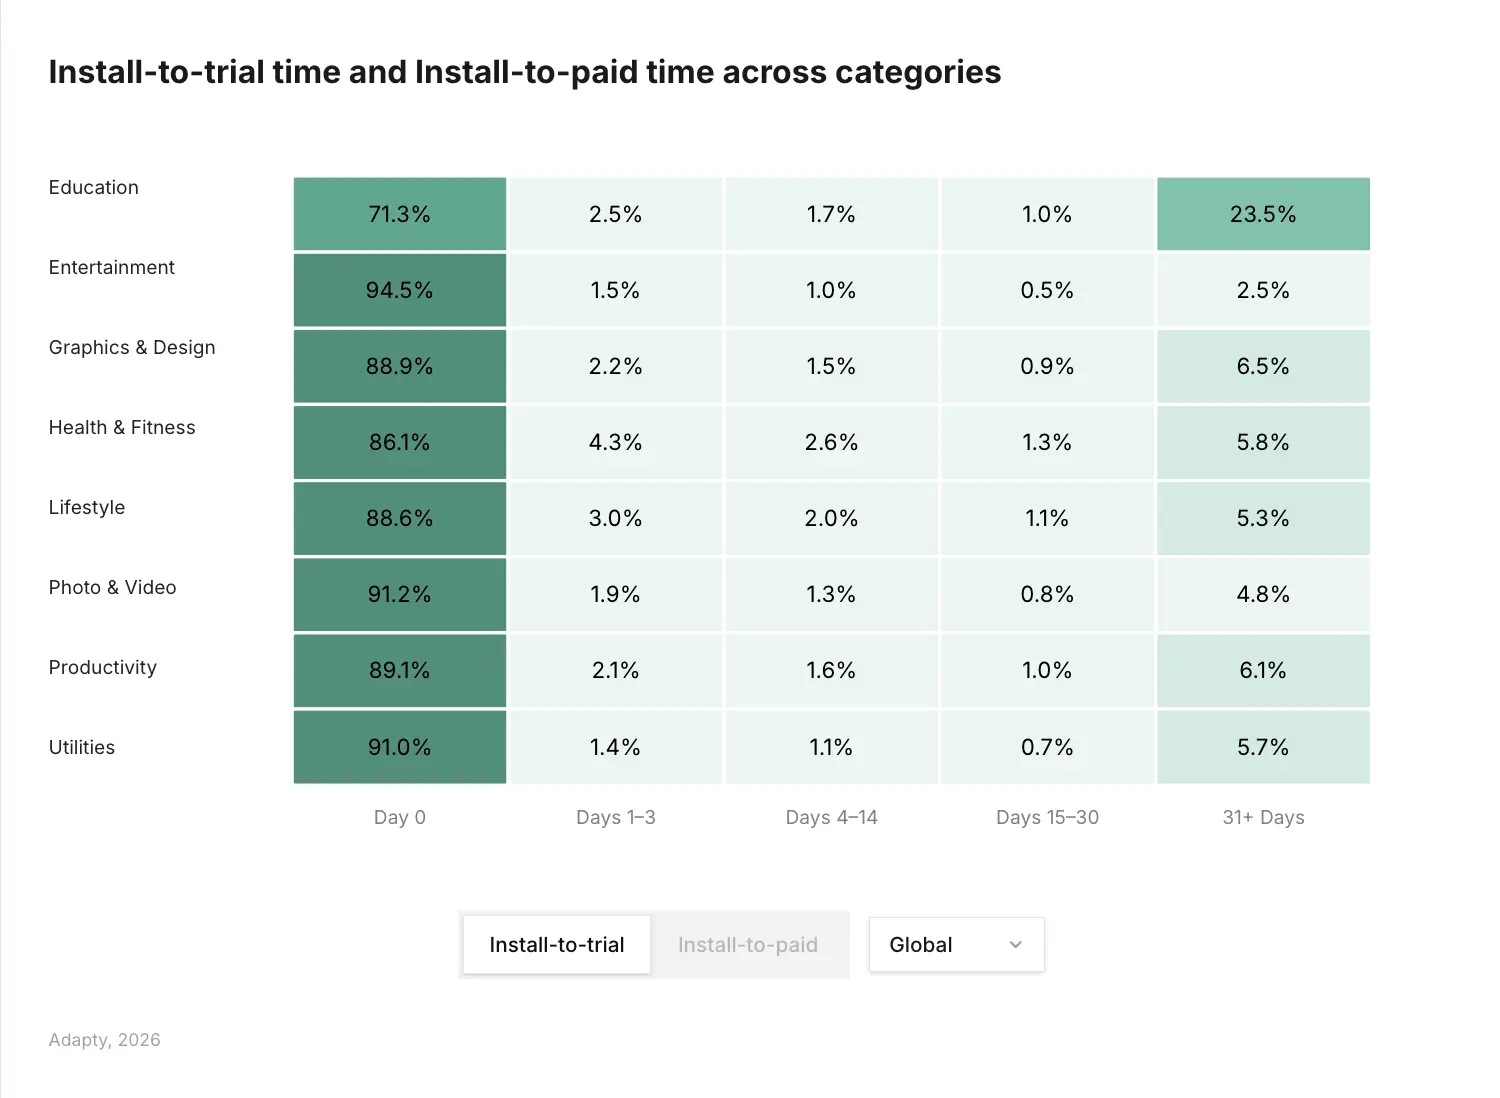
One structural note: 90% of trial starts happen on Day 0 across the market. For apps in categories where trials do work, onboarding quality determines trial outcome. For Graphics & Design, the more important Day 0 question is whether the user saw the tool produce a usable creative asset before hitting the paywall.
What does retention look like for Graphics & Design apps?
The SOIS 2026 benchmark for first-renewal retention across all categories sits at 59.2% globally. Graphics & Design is not called out as a retention leader — Utilities sits at the top with 58.1% first-renewal retention and a category-leading 22.1% one-year retention on annual plans. Health & Fitness sits at the bottom at 30.3% first-renewal retention.
The more useful retention signal for Graphics & Design comes from the price-retention relationship. Higher-priced weekly plans retain 12% better at first renewal across the market. Users paying more for a weekly creative tool are more likely to renew, which aligns with the direct-buyer LTV pattern in the category.
How competitive is the Graphics & Design category?
Graphics & Design sits at 94.6% revenue concentration in the top 10% of apps — in line with Photo & Video, just above the all-category average of 94.5%. Lifestyle is the most concentrated at 97.9%. Utilities and Health & Fitness are the least concentrated at 92.6% each.
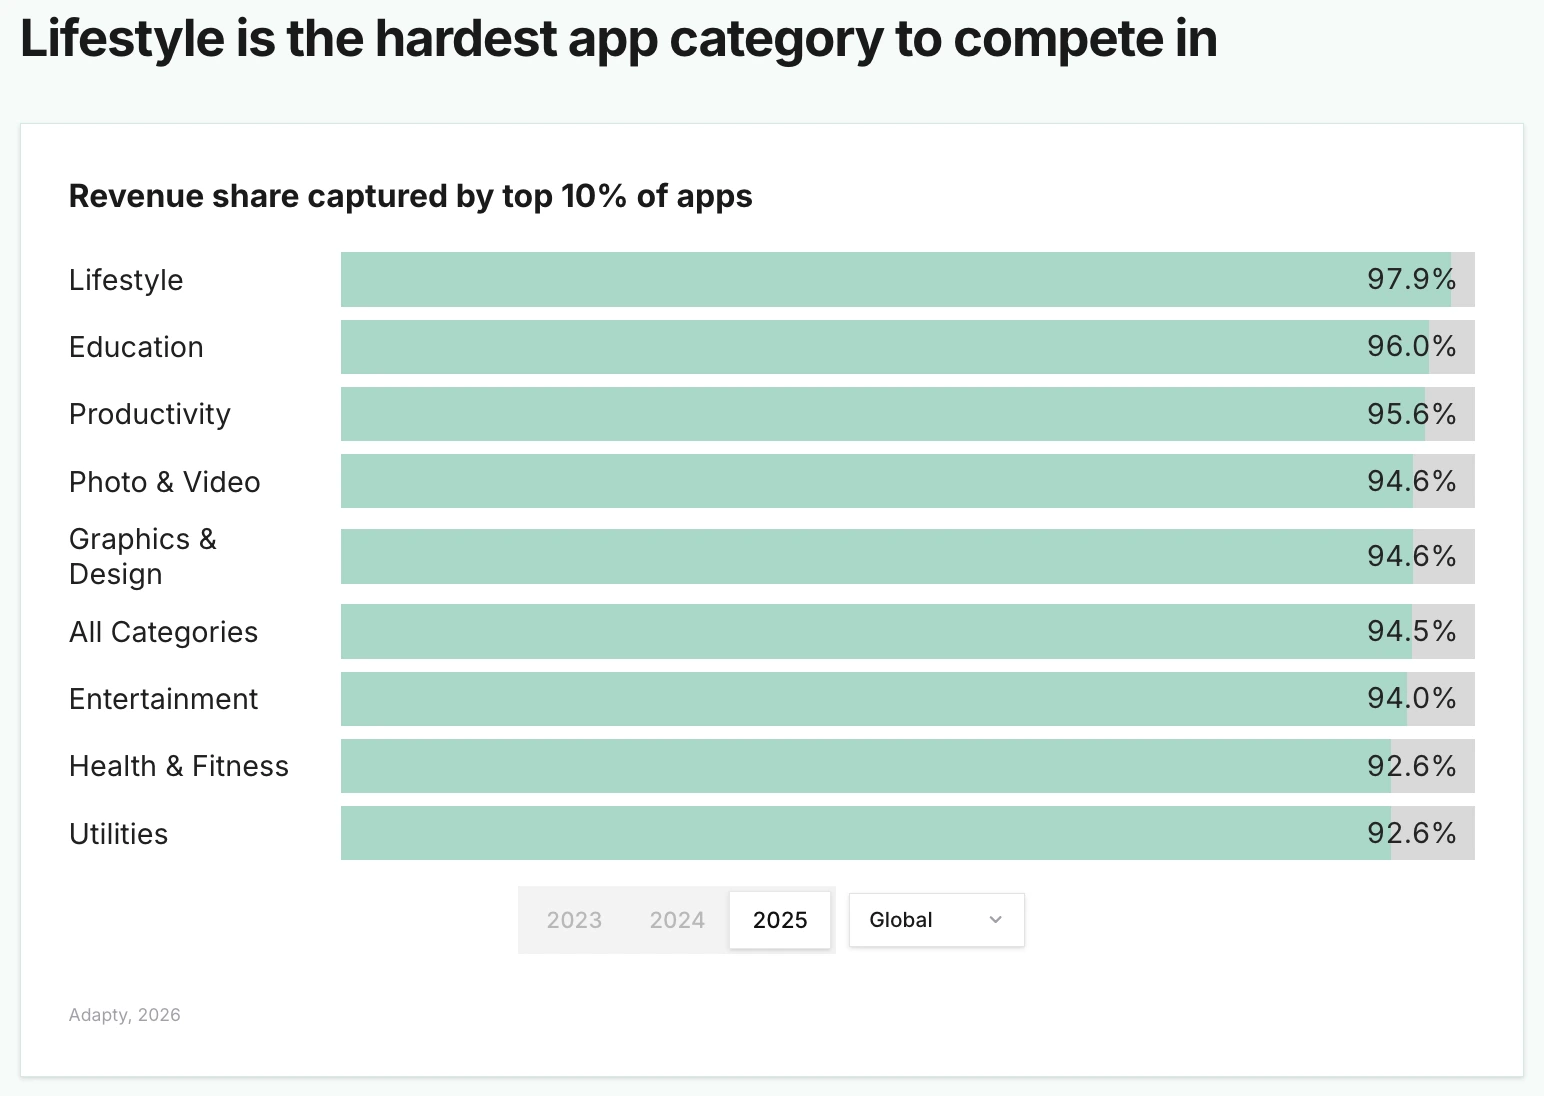
The overall market is compressing. Top 10% revenue share grew from 92.7% in 2023 to 94.5% in 2025. Across the market, 31% more apps were launched in 2025, while median monthly revenue per new app dropped 22%. The category breakdown shows Graphics & Design is not the most concentrated category, but the AI surge is reshaping who the top 10% are.
What new Graphics & Design apps are up against
58% of new apps across the market earn under $1,000 in their first year. Only 7.9% break $100K. For the full distribution of where new subscription apps actually land, see how much a subscription app makes? Sylvain Gauchet's read in the SOIS report: new apps still have room to break through by picking a specific niche, experimenting with monetization (base pricing more than discounts, plan durations especially weekly, and trial/no-trial with retention watched closely), and localizing for growth markets.
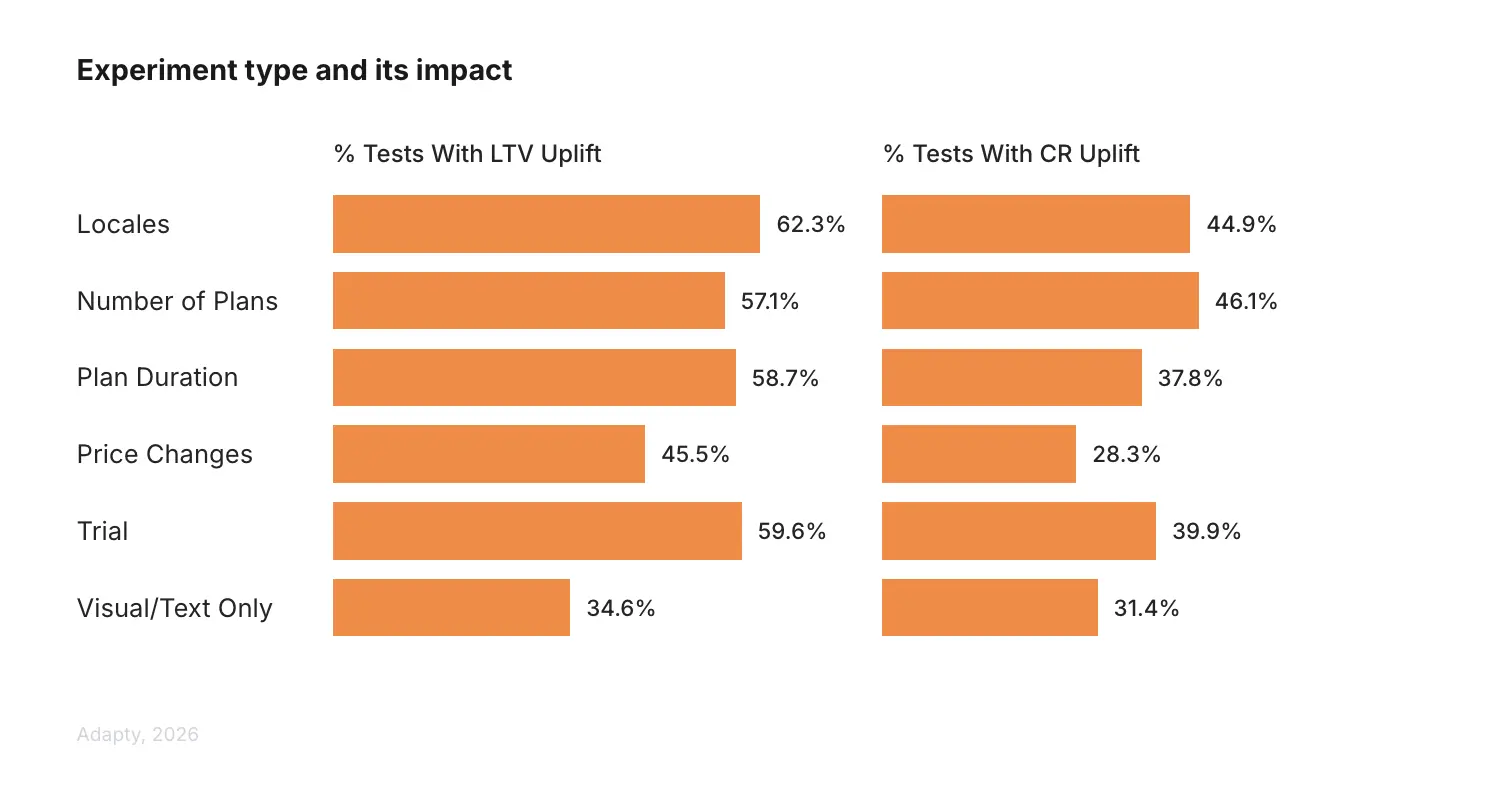
For Graphics & Design, that niche approach maps onto AI subcategories, specific creative workflows (logo design, social post generation, photo retouching, brand asset creation), and vertical-specific templates. The experiment data reinforces the playbook: localization tests drive the highest LTV uplift rate of any experiment type at 62.3%, and plan duration and trial structure tests both show 57-59% win rates.
How are AI-powered Graphics & Design apps performing?
This is where the category gets interesting.
AI Graphics & Design apps grew revenue 202% year over year in 2025 — the second fastest growth rate of any category, behind only Lifestyle AI at 691%. Utilities AI came in third at 174%. Graphics & Design is not a laggard in the AI shift. It is the second-biggest beneficiary.
Across the AI apps segment broadly, the monetization profile differs from that of average apps in three ways. AI apps convert into trial at roughly half the market rate (5.31% vs. 10.92% install-to-trial) but get 14% more direct purchases. On LTV, annual plans with trials are where AI apps outperform: $66.70 vs. $49.92 for average apps. And AI apps retain worse across most metrics — losing 20% more annual-plus-trial subscribers by year's end — while charging more per user, so LTV still comes out ahead.
Three implications for Graphics & Design AI apps specifically:
- Direct purchase alignment. AI apps over-index on direct purchases. Graphics & Design over-indexes on direct purchases. Building a Graphics & Design AI app around a direct-purchase paywall aligns two of the strongest signals in the report.
- Higher-priced room. Phil Carter's point in the SOIS report: AI app developers need higher ARPU to offset LLM costs. The dataset shows high-priced apps earn 3x more LTV than low-priced ones with no conversion penalty on weekly plans. Price is higher and test. More on the structural patterns separating top performers: what makes a subscription app successful in 2026.
- Churn tolerance. AI apps churn faster. Plan for it in your LTV model rather than treating it as a retention failure.
Which regions should Graphics & Design app builders prioritize?
North America still drives over half of global subscription revenue, and North American install LTV runs roughly 2x the global average. That makes the US the default priority for most Graphics & Design apps.
Europe overtook North America as the most expensive region in 2025 on annual, monthly, and weekly plans. For Graphics & Design apps with European users already onboard, the 18% year-over-year European price increase is an unused pricing lever. Among the top countries by median one-year LTV, the top three European countries (Switzerland at $28.5, Iceland at $23.9, the United Kingdom at $23.6) all outperform the US at $19.9.
| Region | Signal for Graphics & Design apps |
| North America | Highest install LTV (~2x global average) — primary revenue market |
| Europe | Subscription prices up 18% YoY — pricing room exists |
| Japan | Top LTV country in APAC ($23.4), fastest-growing market |
| Mexico / Turkey | Fast-growing markets flagged in report for localization opportunity |
| LATAM | 35% lower LTV than top European countries — distinct regional strategy needed |
Japan, Mexico, and Turkey are the fastest-growing app markets in the report. For Graphics & Design AI apps specifically, localization is the highest-ROI experiment type available — 62.3% of localization tests drive LTV uplift. Creative tools translate across languages through visual output, which lowers the content burden of localization compared to text-heavy categories like Education.
What paywall setup performs best for Graphics & Design apps?
The top-performing paywall configuration in the report overall is weekly with a 3-day free trial — generating 1.5x the average LTV of all other setups. That benchmark is category-agnostic. For Graphics & Design specifically, the direct-buyer LTV advantage complicates the default playbook.
Three paywall signals worth testing in Graphics & Design:
- Direct-purchase paywalls. Given the category's direct-buyer LTV advantage, run a direct-purchase paywall variant against the default weekly-plus-trial. The baseline assumption that trials outperform does not hold in Graphics & Design.
- Hard paywalls. Hard paywalls produce 21% higher LTV than soft paywalls on average. Soft paywalls out-convert by nearly 50%, but hard paywall users spend 20-33% more than the median. For a creative tool where the value proposition is demonstrable inside one session, hard paywalls are worth testing.
- Onboarding placement. Onboarding paywalls convert at 1.78% on average with trials — the highest rate by placement. Even in a direct-purchase-dominated category, onboarding is where the decision is made.
Vahe Baghdasaryan's observation in the SOIS report is worth remembering: visual changes are the hardest paywall tests to win on. What moves LTV is structural — trial presence, plan count, placement. Start there. For a full analysis of what separates high-converting paywalls from the rest, see what a high-performing paywall looks like in 2026.
Web paywalls
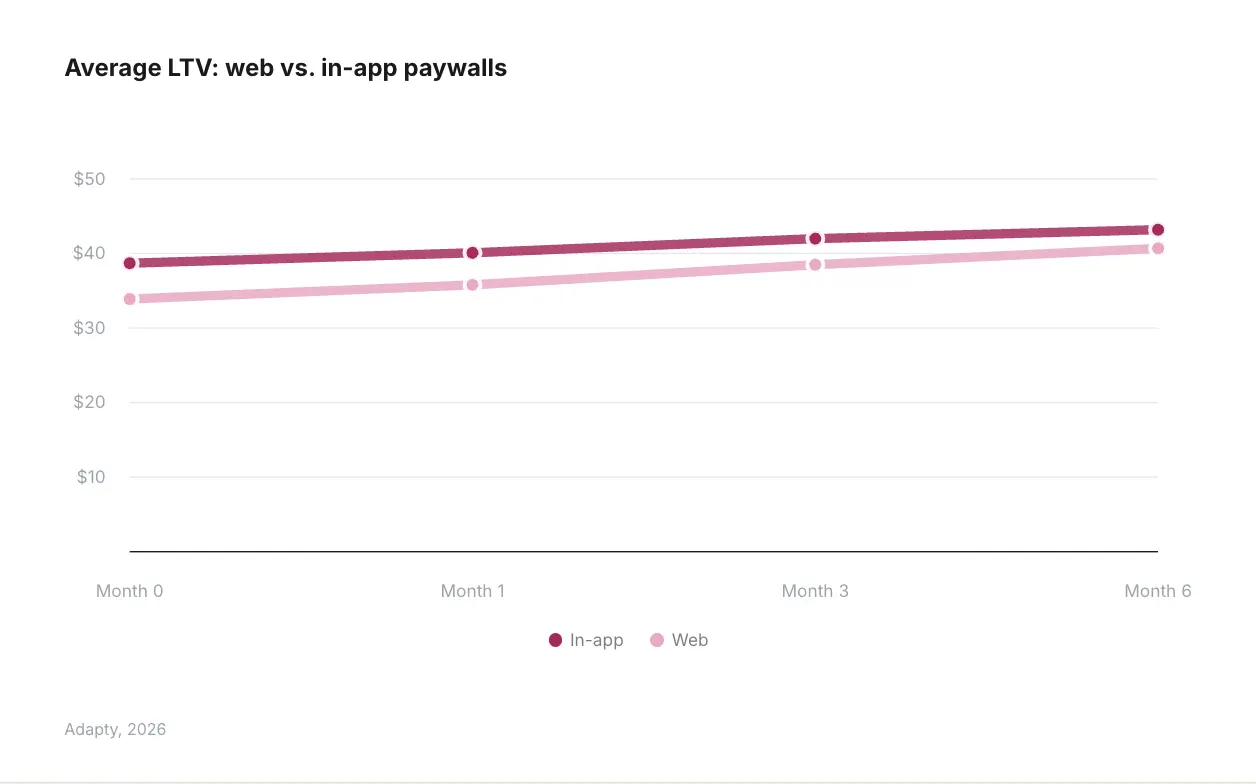
Web paywalls became available in the US in mid-2025. In-app paywalls still convert better (1.60% vs. 1.10%), but web paywalls skip the 30% App Store commission. Over 12 months, in-app LTV remains $4 higher than web LTV ($40.1 vs. $35.8) due to lower web retention. For a Graphics & Design app where direct purchase already dominates, web paywalls are worth monitoring as the data matures.
See how your Graphics & Design app stacks up
Filter any chart in the SOIS 2026 report by category, region, plan type, and country to see exactly where your app ranks. Then use Adapty to test what the data suggests — plans, trial structures, pricing, localization — without shipping an app update.