TL;DR
- Trials boost LTV in Utilities, Health & Fitness, and Education — but hurt it in Productivity and Lifestyle.
- In Productivity, direct buyers generate $56.95 vs. $49.13 for trial users over 12 months.
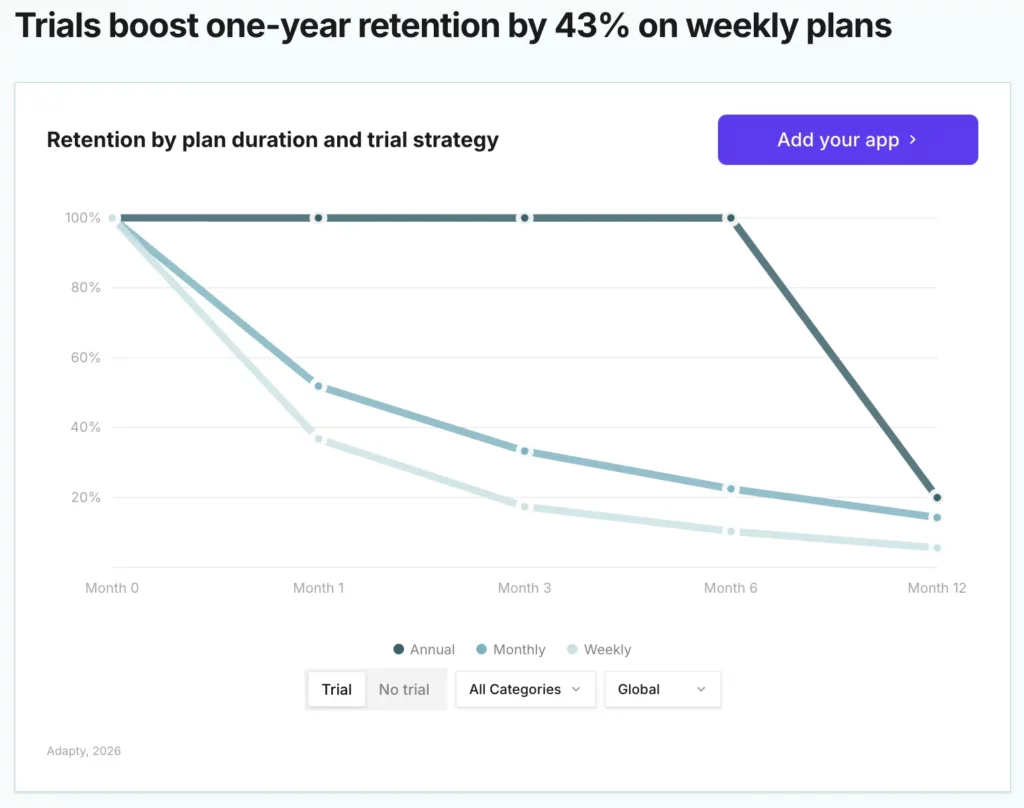
- Trial users retain 8-60% better at first renewal, with weekly plans showing the largest gains.
- 7 in 10 apps offer trials — the share hasn’t moved in two years. Whether they work depends entirely on your category.
- The right answer depends on your category, billing cycle, and what a converted trial user actually looks like.
“Always offer a free trial” is probably the most repeated advice in mobile subscription monetization. It shows up in playbooks, conference talks, and onboarding checklists across the industry.
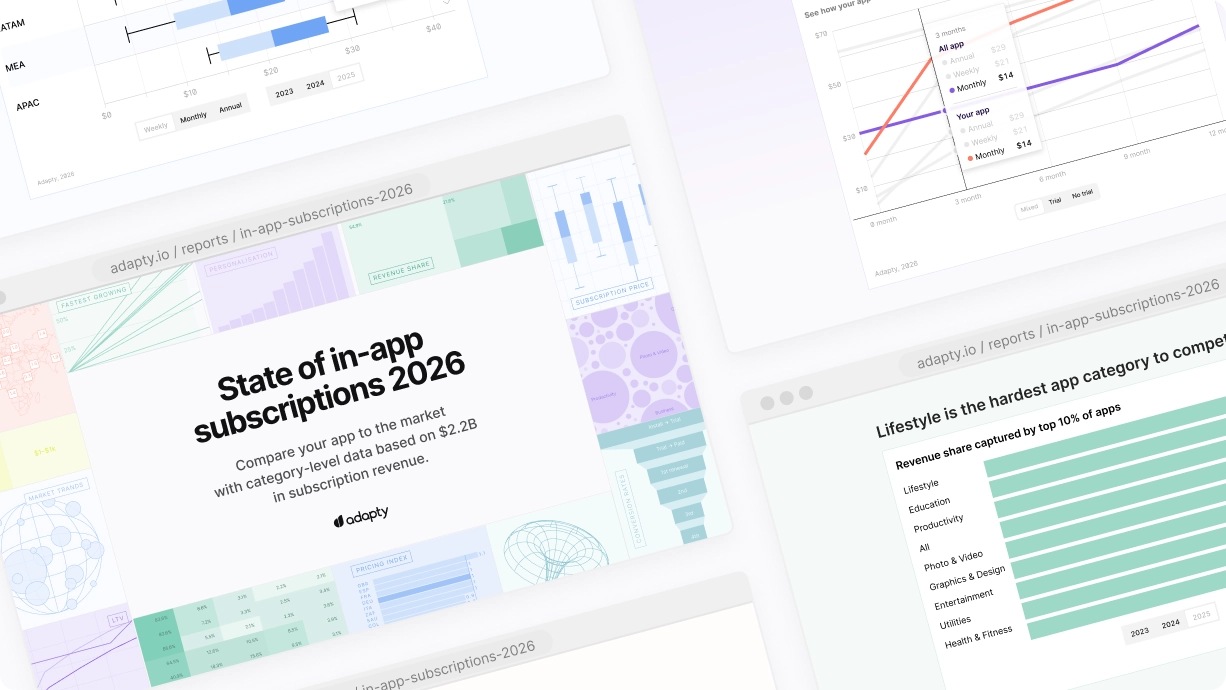
The data from Adapty’s State of In-App Subscriptions 2026 report breaks it.
Across $3B in subscription revenue from 16,000+ apps, the trial vs. direct question doesn’t have a single answer. It has a category-specific one. And if you’re copying a blanket strategy without checking whether it fits your app, you might be actively acquiring your worst subscribers.
Does a free trial actually increase LTV?
In some categories, yes. In others, no.
The 2026 report breaks down one-year LTV by category, billing cycle, and acquisition path. Trials lift LTV for annual subscriptions in Utilities, Health & Fitness, and Education. In Productivity, Lifestyle, Entertainment, and Graphics & Design, direct buyers end the year with more.
| Category | Trial LTV (12-mo) | Direct LTV (12-mo) | Advantage |
|---|---|---|---|
| Productivity | $49.13 | $56.95 | Direct +16% |
| Lifestyle | Lower | Higher | Direct +21% |
| Utilities | Higher | Lower | Trial wins |
| Health & Fitness | Higher | Lower | Trial wins |
| Education | Higher | Lower | Trial wins |
Productivity leads all categories at a median 12-month LTV of $46.97, with Utilities at $46.30 and Education at $45.10. But category rank and trial performance are separate questions. Productivity tops the LTV chart and rewards direct buyers. Utilities sit one rung below and reward trials.
“Always offer a free trial” is bad advice. In Productivity, direct buyers are worth $56.95 vs $49.13 for trial users. In Lifestyle, trial users end up 21% less valuable than direct buyers. If you’re in Productivity and pushing trials hard, you might be actively acquiring your worst subscribers.— Sven Jurgens, App Growth Consultant
Why do trials hurt LTV in some categories?
In Utilities, a trial does real screening work. Users who try a tool, find it solves their problem, and convert are likely to stick. These are habit-forming, functional apps. The trial filters for intent. Utilities lead all categories in long-term retention, and trials reinforce that pattern.
In Productivity, users who subscribe directly are higher-intent from the start. They already decided. Running them through a trial adds friction without improving quality. It delays commitment and opens a window for disengagement before billing begins.
Lifestyle and Entertainment face a related problem. Trial users in these categories churn faster after conversion, which pulls down 12-month LTV relative to direct buyers regardless of initial conversion rate.
In my experience, conversion is a belief problem. A lot of apps show the paywall before users have answered three questions: will this work for me, do I understand how to use it, do I trust this company? When that happens, the paywall becomes a moment of doubt.— Hannah Parvaz, Founder, Aperture
Do trials improve renewal rates?
Yes, and the effect is significant on weekly plans.
Trial users renew 8 to 60% better at first renewal, depending on plan type. One-year retention on weekly plans with a trial runs 43% higher than weekly plans without one.
Even in categories where trial users produce lower 12-month LTV, the improved renewal cadence matters for cohort stability. Churn compounds. A small improvement in renewal rate 1 catches up over time.
North American users respond most strongly: the install-to-trial rate is 14.5% in North America, versus 7.6 to 10.2% in other regions. For apps running region-specific paywall strategies, that gap changes the calculus on where trials are worth promoting.
Should you offer a trial on annual plans specifically?
For Utilities, Health & Fitness, and Education: yes. Annual plans with trials outperform direct annual purchases in all three categories.
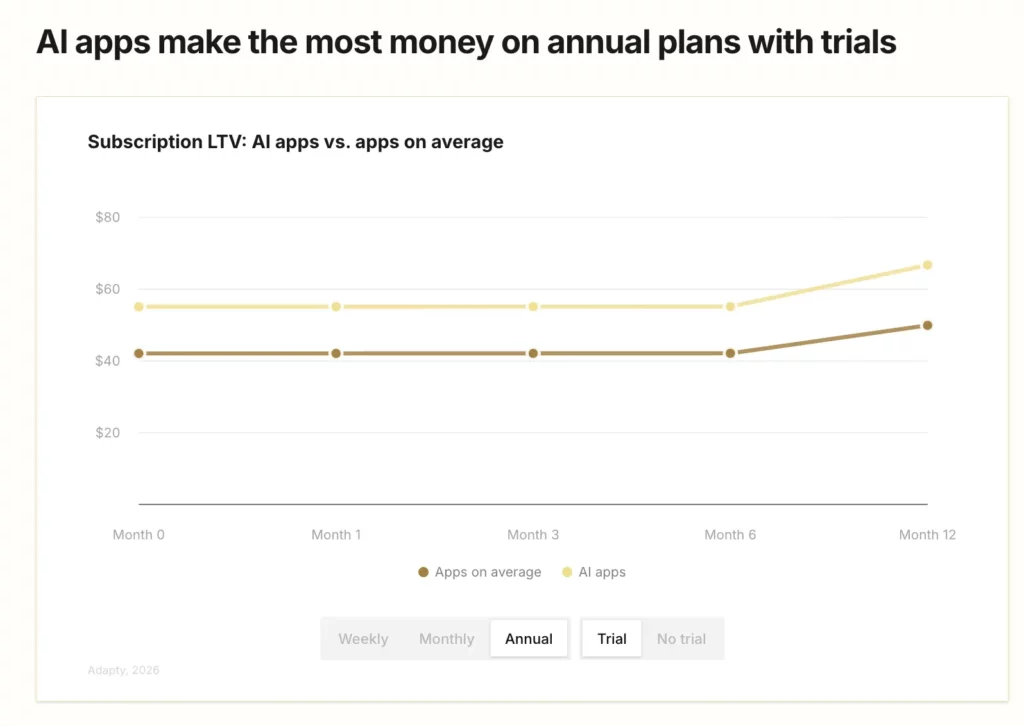
For AI apps, annual plans with trials are where the numbers pull furthest ahead. One-year LTV for AI apps on annual plans with trials reaches $66.70, compared to $49.92 across all apps. Adding a trial to an AI annual plan lifts one-year LTV by 35% over direct purchase.
Productivity is the exception. Even on annual plans, direct buyers outperform trial users. Run a test before treating trials as a default for annual plans in this category.
What’s the best paywall setup by LTV?
Weekly $5.99 with a 3-day free trial. It produces 1.5x the average LTV of every other paywall configuration in the dataset.
The worst setup by LTV: annual at $79.99 with no trial. The worst by conversion rate: monthly at $19.99 with a 7-day free trial.
| Setup | Performance metric | Result |
|---|---|---|
| Weekly + 3-day trial | Best by 1-year LTV | 1.5x average |
| Annual, no trial | Worst by 1-year LTV | — |
| Monthly | Best by conversion rate | — |
| Monthly + 7-day trial | Worst by conversion rate | — |
Weekly plans now generate 56% of all app subscription revenue, up from 43.3% in 2023. That is not a paywall trend. It is a shift in how users prefer to pay, and it has been accelerating for three consecutive years.
How long should a free trial be?
Trial length is a secondary question. The primary one is Day 0. 90% of trial starts happen on Day 0. Users open the app, hit the paywall, and decide. There is no “I’ll come back to it.”
A 7-day trial does not give you 7 days to convince someone. It gives you Day 0. Everything after that is retention work, not conversion work.
90% of trial starts happen on Day 0. The user opens the app, hits the paywall, and decides in that moment. There’s no ‘I’ll think about it and come back.’ And yet most onboarding flows are built like the user has all the time in the world.— Steve P. Young, Founder, App Masters
Health & Fitness is the clearest exception. Users there either buy on Day 0 or on Days 4 to 7. They want to see results before committing. A longer trial window matches that behavior.
For every other category: fix Day 0 before adjusting trial length. Users who do not engage in the first session will not be saved by extra days.
Which categories should use trials, and which shouldn’t?
The 2026 data by category:
| Category | Recommendation | Key signal |
|---|---|---|
| Utilities | Use trials | Lead in LTV + retention with trial |
| Health & Fitness | Use trials | Retention peaks Days 4-7; trial earns trust |
| Education | Use trials | LTV uplift on annual plans with trial |
| Productivity | Test before defaulting | Direct buyers are worth 16% more at 12 months |
| Lifestyle | Caution | Trial users 21% less valuable than direct |
| Entertainment | Caution | Direct buyers retain better at renewal |
| Graphics & Design | Test | Direct buyers outperform; the category is niche |
| Photo & Video | Test | Trial refund rate spikes to 14% in APAC |
How often do trial users ask for refunds?
More often than direct buyers. Photo & Video leads in trial refunds at 6.4% globally, spiking to 14.1% in APAC, driven by South Korea’s consumer refund policies. Refunds can reach 14% of subscription revenue in the worst-performing category-region combinations.
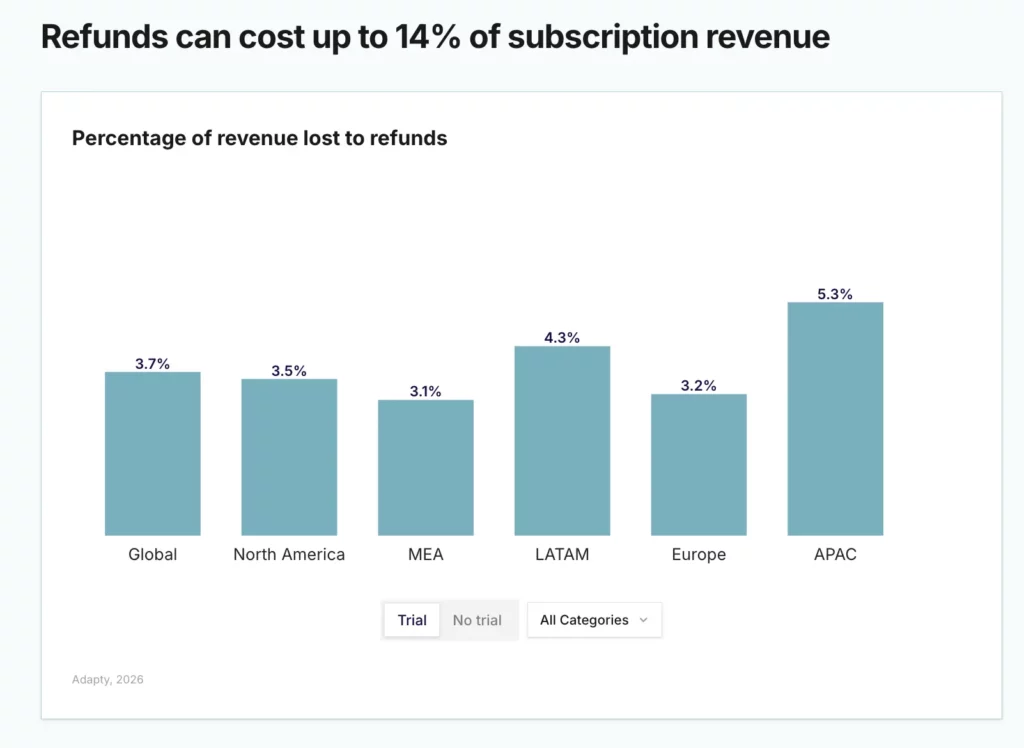
MEA posts the lowest rates overall: 2.5% non-trial, 3.1% trial. Elevated refund rates in trial cohorts often trace back to the trial experience. Users who feel surprised by a charge after a trial are more likely to dispute it. The fix is usually in the cancellation flow and reminder timing, not the trial length.
Does experimenting with trial strategy actually change outcomes?
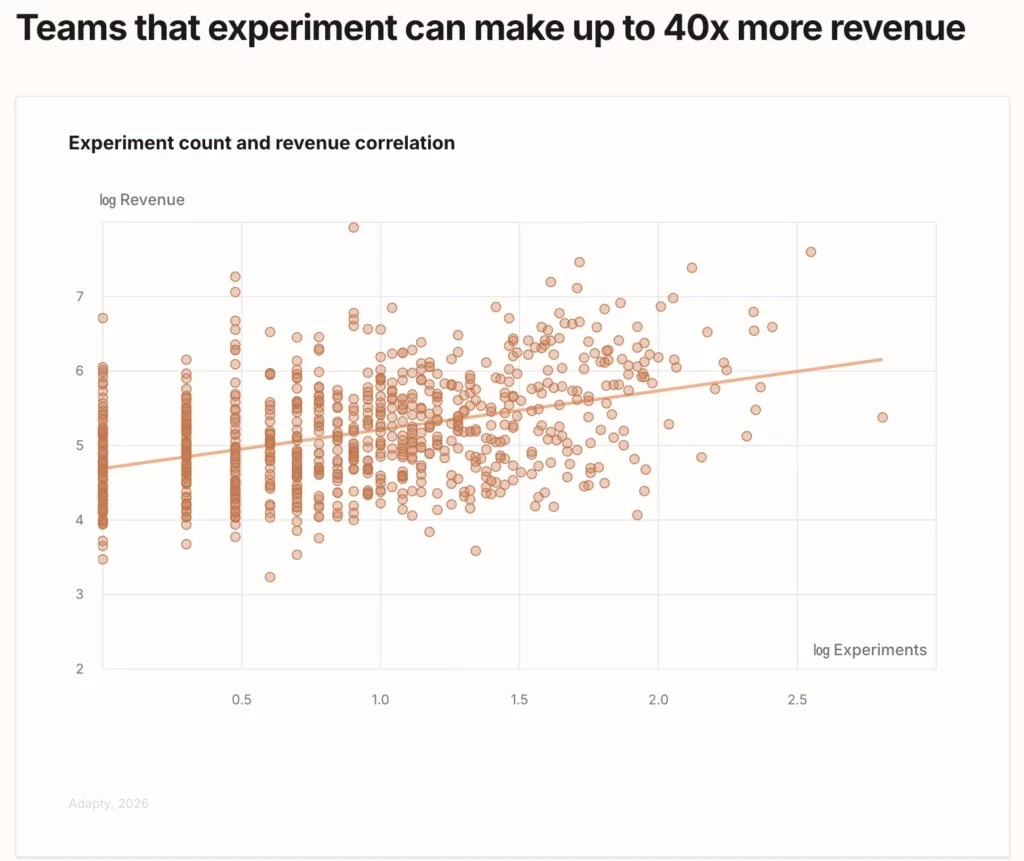
Teams that run paywalls and trial experiments make up to 40x more revenue than teams that don’t. The average experiment count per active tester is 14.7. Apps that start testing don’t stop at one.
Trial-related experiments, such as whether to offer a trial, length, and placement, show a 59.6% win rate for LTV uplift. That beats visual or text-only changes at 34.6% and price changes at 45.5%.
Structural changes outperform surface changes. Testing whether your paywall has a trial, how many plans you show, and where in the app the paywall appears moves revenue. Changing the button color does not.
What is the most common paywall A/B test I see? Someone tweaks the visuals, it doesn’t convert better, and they walk away thinking paywalls don’t matter. That’s not what happened. They just tested the wrong thing first. What actually moves LTV is structural: does this plan have a trial? How many options am I showing? Where in the app does this appear?— Vahe Baghdasaryan, Founder & CEO, Tangent
See how your app compares
This article draws from Adapty’s State of In-App Subscriptions 2026, an interactive report covering $3B in subscription revenue across 16,000+ apps. Every chart is filterable by category, region, country, and plan type.