TL;DR
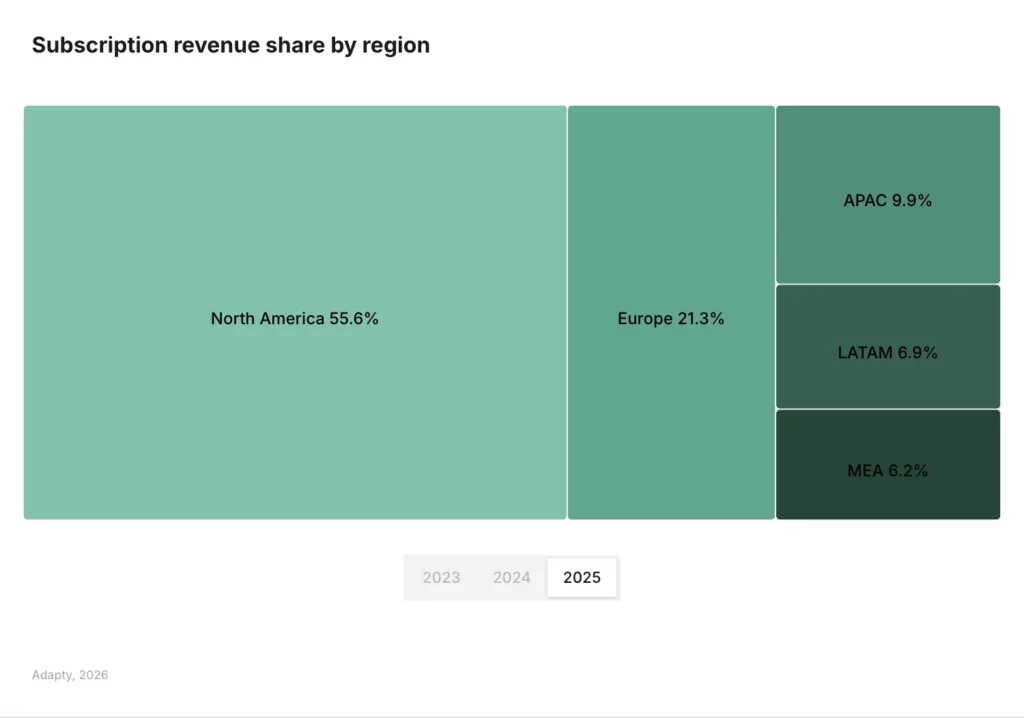
- North America still controls over half of global subscription revenue — but its share dropped 3 percentage points since 2023.
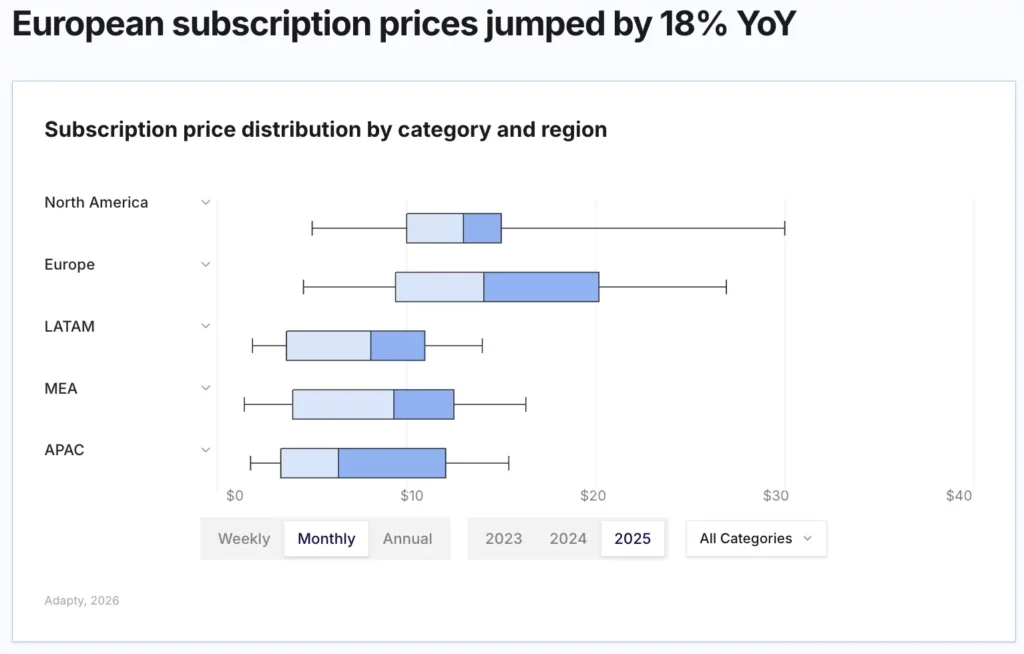
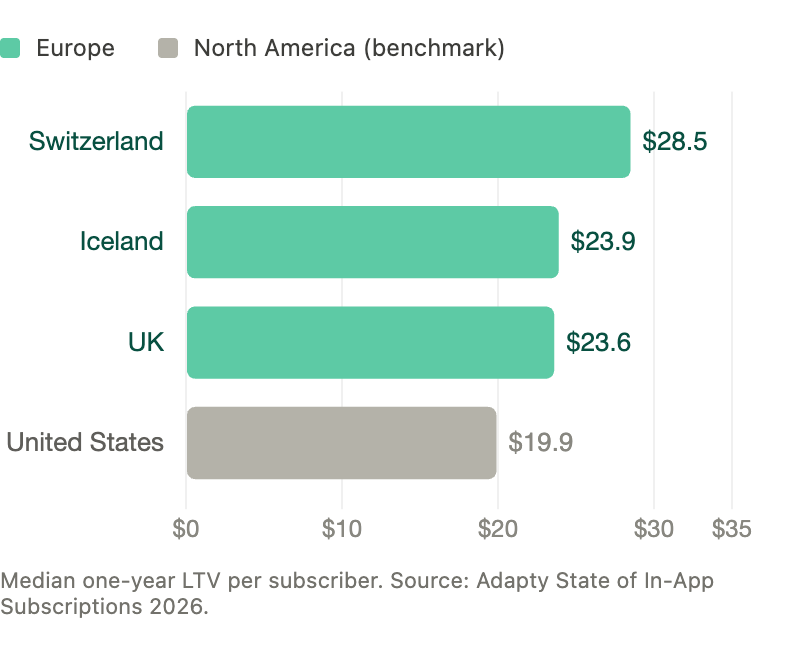
- Europe is the breakout story: prices jumped 18% YoY, and European countries now outperform the US in median LTV.
- Japan, Mexico, and Turkey are growing fastest as emerging markets. All three are worth localizing for now.
- MEA is the quiet overperformer — Qatar ($27.5 LTV) and UAE ($21.8) are beating the US ($19.9) with the lowest refund rates of any region.
- APAC is a split story: Japan and Singapore are premium markets; India and Indonesia are high-volume, low-ARPU, and need completely different strategies.
Most teams building subscription apps treat geography as an afterthought. They launch in English, price for the US market, and maybe run localization tests later if there’s bandwidth. That’s a mistake — and the 2026 State of in-app subscriptions data makes it hard to justify.
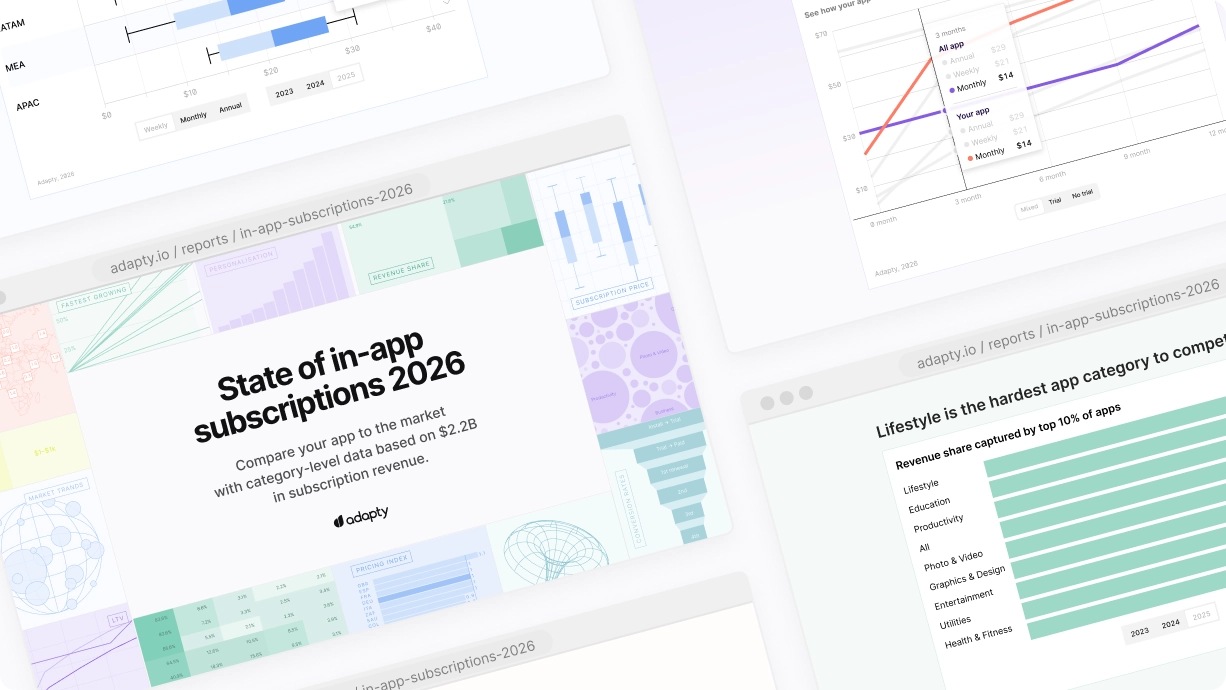
Adapty’s report is based on $3B in subscription revenue across 16,000+ apps. The geographic picture it paints is one of a market actively shifting. North America is still dominant, but its grip is loosening. Europe is getting expensive in a good way. And markets like Japan, Mexico, and Turkey are growing fast enough that ignoring them now means paying more to enter later.
Here’s what the data actually shows, region by region.
Is North America still the market that matters most?
North America drives more than half of all global subscription revenue. That’s not changing anytime soon. But the 3-percentage-point share drop since 2023 is meaningful — it signals that other regions are growing faster, not that the US market is shrinking.
The US median LTV sits at $19.9. Canada comes in slightly higher at $20.9. These are solid numbers, but they’re no longer the ceiling.

What’s actually happening: The North American market is maturing. Competition is intensifying — the top 10% of apps capture 94.5% of all revenue, up from 92.7% in 2023. For teams already in this market, the opportunity is optimization, not expansion. For teams not yet here, the cost of entry is higher than anywhere else.
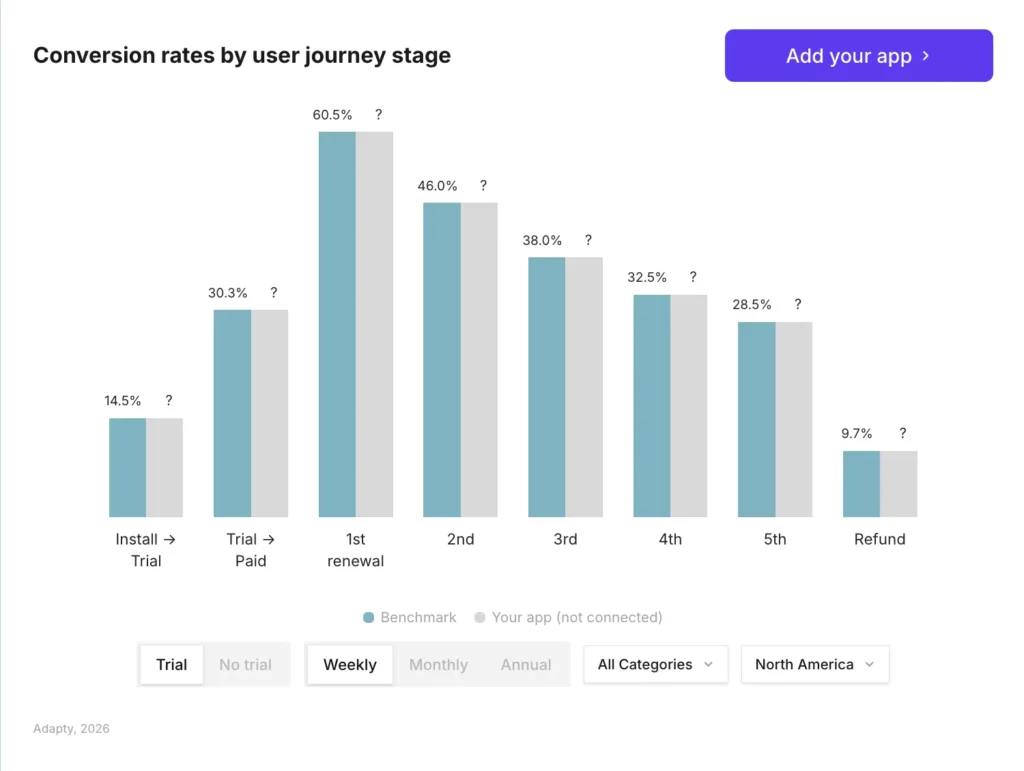
The install-to-trial rate in North America is 14.5% — the highest globally, compared to 7.6-10.2% everywhere else. North American users are more willing to start trials and more likely to convert. That makes it the best market to test paywall changes before rolling them out globally.
Why is Europe suddenly the most expensive region to subscribe to?
Europe overtook North America as the most expensive region for app subscriptions — on annual, monthly, and weekly plans. Median European prices jumped 18% year-over-year. That’s not just inflation or currency effects. European users are paying more because they’re willing to.
The top European countries now outperform the US in median one-year LTV:
The biggest single price jump: European Utilities annual plans, up 70.5% over two years. That’s not a typo.
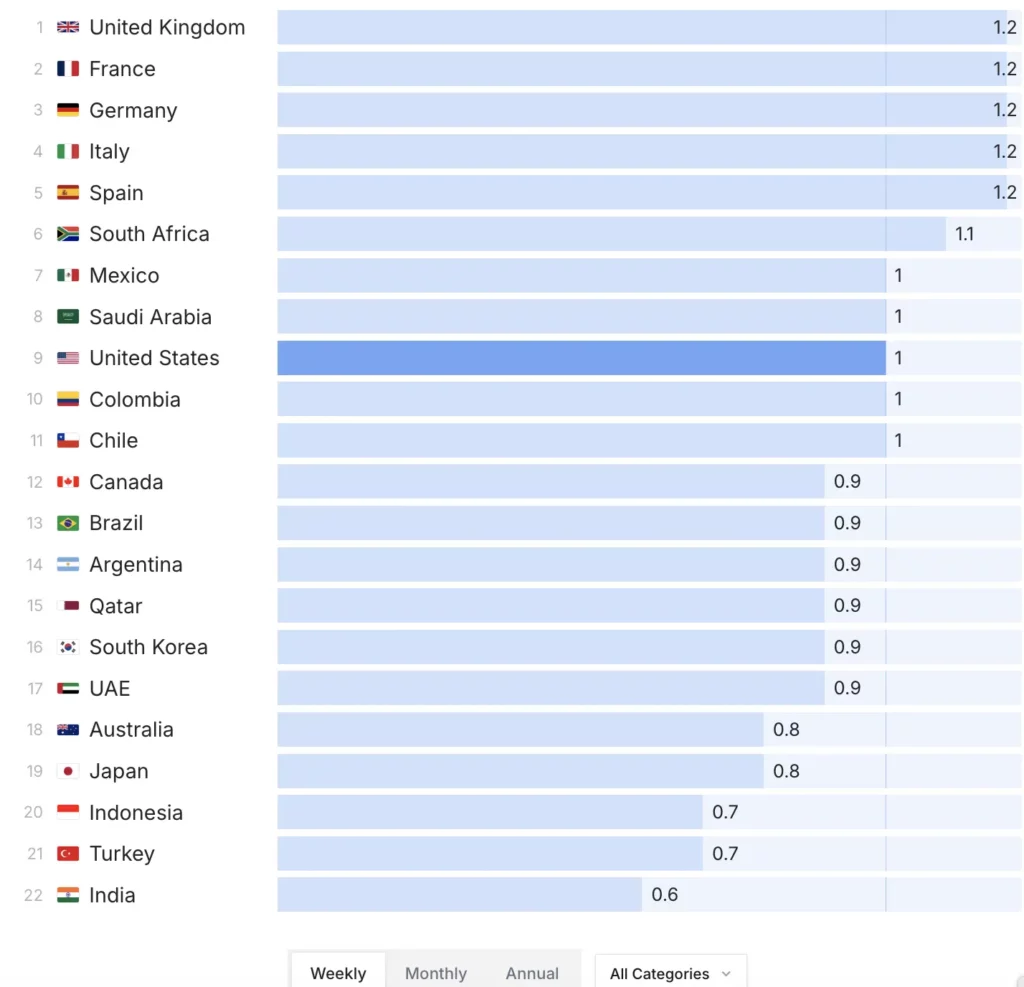
What most developers are still getting wrong: pricing Europe the same as the US. The data suggests that European users — especially those in the DACH region, the Nordics, and the UK — will pay a premium. The UK, France, Germany, Italy, and Spain all index 20% higher than the US on the pricing index. If you’re not running localized price tests in Europe, you’re probably undercharging.
The major European markets — UK, France, Germany, Italy, Spain — all cluster at a 1.2x pricing index relative to the US baseline. Australia and Japan come in lower (0.8x), which often surprises teams who assume English-speaking or high-income markets will behave similarly.
One nuance: European monthly subscribers are the most price-sensitive at renewal. Low-priced apps see 40% higher first-renewal rates than high-priced ones in this segment. The move isn’t obvious: price lower, or rethink plan mix. Annual plans, where European premium shows up most clearly, should be the focus.
Is Latin America actually worth localizing for?
Latin America is not a monolith, and treating it as one is the most common mistake teams make when entering the region. The top LATAM countries in the data show solid LTV numbers:

That’s 35% lower than top European countries — but the gap is narrowing, and the growth trajectory is different. Mexico is explicitly called out in the SOIS 2026 data as among the fastest-growing app markets globally.
The structural challenge in LATAM: price sensitivity is real, but it’s not uniform. Argentina’s economy is volatile; Mexico has a large middle class actively adopting subscription services; Brazil has scale but lower ARPU. You need country-level pricing strategies, not a single “LATAM price”.
The localization test data backs this up directly: locale-specific experiments have a 62.3% LTV uplift win rate — the highest of any experiment type. In LATAM, a translated paywall is not a localized one. Price points, billing cycle defaults, and copy that maps to how people actually make purchase decisions here — those are the real variables.
One more signal worth noting: the APAC data shows that in high-price-sensitivity markets, the gap between cheap and expensive weekly plans is 3.1x in LTV. LATAM shows similar dynamics. Premium positioning works — but you have to earn it with product experience and onboarding, not just put a high price on the paywall.
Why are Qatar and the UAE outperforming the US on LTV?
The Middle East & Africa are the most underrated regions in this data set. The headline numbers:
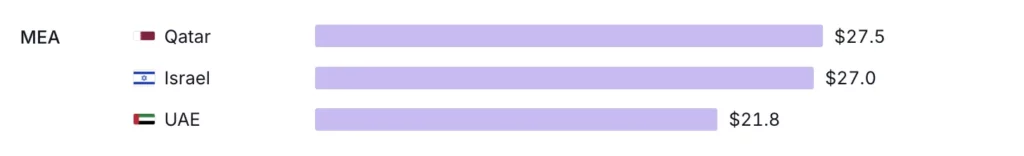
Qatar and Israel are both outperforming the US by a meaningful margin. The UAE is neck-and-neck with Canada. And this is happening with the lowest refund burden of any region globally — including the lowest of any category-region-cohort combination in Entertainment.
What this means operationally: MEA isn’t a charity play or a volume play. The Gulf cluster — Qatar, UAE, Saudi Arabia — is a premium LTV opportunity with low refund risk. Saudi Arabia indexes at 1.0x on pricing (same as the US), which suggests there’s room to push prices higher in a market that’s demonstrating willingness to pay.
The Africa component of MEA is a different story — South Africa indexes at 1.1x on pricing (slightly above the US baseline), but the addressable market for premium subscriptions is smaller. The opportunity there is longer-term, tied to smartphone penetration and payment infrastructure maturation.
Is APAC one market or five?
Asia-Pacific is where geographic assumptions break down fastest. The region spans everything from Japan ($23.4 LTV, 0.8x pricing index) to India (0.6x pricing index) to Indonesia (0.7x). Treating these as the same market is like treating Germany and Romania as interchangeable.
The premium tier: Japan, Singapore, Australia
Japan is one of the fastest-growing app markets globally according to SOIS 2026 data, and it’s also one of the hardest to localize for. The effort is real: Japanese users expect native-quality experiences, not translated English products. But the LTV is there — $23.4, ahead of the US.
Singapore ($22.2) and Australia ($21.5) behave similarly to Western markets in terms of willingness to pay. Australia indexes at 0.8x on price despite high income levels — suggesting there’s pricing headroom that most apps aren’t capturing.
The volume tier: India, Indonesia, and Southeast Asia
India (0.6x pricing index) and Indonesia (0.7x) are high-volume, low-ARPU markets. That doesn’t mean they’re not worth pursuing — it means the unit economics look completely different. Weekly plans, lower price points, and Android-first distribution are the right frame here.
The APAC refund problem: Photo & Video apps see trial refund rates spike to 14.1% in APAC — the highest of any category-region combination globally. This is driven largely by South Korea’s consumer-friendly refund policies. If you’re in this category and distributing in Korea, refund management should be on your radar before you scale spend.
Which markets should you prioritize in 2026?
The data doesn’t give you a universal answer, because the right geography depends on your category, your current scale, and what you’re trying to optimize for. But it does give you some clear signals:
If you’re already in North America and optimizing:
- Europe is your highest-confidence next step — premium LTV, growing prices, and users who convert at similar rates to US users once you get the pricing right.
- Run locale-specific A/B tests. The SOIS data shows localization experiments have the highest LTV uplift win rate of any experiment type.
If you’re looking for emerging market growth:
- Japan, Mexico, and Turkey are the app fastest-growing markets. All three have different localization requirements and different optimal billing cycles.
- Mexico: weekly plans, local pricing, Spanish-native copy.
- Japan: full localization commitment or don’t bother. The LTV is worth it if you do it properly.
- Turkey: 0.7x pricing index, but growing fast. Useful for volume plays in Utilities and Productivity.
If you’re ignoring MEA:
- Qatar and UAE are producing $27+ LTV with minimal refund risk. If you’re not distributing there, you’re leaving clean revenue on the table.
- Arabic localization isn’t optional for these markets — but the apps winning there don’t all have it. Premium English-language apps with high-quality UX are converting in the Gulf.
The broader takeaway from SOIS 2026 is that geographic concentration is a risk, not just a strategy. North America’s share is declining. The apps that are growing fastest aren’t the ones doubling down on a single market — they’re the ones using data to find where their unit economics work before scaling spend.