Two revenue numbers, one dashboard: why cohort and cash-flow revenue will never match

TL;DR:
Revenue analytics shows money on the day it was received — use it for financial reporting. Cohort revenue ties money to the user's install date — use it for ROAS and LTV. Mixing them up is the most common reason Apple Ads ROAS looks wrong.
Your Apple Ads team says ROAS looks great. Finance says revenue is flat. Both are staring at the same Adapty dashboard — one looking at cohort revenue, the other at Revenue analytics. Neither is wrong — they're just using the wrong chart for the question they're asking. This mix-up breaks more ROAS calculations than any campaign mistake. Here's how to fix it.
What's the easiest way to think about the difference?
Think of it as two different statements.
Revenue analytics is your bank account statement. Every transaction, on the day it cleared. Good for knowing your balance and reporting to finance.
Cohort revenue is more like tracking a specific investment. You put $40k into September campaigns. This view shows you the return on that specific bet — at W1, M1, M3, and full LTV.
You wouldn't evaluate an investment by looking at your total bank balance. Same logic here.
| Revenue analytics | Cohort revenue | |
| What it shows | Revenue on the day the transaction happened | Revenue tied to the user's install date |
| Think of it as | Bank account statement — cash in/out by date | Investment tracker — return per campaign |
| Find it at | Analytics → Charts → Revenue | Analytics → Cohorts → Revenue |
| Use for | P&L, cash planning, financial reporting | ROAS, LTV, payback period |
| Answers | When did the money arrive? | Which users generated the money? |
Why does using Revenue analytics for ROAS give you the wrong number?
Here's a scenario that plays out in a lot of teams. September just ended. You spent $50,000 on Apple Ads. You open Analytics → Charts, select Revenue, see $180,000 for September, and calculate 3.6x ROAS. Looks solid. You report up.
But that $180,000 includes:
- Some revenue from your actual September campaigns
- Renewals from users acquired in January, March, June
- Annual subscribers whose billing date happened to fall in September
- Refunds from last month processed late
Your $50k didn't generate $180k. It generated a fraction of that. The rest is money you earned months ago, just showing up now. Dividing total monthly revenue by monthly ad spend doesn't give you ROAS. It gives you a number that looks like ROAS but tells you nothing about how your campaigns are actually performing. For a full framework on how to structure Apple Ads analysis — from attribution setup to bid optimization — see How to analyze and optimize Apple Search Ads.
Which chart should you use for each question?
| Question | Use this |
| How much money did we receive in September? | Analytics → Charts → Revenue |
| What did our September Apple Ads spend return? | Analytics → Cohorts → Revenue |
| Is our cash position healthy? | Analytics → Charts → Revenue |
| Should we scale this campaign? | Analytics → Cohorts → Revenue |
| What's the M1 LTV for August installs? | Analytics → Cohorts → Revenue |
| What do I report to finance for Q3? | Analytics → Charts → Revenue |
Simple rule: question about when money arrived → Analytics → Charts. Question about which users generated money → Analytics → Cohorts.
How should you track revenue for Apple Ads?
Most teams treat them as interchangeable. They're not.
Revenue analytics — the financial view
Shows every dollar that moved on a given day: new purchases, renewals, and refunds. Doesn't matter when the user installed or which campaign brought them in. It shows what actually hit your account. Use it for P&L, cash planning, and monthly financial reporting.
Cohort revenue — the marketing view
Ties revenue to when a user was acquired, not when they paid. A user who installed on May 1st via Apple Search Ads? Every dollar they ever spend gets attributed back to May 1st. Use it for ROAS, LTV, and payback period.
If you want to understand how these fit into your broader analytics setup — alongside UA and product metrics — this guide to the mobile app analytics stack is a useful reference.
How do you calculate ROAS correctly in Adapty?
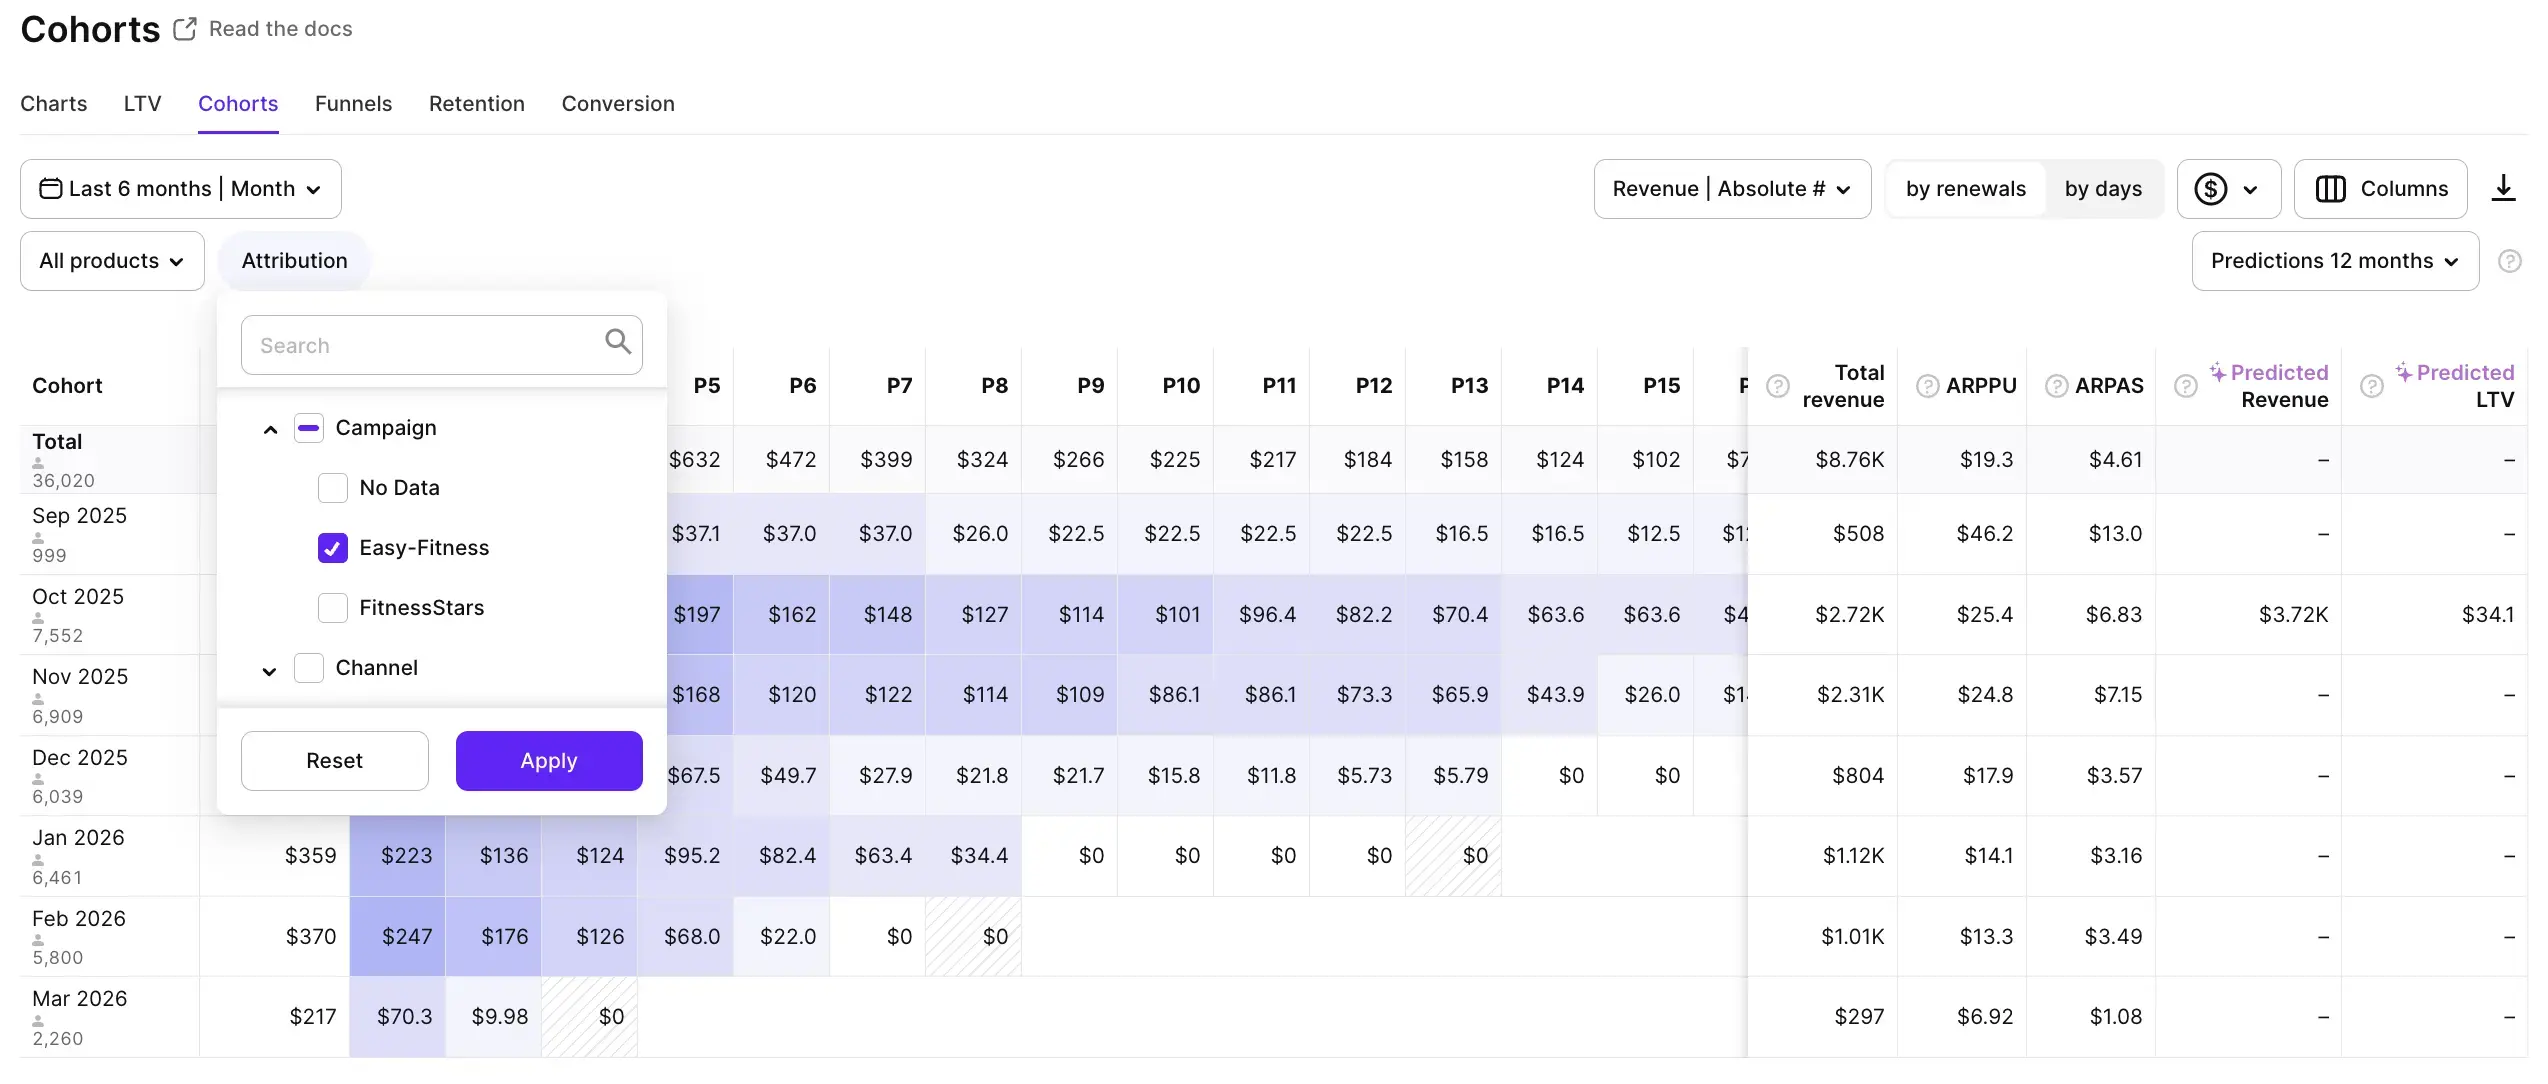
Step 1. Go to Analytics → Cohorts → open the Attribution filter → select Campaign → pick the campaign you're analyzing.
To filter by campaign: open the Attribution filter → select Campaign → pick the campaign you're analyzing (e.g., RP_US_V15). The table will show only revenue from users acquired through that campaign.
Step 2. Set the date range to the install period you're analyzing — not the current calendar month.
Step 3. Look at the Total Revenue column. That's cumulative revenue earned by users acquired in that window, across all time periods (W1, M1, M3, and beyond).
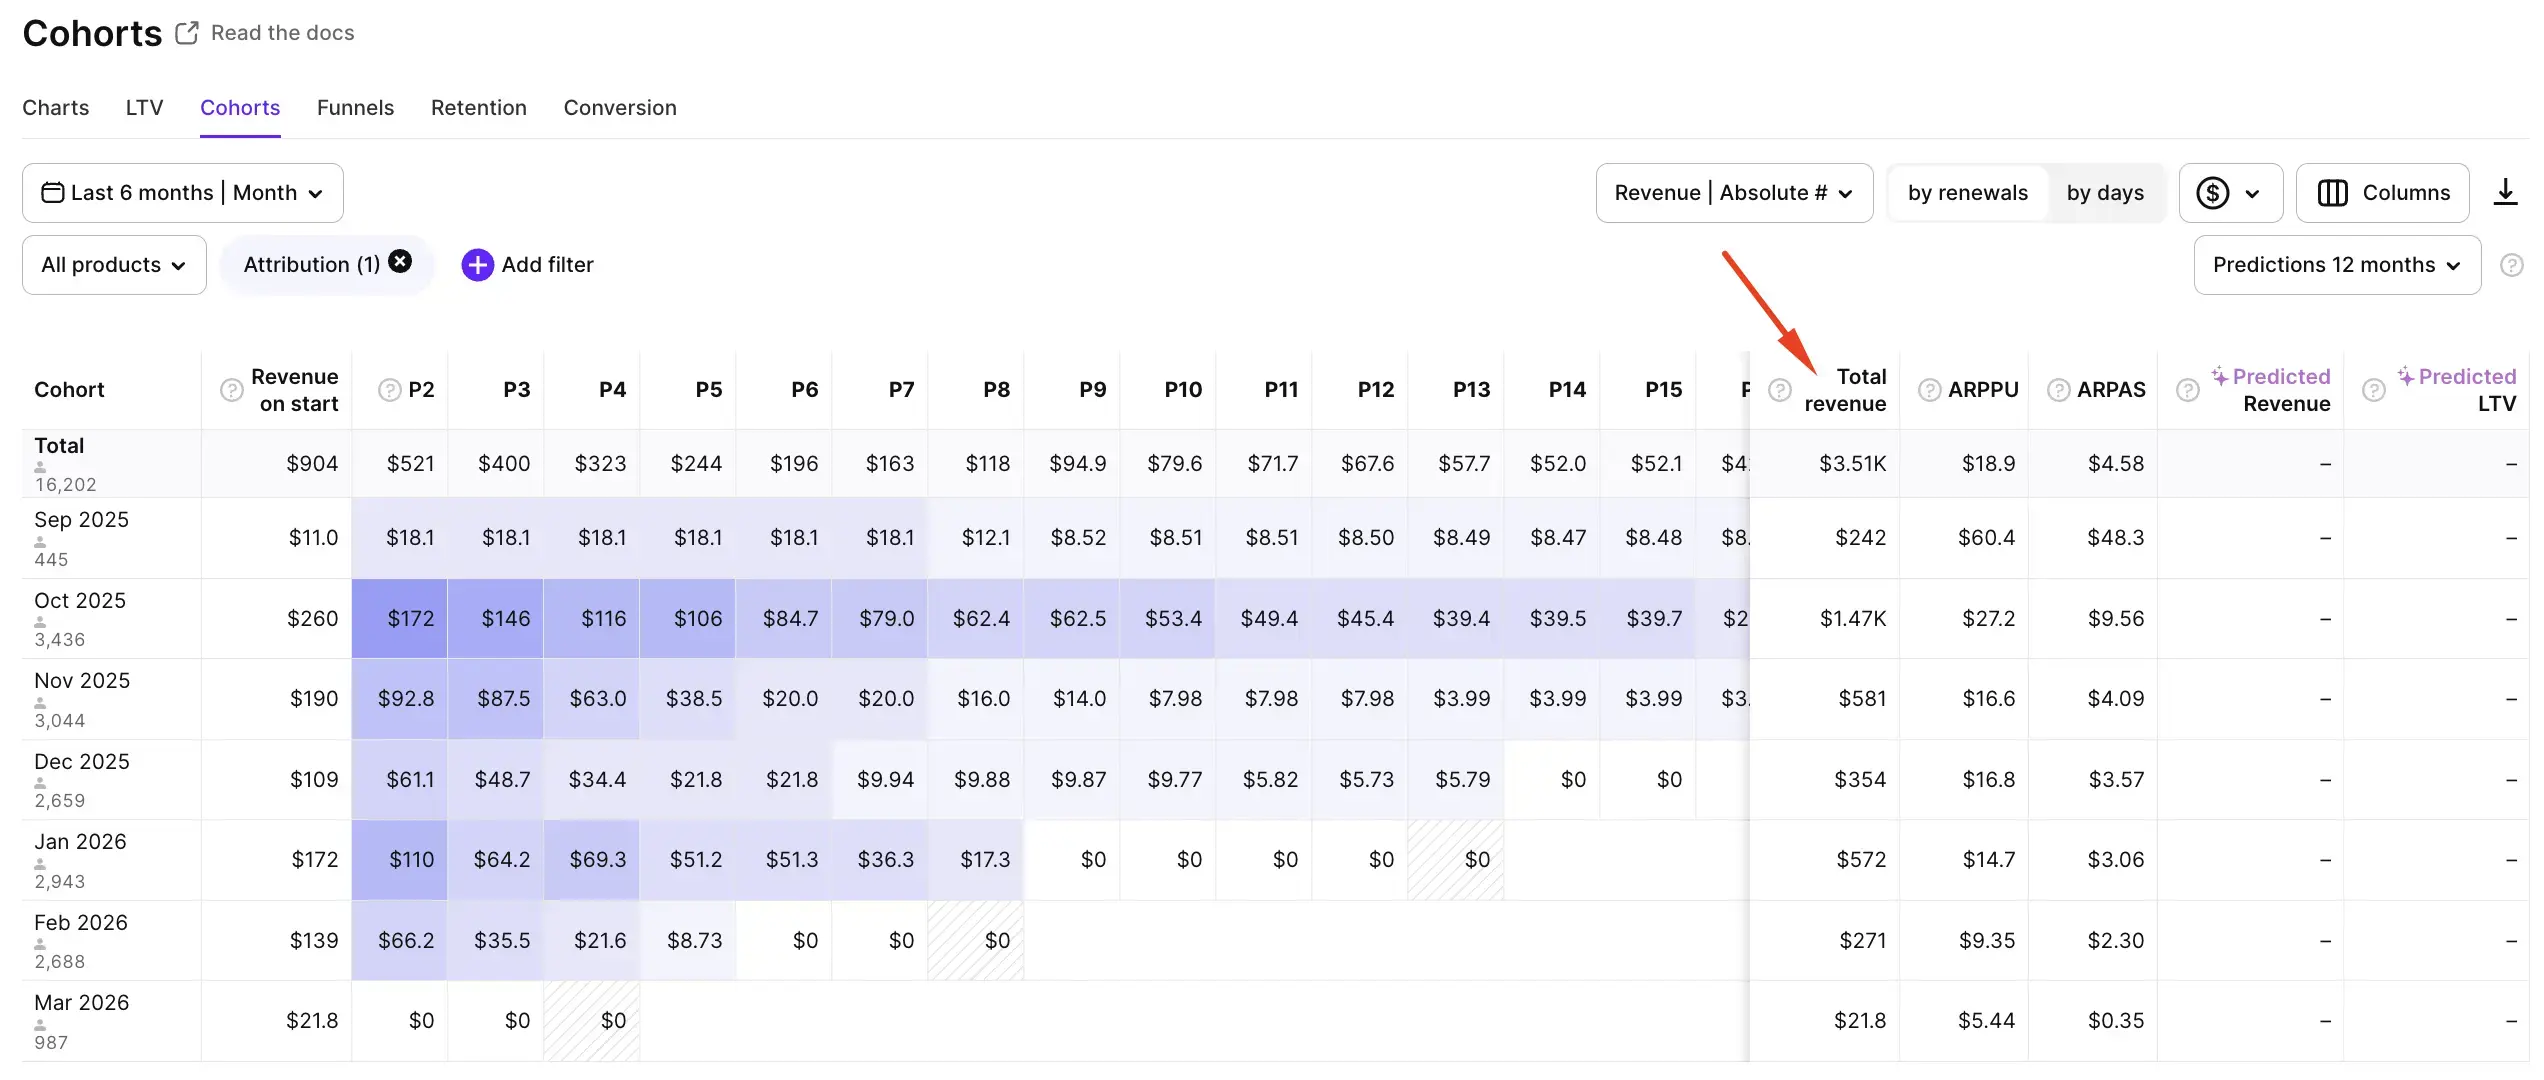
Cohorts table: rows = install dates, columns = cumulative revenue at each maturity period (W1, M1, M3, etc.). Use the Total Revenue column as the income side of your ROAS formula.
Step 4. Divide by spend. That's your actual ROAS.
What not to do: open Analytics → Charts → Revenue, copy the number for the same dates, and divide by spend. That's mixing revenue from different user populations with spend from one specific campaign.
Use the right revenue for the right question
Revenue Analytics answers one question: where is the money? Cohort Revenue answers another: where did the money come from? Both numbers are correct. The problem starts when they’re used interchangeably. Your Apple Ads team needs cohort revenue to measure performance. Your finance team needs cash flow for reporting and planning.
If you want to track your Appl Ads properly, Adapty has solid subscription analytics and a dedicated Apple Ads Manager tool built for exactly this. Free up to $5K/month.