TL;DR: Most UA managers optimize Apple Ads ROAS by adjusting bids or creatives. Almost nobody looks at the paywall price — and that’s where the real leverage often is. Brand traffic converts at higher rates and tolerates price increases better than any other segment. A structured A/B test on your paywall price — run against brand-traffic cohorts — can lift ROAS without touching your ad spend at all.
Your Apple Ads ROAS isn’t where it should be. You’ve already adjusted bids. You’ve refreshed creatives. You’ve tightened targeting. And the number still won’t move the way you need it to. Here’s what nobody tells you: you might be optimizing the wrong side of the equation entirely.
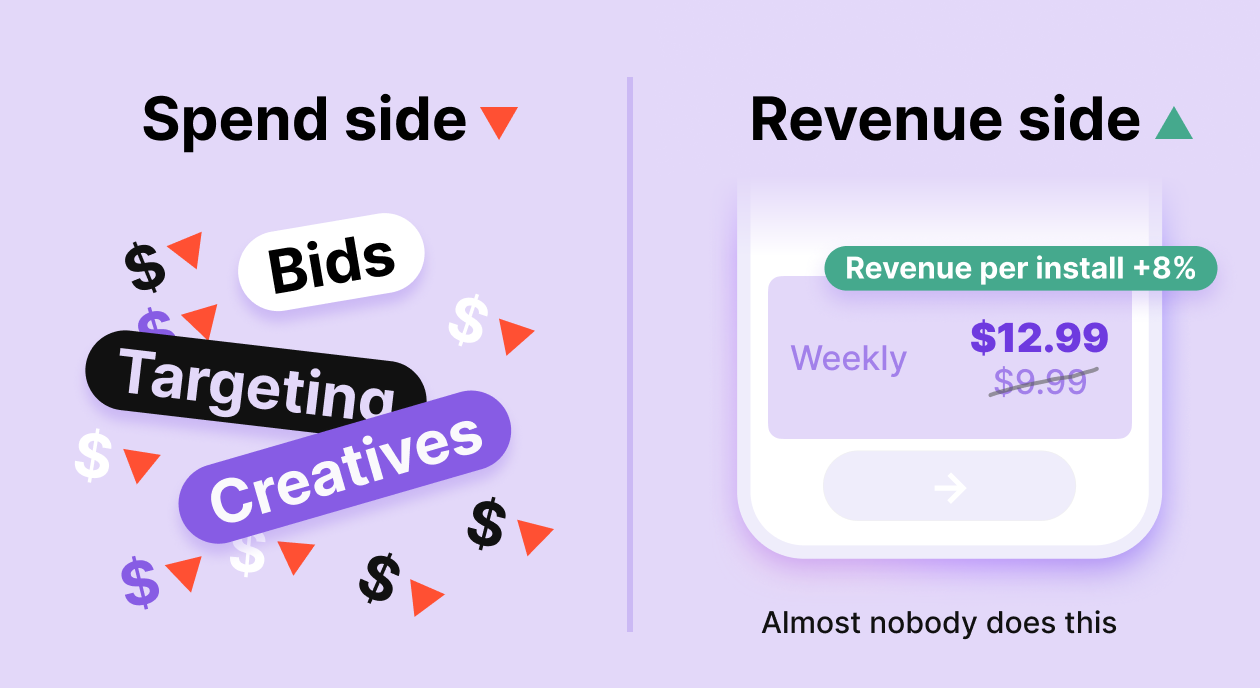
ROAS = revenue ÷ spend. Every optimization conversation in UA focuses on spend — how to get more installs for less money. But revenue per install is sitting right there, usually untouched, because changing it feels risky.
The paywall is where your ad spend either converts into revenue or doesn’t. And in most apps, the price on that paywall has never been seriously tested. Not because teams don’t want to — because they’re afraid a price increase will tank conversion and make everything worse. That fear is legitimate. But it’s also why most teams leave significant ROAS on the table for years.
There’s a way to test price increases with very low risk. It starts with one specific traffic segment that almost every app has — and almost nobody uses for pricing experiments.
And before we get into the mechanics: if you’re not yet tracking cohort revenue by campaign, the ROAS numbers you’re working with may already be wrong. Here’s why cohort revenue and Revenue Analytics will never match — and which one to use for ROAS calculations.
Why is ROAS a paywall problem, not just a media problem?
Let’s stay in the math for a moment. If you spend $10,000 on Apple Ads and generate $30,000 in subscription revenue, your ROAS is 3x. To reach 4x without changing spend, you need $40,000 from the same traffic — a 33% lift in revenue per conversion.
You have two ways to get there: more conversions or higher revenue per conversion. Most teams chase the first. But if your conversion rate is already reasonably optimized, squeezing out another 33% from the same traffic is brutal.
Raising prices is the other path. A 20% price increase on a cohort with stable conversion rates produces a direct 20% lift in revenue per subscriber — no additional traffic, no creative refresh, no bid war.
Why should you start with brand traffic, not all traffic?
The catch: you can’t test price increases indiscriminately. Run it on the wrong segment, and you’ll tank conversion rates and make the whole experiment worthless.
Brand traffic — users who search your app name directly in the App Store — behaves fundamentally differently from generic or competitor traffic.
| Signal | Brand traffic | Generic traffic |
| Intent | Already know your app, looking for it | Exploring, comparing, and price-sensitive |
| Conversion rate | Significantly higher | Lower, more variable |
| Price sensitivity | Low — they’ve already decided | High price is a key decision factor |
| Risk of price test | Low | High |
Brand searchers have already cleared your biggest conversion hurdle — awareness. They’re not comparing you to competitors. They’re not weighing whether to subscribe at all. They’re looking for you specifically.
That makes this segment price-inelastic relative to everything else in your funnel. A user who searches your app name and lands on a paywall that costs $2 more than last month is far less likely to drop out than a cold user encountering your app for the first time.
Start here, prove the thesis, then decide whether to extend it to broader traffic.
How do you run a price A/B test on brand traffic?
Here’s the full playbook. Cutting corners on any of these steps makes the results unreliable.
Step 1. Isolate your brand traffic
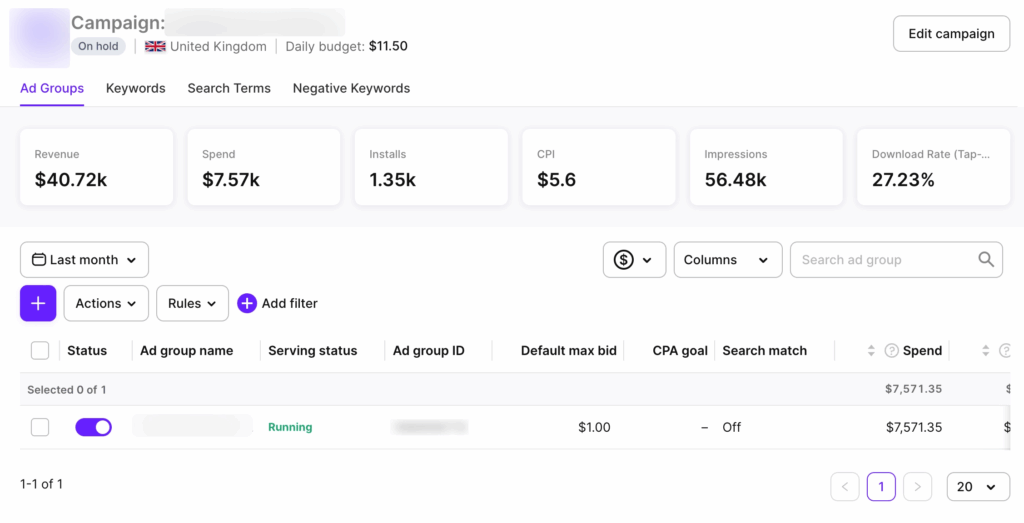
In Apple Search Ads, set up a dedicated campaign targeting only your branded keywords — your exact app name and close variants. Don’t mix this with generic or competitor campaigns. You need a clean cohort to measure against.
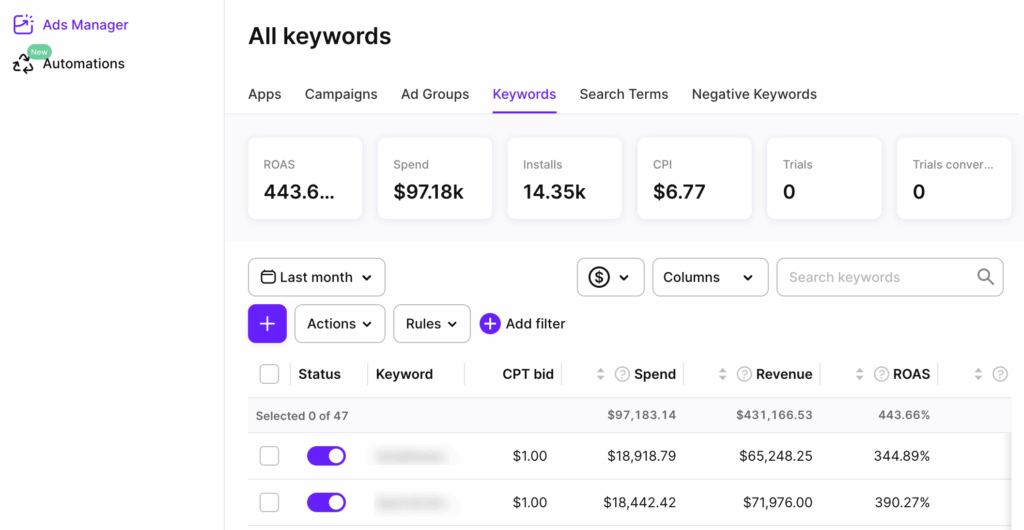
Then connect Adapty Apple Ads Manager before the test goes live. The native Apple Ads console shows you clicks, installs, and CPT. It won’t show you which brand keywords drove trials, which trials converted to paid subscriptions, or what those users’ LTV looks like three months out. Apple Ads Manager connects your campaign data to the full revenue funnel — installs, trials, subscriptions, and LTV.
Step 2. Define your price variants
Keep it simple: your current price as control, one higher price point as the test variant. Don’t test three price points at once unless you have very high traffic volumes — you won’t reach statistical significance fast enough.
Typical increments: 15–25% above the current price. Too small and the revenue delta won’t register. Too large and you risk overcorrecting if conversion drops.
Step 3. Set up the paywall A/B test without a new app release
This is where the operational side matters. You need to show different price points to different users without pushing an app update — otherwise, you’re stuck waiting on review cycles and can’t stop a test that’s going wrong.
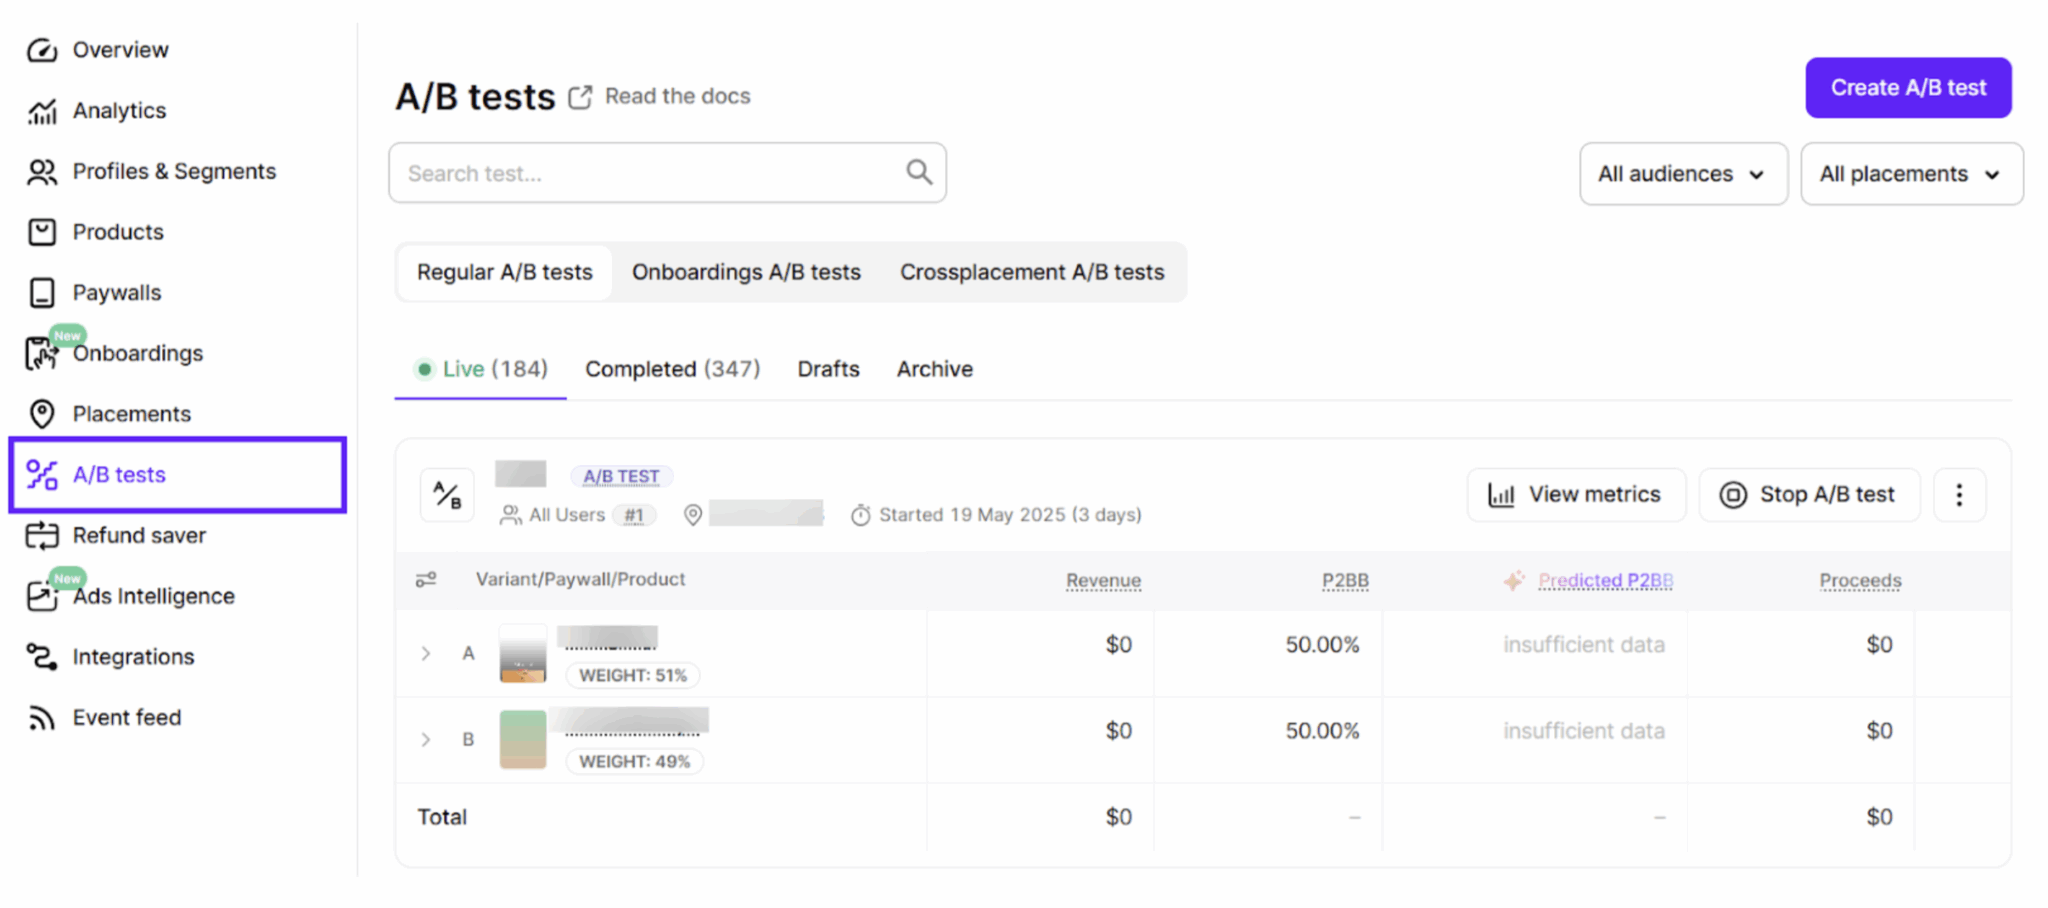
In Adapty, you set this up directly in the dashboard: create two paywalls with different price points, set up an A/B test in a placement, split traffic 50/50, and launch. No code change required after the initial SDK integration. Changes go live server-side, and you can stop or adjust the test at any time.
Step 4. Define success criteria before the test runs
This is the step most teams skip, and it’s the one that causes the most post-hoc rationalization. Write down your criteria before anything goes live:
- Primary metric: revenue per install from brand traffic
- Secondary metric: trial-to-paid conversion rate (if running trials)
- Guardrail metric: conversion rate floor — if the test variant drops more than X% below control, stop the test
- Minimum run time: at least 2 weeks, ideally 4. Weekly seasonality in Apple Ads traffic means a shorter window will skew results.
Step 5. Measure revenue per install, not just conversion rate
This is where Apple Ads Manager earns its place in the workflow.
The Adapty dashboard shows you paywall-level conversion and revenue. Apple Ads Manager shows you the upstream picture: which brand keywords drove the installs that entered each variant, what the trial-to-subscription conversion looks like by cohort, and whether LTV is tracking in the right direction. Together, you get the full chain — keyword to install to subscription to revenue — without stitching spreadsheets together or waiting on an MMP’s attribution window.
Your conversion rate on the test variant will likely drop slightly — that’s expected even with brand traffic. The question is whether revenue per install goes up despite the lower conversion rate.
| Metric | Control ($9.99) | Test ($12.99) |
| Installs from brand traffic | 1,000 | 1,000 |
| Conversion rate | 12% | 10% |
| Subscribers | 120 | 100 |
| Revenue | $1,199 | $1,299 |
| Revenue per install | $1.20 | $1.30 |
Conversion drops 2 points, but revenue per install climbs 8%. That’s a winning test — ROAS improves even though fewer people subscribed.
Step 6. Check LTV signals before rolling out
Short-term revenue per install doesn’t tell the whole story. Before declaring victory, look at early retention: day-7 and day-30 cancellation rates on the test cohort. If higher-paying subscribers cancel faster, the LTV picture is worse than the ROAS snapshot suggests.
Give yourself at least one renewal cycle of data before scaling the winning price to your full traffic mix.
What can go wrong — and how to avoid it?
Mixing cohorts. If brand traffic isn’t cleanly isolated and generic traffic bleeds into the test, results become unreliable. Separate campaigns are non-negotiable.
Running it too short. Apple Ads traffic has weekly seasonality. Minimum two weeks. Four is safer.
Calling it too early. Random variance early in a test can make either variant look like a winner. Don’t make decisions before you have enough data — Adapty shows the probability of each variant being the best, so you can see when one variant has pulled clearly ahead.
Ignoring the guardrail metric. If conversion drops past your floor, stop the test. The guardrail exists for a reason.
Testing during seasonality windows. Avoid back-to-school, New Year, Black Friday. User intent shifts enough to make results unrepresentative.
Should you roll it out beyond brand traffic?
If the brand traffic test wins — revenue per install up, LTV signals stable, conversion drop within range — you have two options.
Option A: Keep the higher price on brand traffic only. This makes sense if your generic or competitor traffic is more price-sensitive and you want to optimize differently by segment. Adapty’s audience targeting lets you run different paywalls for different user segments without touching your app code.
Option B: Roll it out broadly. If the brand test gives you confidence that your price was generally too low, extend to all traffic — but monitor generic conversion rates closely for the first few weeks. Treat the broader rollout as a separate test, not an automatic extension. For a full framework on what to test next — copy, design, trial length — the paywall experiments playbook covers the sequencing in detail.
Teams that test price increases on broad traffic first usually see conversion drop sharply and abandon the experiment. Teams that start with brand traffic get cleaner signal, more confidence, and a much better chance of shipping a price increase that actually sticks.
OAS optimization doesn’t start and end with bids
ROAS optimization doesn’t start and end with bids. The paywall price is one of the highest-leverage variables in your funnel — and it’s one of the least tested.
Brand traffic gives you the safest environment to find your real price ceiling. Run the test properly, measure the right metrics, and check LTV before you scale.
If you want to run paywall price tests without releasing new app versions, Adapty handles the setup in a few clicks — A/B testing, traffic splits, real-time analytics, and audience targeting are all built in. Free up to $5K/mo in revenue. Sign up free or schedule a demo!