TL;DR
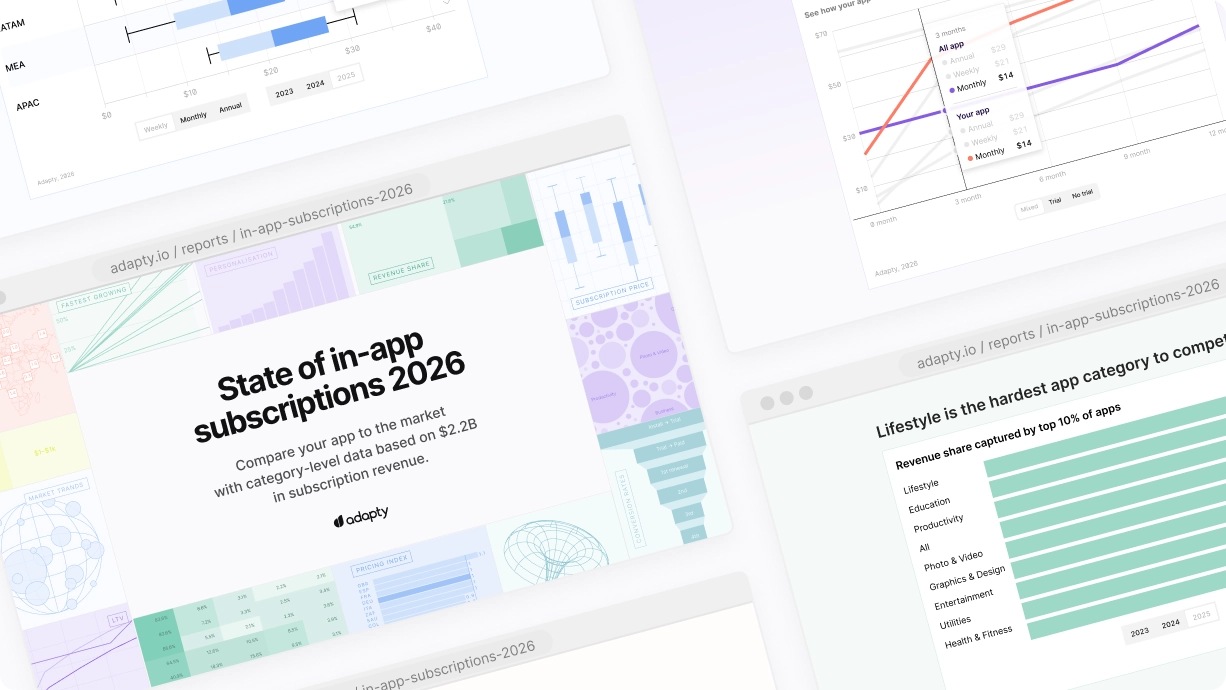
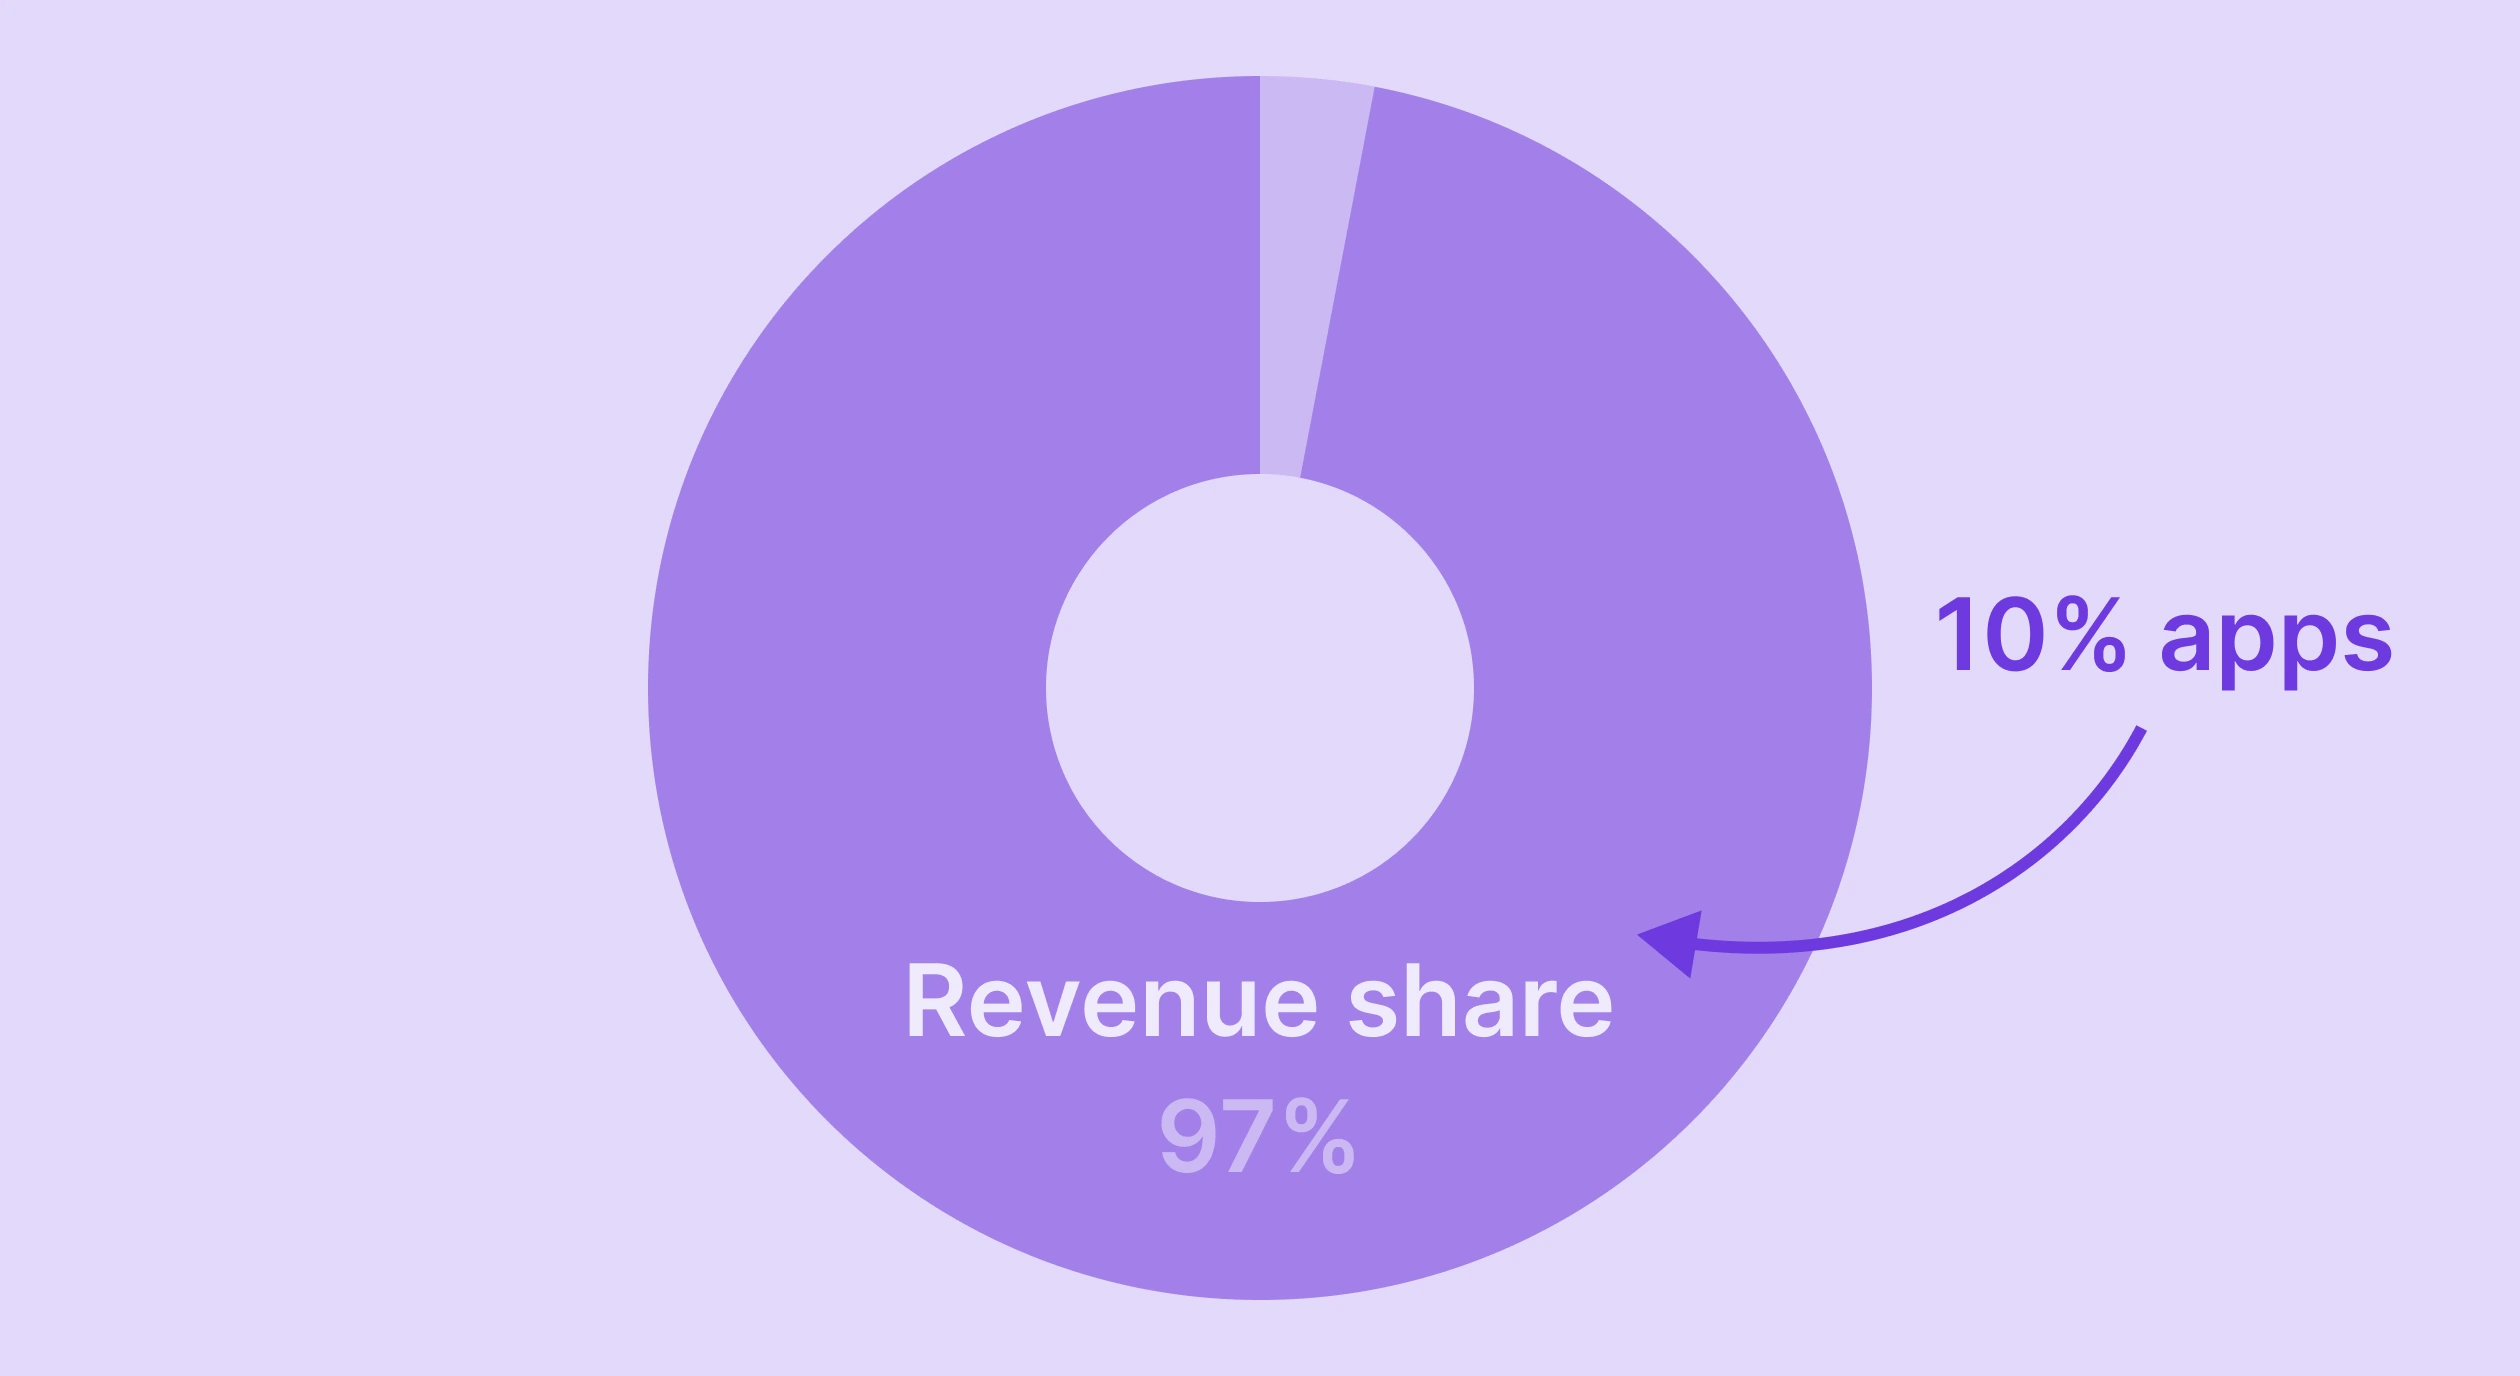
- The top 10% of apps now capture 94.5% of all subscription revenue — up from 92.7% in 2023
- Median monthly revenue dropped 22% year-over-year as 31% more apps entered the market
- Weekly plans have cannibalized both monthly and annual simultaneously: 43.3% → 55.5% in 24 months
- 57.7% of new apps never cross $1,000. For most of them, this isn’t a monetization problem
- Apps running 50+ experiments earn 18.7x more than one-experiment apps
- The tactics that work at the 95th percentile don’t apply at the 40th
Every year, more apps launch. And every year, a smaller slice of them captures more of the money.
The top 10% of apps now take 94.5% of all subscription revenue — up from 92.7% in 2023. At the same time, 31% more new apps were launched in 2025 than in 2024, while the true median monthly revenue dropped 22% year-over-year, from $627 to $492.
More apps. Less revenue per app. A concentration curve that keeps climbing.
This is structural, not cyclical. And it has different implications depending on where your app sits in the distribution.
Here’s what the data from Adapty’s 2026 State of in-app subscriptions report says about it, and what it means for the decisions you’re making right now.
What does the revenue distribution look like?
Let’s start with the number most people don’t want to say out loud.
57.7% of new subscription apps never cross $1,000 in total revenue. Another 22.4% earn between $1,000 and $10,000. Combined, 8 in 10 new subscription apps never break $10,000. Only 7.9% cross the $100,000 threshold.
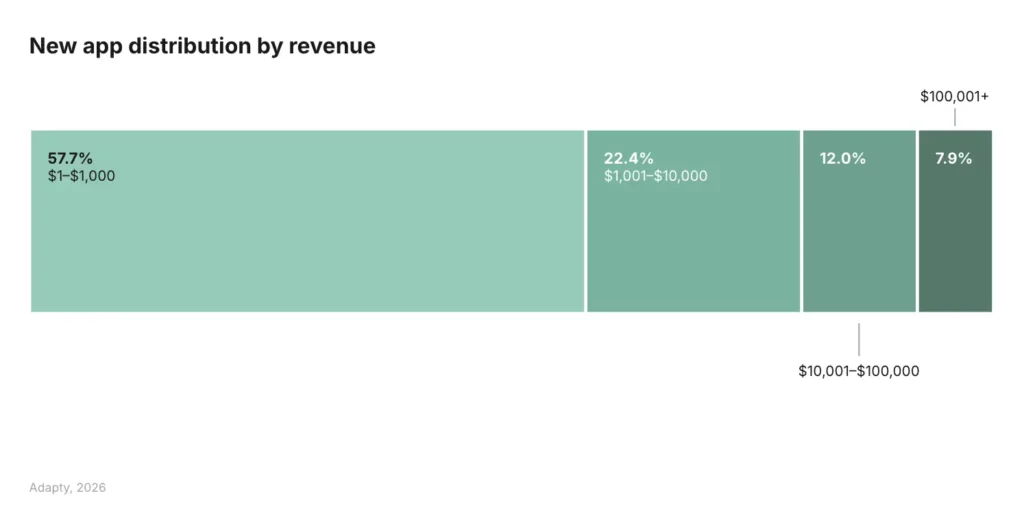
That’s the actual distribution. The $1,000-$10,000 bracket is the most dangerous zone — you’ve proven demand, but you haven’t reached the scale where sophisticated monetization mechanics actually compound.
What this means in practice: if you’re below $100K in annual subscription revenue, the tactical conversation about paywall design, trial length, and A/B testing is largely premature. Below that threshold, you’re almost certainly dealing with a product-market fit problem. No pricing optimization rescues an app that users don’t find compelling enough to pay for.
What I see teams do wrong at this stage is layer complexity onto something that doesn’t have the core working yet. You can have the most optimized paywall in the category and still make nothing if the app isn’t solving a real problem. The data doesn’t care how beautiful your trial flow is.
Above $100K is where the report’s insights start to bite — not before.
Why is concentration increasing when the market is also growing?
Global in-app purchase revenue is projected to reach $210 billion in 2026. That’s real growth. So how does the market grow and consolidate simultaneously?
The answer is that scale advantages in subscription apps compound in a way that doesn’t exist in, say, ad-supported apps. Apps with more revenue can run more experiments. More experiments produce more optimization. More optimization produces higher LTV. Higher LTV enables higher CAC spending. Higher CAC spending buys more installs. The flywheel accelerates — but only once it starts spinning.
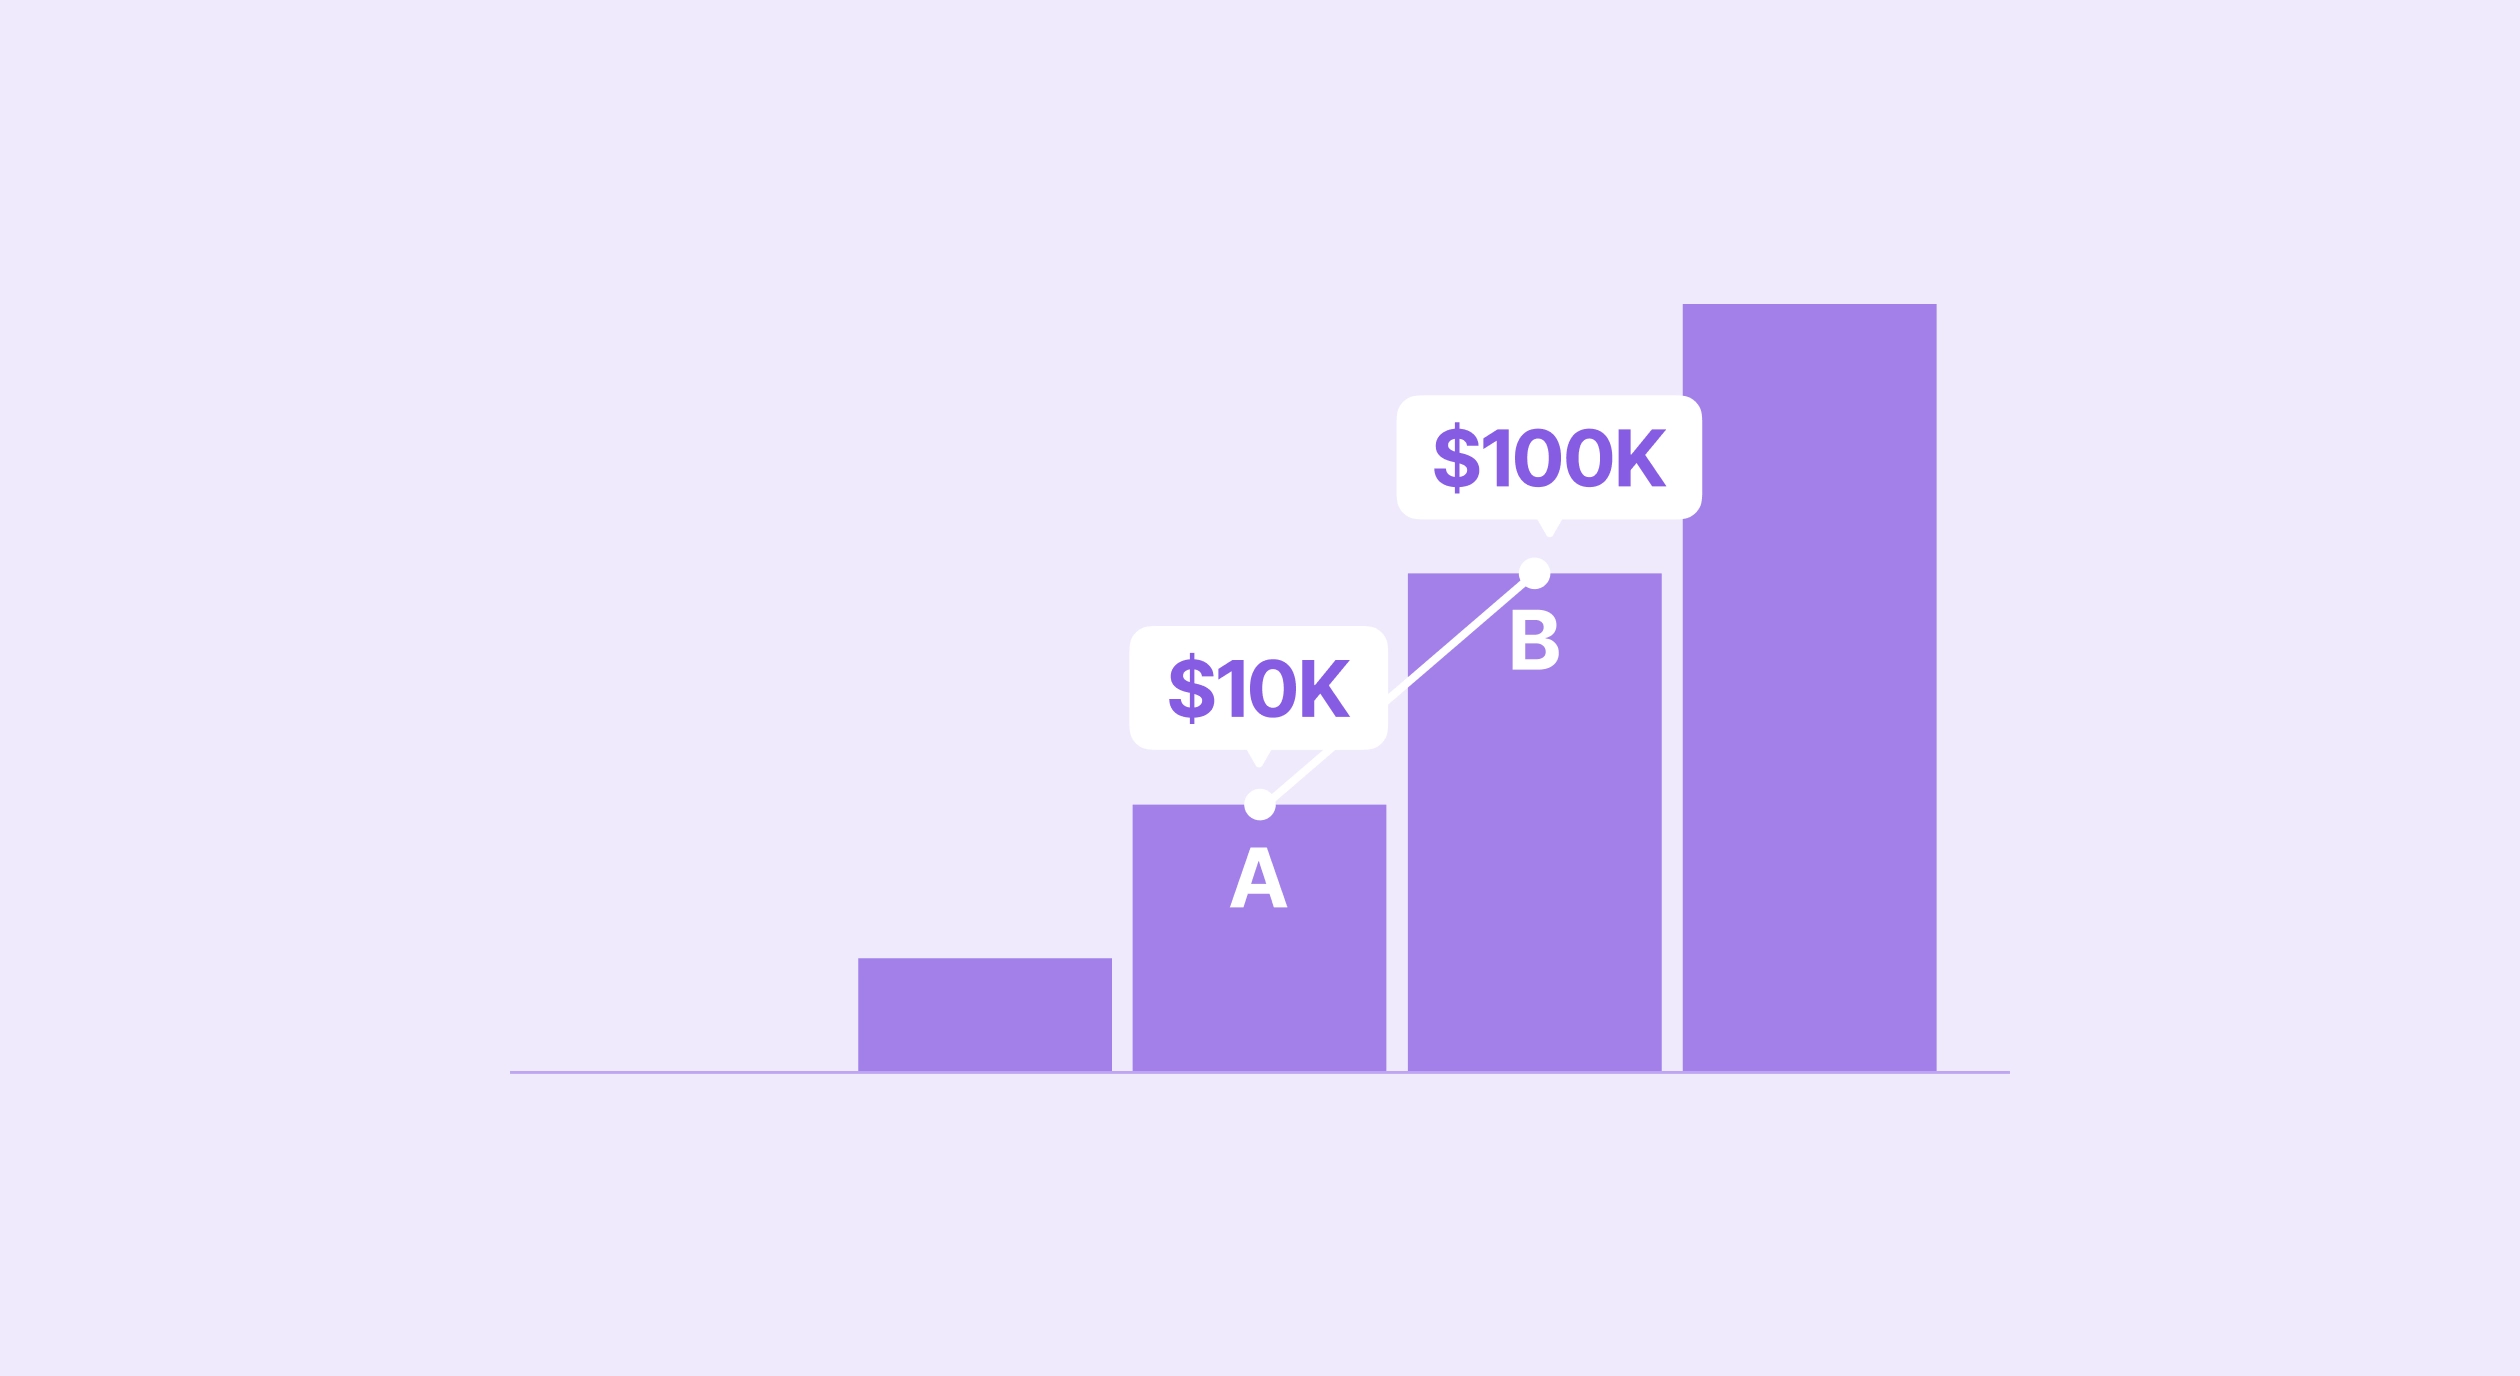
Apps running 50+ experiments have a median revenue of $914,734 versus $48,848 for apps running just one. That’s an 18.7x premium — on top of an already elevated baseline from having run a single experiment at all.
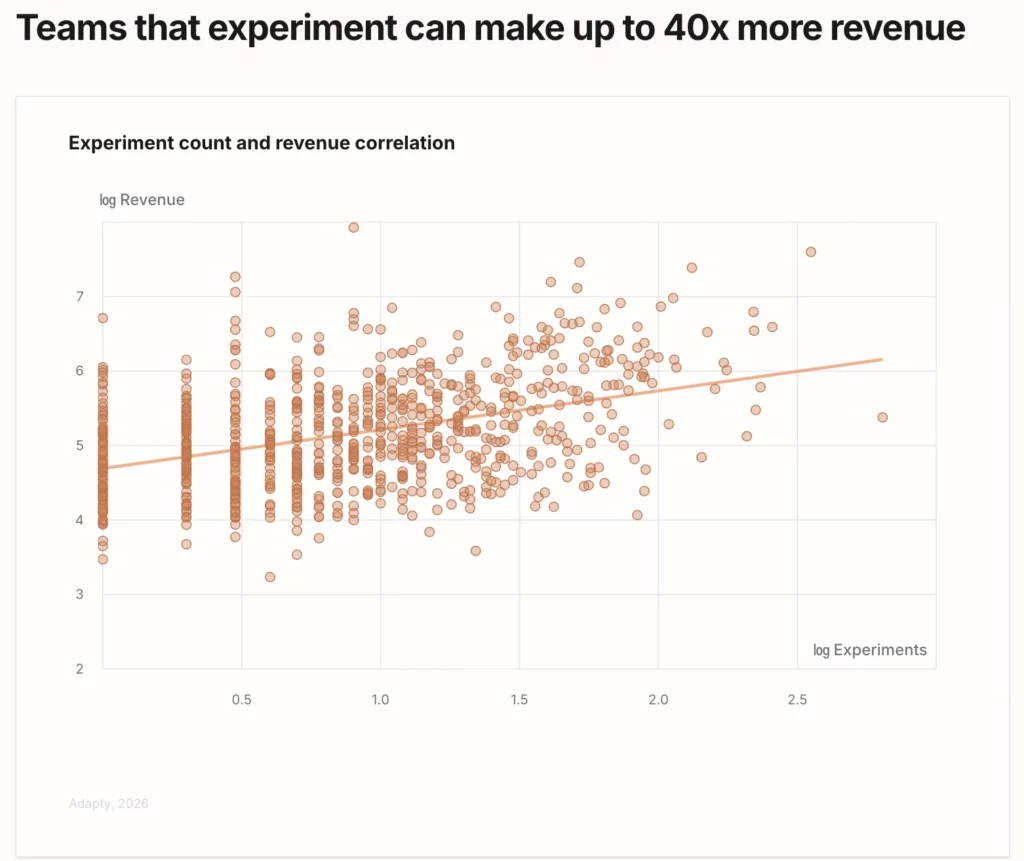
The average number of experiments per year among top-performing apps is 14.7.
Experimentation cadence is a proxy for organizational maturity. The teams running 30, 40, 50 tests a year aren’t smarter. They’ve just built the infrastructure to move fast. That infrastructure is itself a competitive advantage that smaller teams struggle to close.
This is what consolidation actually looks like at the operational level — not just big apps beating small apps, but high-velocity teams outrunning low-velocity ones.
What’s happening to the plan duration landscape?
The shift here is faster and more decisive than most teams realize.
55.5% of all app subscription revenue now comes from weekly plans — up from 43.3% two years ago.
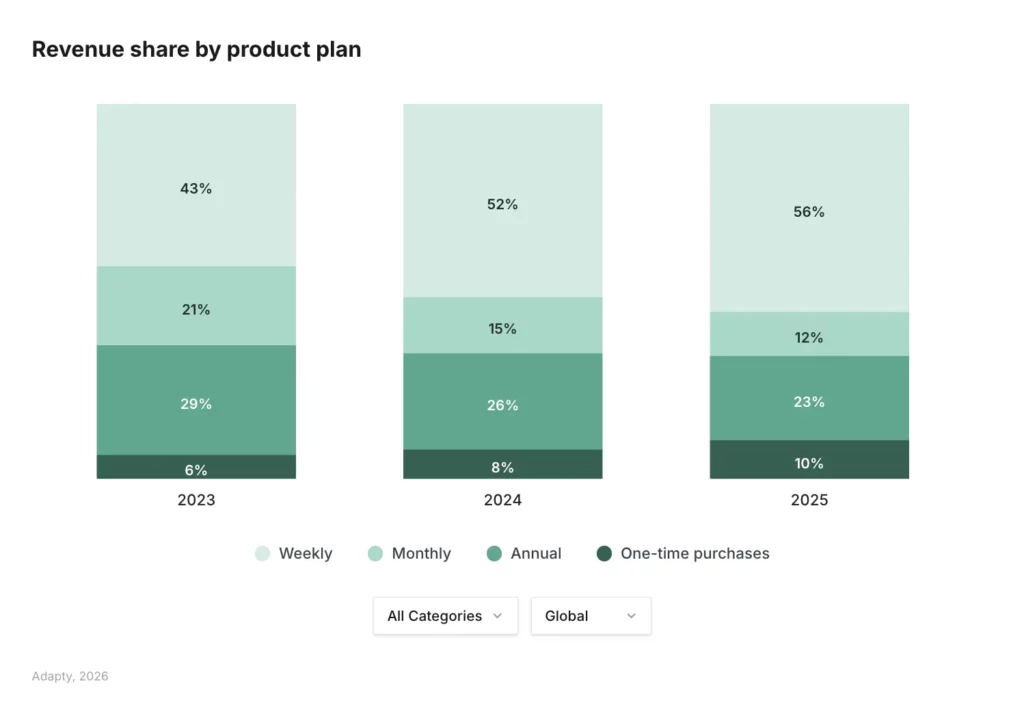
Monthly plans lost nearly half their revenue share in the same period (21.1% → 11.7%). Annual dropped too (29.2% → 22.5%). Weekly didn’t just grow — it cannibalized both simultaneously.
The mechanics driving this are clear from the funnel data. At upper-mid pricing, the install-to-trial conversion is 9.8% for weekly versus 1.8% for annual. Monthly sits at 0.3% — essentially a dead zone at the top of the funnel: too expensive to feel low-risk, too short to feel like a commitment.
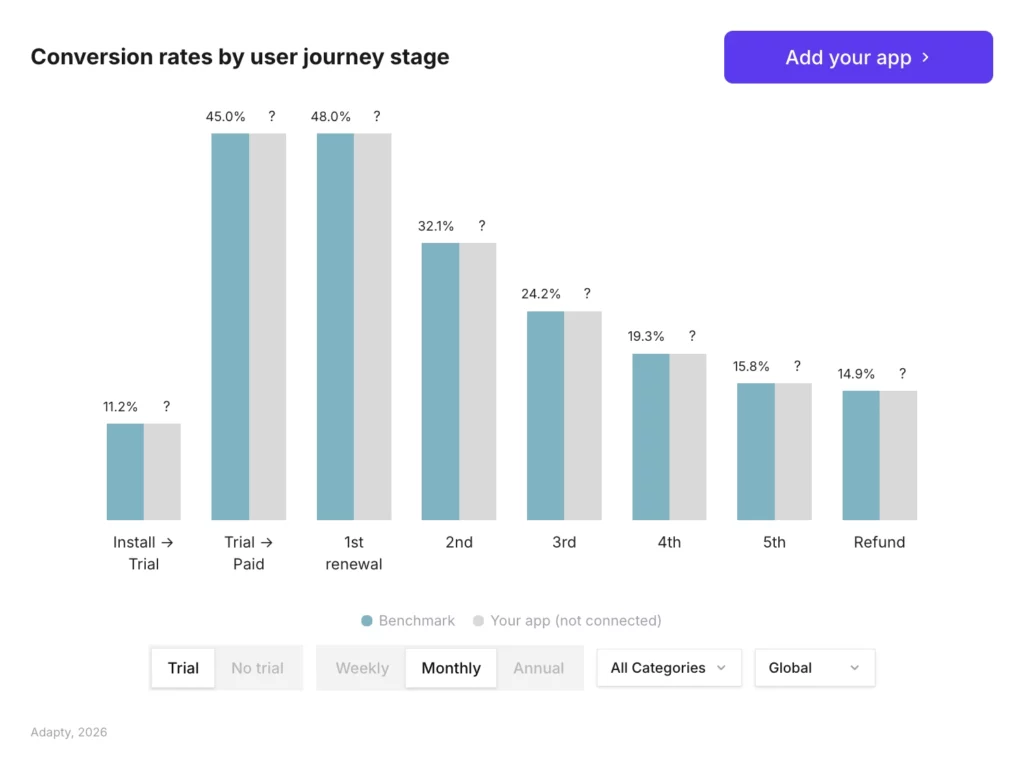
The counterintuitive part is what happens to LTV. A weekly+trial cohort starts at $7.40 on Day 0 and reaches $54.50 at Day 380 — a 636% growth rate. Annual+trial goes from $42.08 to $49.92 — an 18.6% increase. The paywall that looks worst on your Day 0 dashboard is delivering the best 12-month results.
Health & Fitness is the notable exception: the only category where annual plans still dominate, at 60.6% revenue share.
Why is Lifestyle the hardest category to build a subscription business in?
The concentration data tells a brutal story by category. And Lifestyle is the worst of it.
97.9% of all Lifestyle subscription revenue goes to the top 10% of Lifestyle apps — leaving 2.1% for the rest.
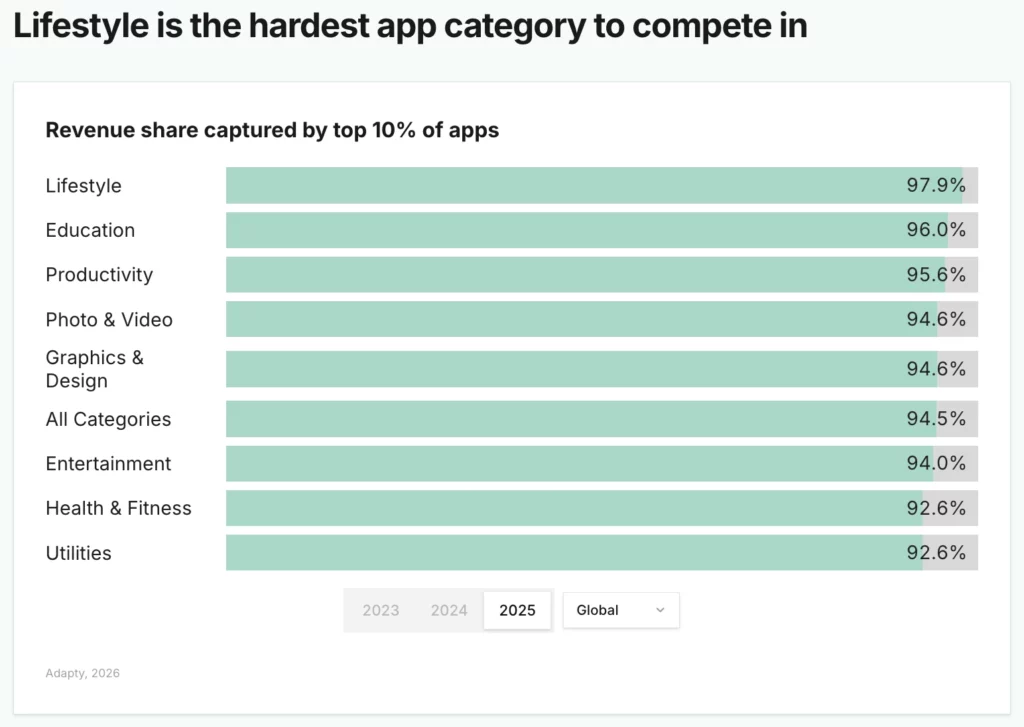
For context, the overall market figure is 94.5% — already extreme. Lifestyle is nearly three points beyond that.
Then layer on the trial problem. Trials in Lifestyle apps actively reduce LTV by 21.2% — the only category in the report where this happens. So you’re competing for scraps of a concentrated pie, and the default growth tactic — add a free trial — is making your subscribers worth less, not more.
The explanation comes back to what Lifestyle apps actually are. Journaling, habit tracking, meditation, wellness routines — the value is entirely self-generated. Trial users in these categories are disproportionately experimenters: people looking for motivation they haven’t found yet. They start a trial, don’t build the habit, and churn. Your direct buyer has already decided.
If you’re building in Lifestyle: hard paywall, direct purchase, no trial is worth testing seriously. The revenue ceiling for most entrants in this category is effectively zero.
What does the AI app data show?
AI apps are the most discussed category in mobile right now, and the data is more nuanced than the hype suggests.
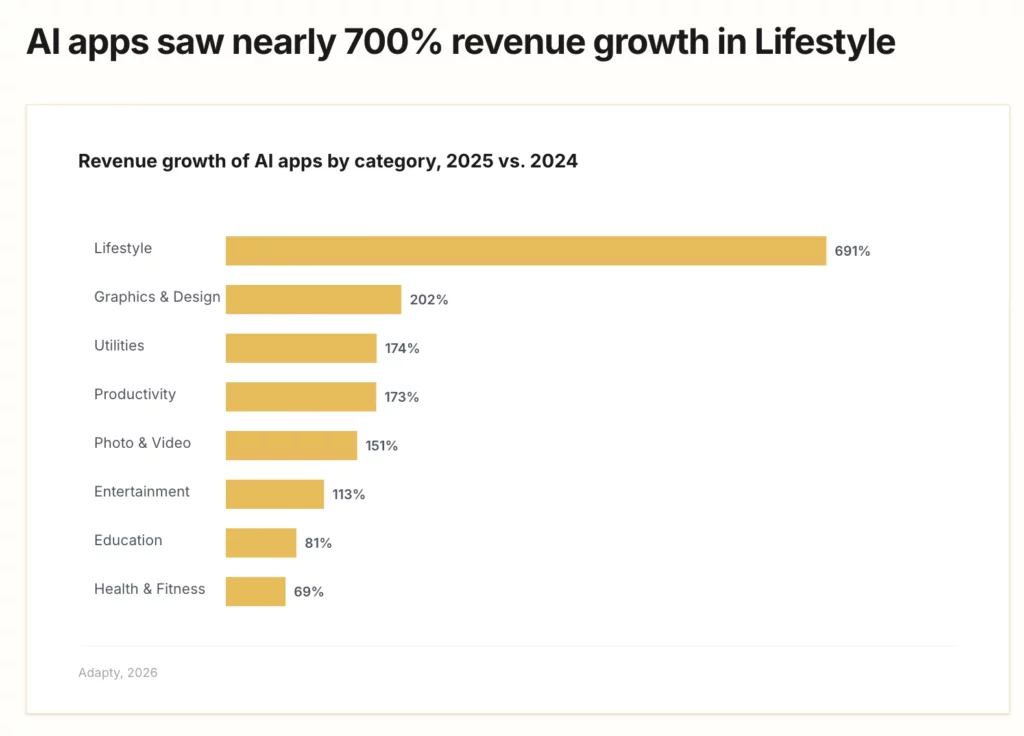
691% YoY revenue growth for Lifestyle AI apps in 2025 — Graphics & Design AI at 202%, Utilities AI at 174%.
AI-powered apps convert into trial at roughly half the rate of average apps — 5.31% install-to-trial versus 10.92% for the broader market. But they get 14% more direct purchases than average. Users approaching an AI app are more likely to pay outright than to trial. The intent profile is different.
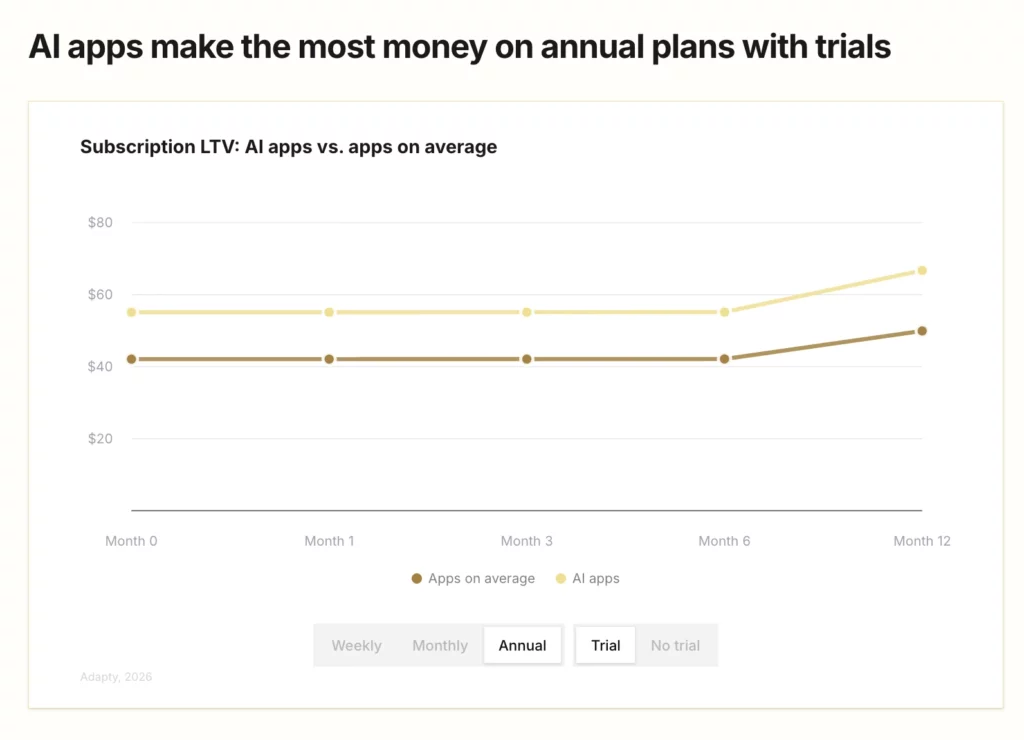
Where AI apps pull ahead is on LTV. Annual plans with trials generate $66.70 in one-year LTV versus $49.92 for average apps. AI apps charge more, retain differently, and still come out ahead on the 12-month number.
But here’s what the growth numbers don’t show: AI lowered the cost of building an app dramatically, which means the supply side expanded just as fast as demand. The result is a category with extraordinary revenue growth at the top and extreme crowding everywhere else.
The paywall implication: AI apps behave more like software tools than traditional subscription apps. Higher price points and annual plans with trials reflect the purchase psychology better than the weekly trial model that dominates elsewhere. If you’re running an AI-powered app on a standard weekly trial setup because that’s what the broader benchmarks recommend, you’re almost certainly leaving revenue on the table.
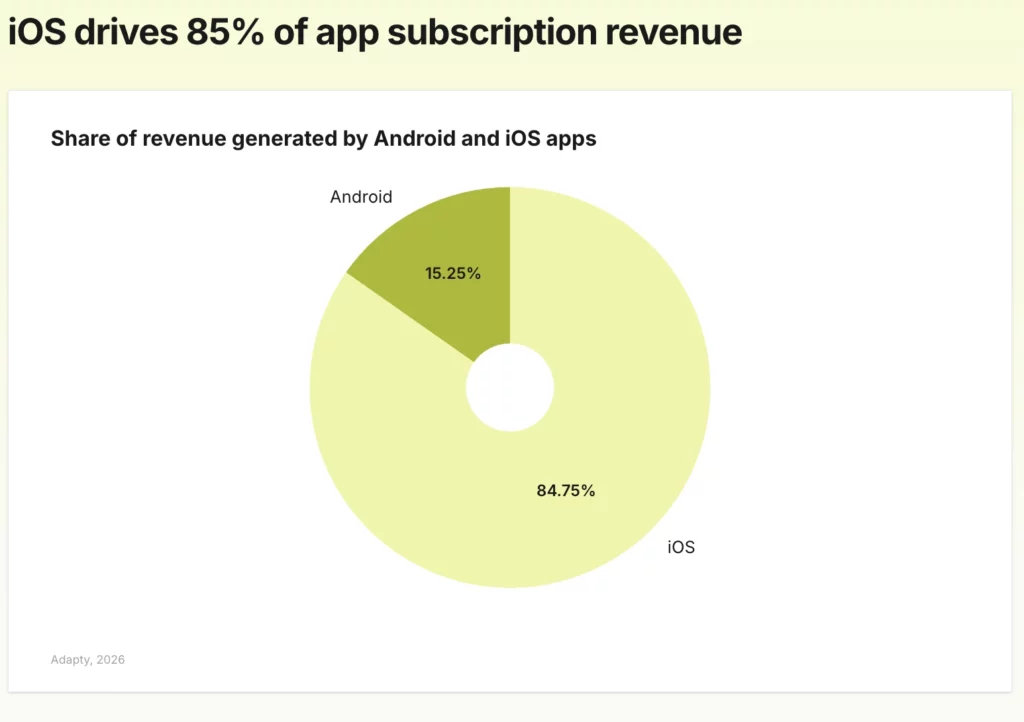
Why do iOS and Android need completely different strategies?
Android has 70% of global mobile users. It captures 15.25% of global subscription revenue. iOS has the rest — a 5.5× revenue differential per subscriber.
Every 1% conversion lift on iOS is worth approximately 5.5× the same lift on Android in absolute revenue terms. What this does not mean is that Android is irrelevant. It means Android needs a different strategy, not an iOS strategy copied and pasted onto a different platform. Android users have different price sensitivity, different payment method preferences, and different conversion psychology.
What does this mean if you’re not in the top 10%?
This is the actual question, and it has different answers depending on where you are.
Below $10K: The report’s tactical advice is not for you yet. The priority is validating that the core product solves a real problem — not optimizing the paywall in front of it. Run the cheapest possible test on your core value proposition before investing in monetization infrastructure.
$10K–$100K: This is where product-market fit starts converting into revenue, but the flywheel isn’t spinning yet. The highest-leverage work is structural: moving to weekly if you’re not there, auditing trial architecture against your category norms, and starting the experimentation habit — even one test per month gets you into a meaningfully different revenue tier than zero.
Above $100K: You’re now competing with teams running 15+ experiments per year, localized across multiple markets, with every structural paywall variable tested. The question becomes velocity. How many experiments can you run this quarter?
The consolidation story is real, but it isn’t inevitable at the individual app level. The 7.9% of apps that crossed $100K didn’t do it by copying the top performers’ pricing. They did it by building the infrastructure to test and iterate faster than the competition.
The gap between the top 10% and everyone else isn’t primarily a product gap or a pricing gap. It’s an experimentation velocity gap — and that’s actually the more solvable problem.