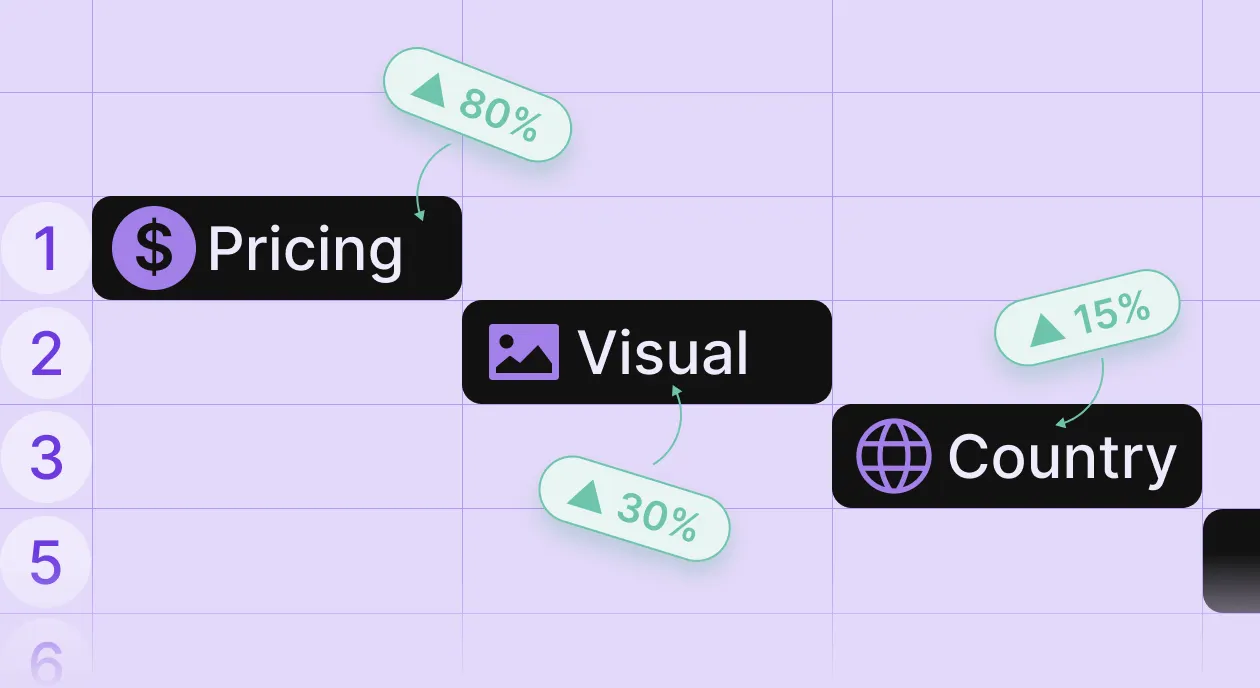
In the last four months, we’ve seen a pattern repeat across hundreds of apps in our network. An app runs the same pricing for years. Never question it. It works, so why change it? Then someone finally tests it. Price goes up 30%. Conversion drops 3-5%. Revenue jumps 25-30%. The math is brutal: they’ve been undercollecting for years because nobody questioned an old assumption. This happens in 60% of apps we analyze. Not 6%. Sixty percent.
Here’s the data point that matters: apps running continuous experiments make 74% more MRR than apps that don’t. Most teams know they should test more. They just don’t, because testing means extra work piled on top of everything else. That’s what’s shifting right now. Not because AI suddenly got smarter, but because the friction between “we should test that” and running the test is collapsing.
Here’s what teams are testing now that they weren’t six months ago. Here’s what’s working. Here’s where it breaks down. Here’s the 74% MRR gap and which side you’re probably on.
What stops teams from running more experiments?
The problem isn’t that growth teams don’t know they should experiment more. They do. Every Head of Growth has a list of tests they’d love to run. The problem is economics.
Running a proper pricing test means:
- Research (what are competitors doing, what does our data suggest)
- Hypothesis formation (which price points, which segments)
- Technical implementation (engineering time to split traffic)
- Monitoring (daily checks on conversion, revenue, statistical significance)
- Analysis (did it work, why, what’s next)
If you’re efficient, that’s 15-20 hours of work across growth, product, and engineering. Most teams can run maybe one pricing test per quarter at that pace. Meanwhile, your CEO wants three new features shipped. Your CPO has a roadmap. Your Head of Product is underwater with bugs. And you’re being asked to justify pulling engineering time to test whether $11.99 converts better than $9.99.
Most growth teams choose the feature. Ship something new. At least there’s a launch to point to. The pricing test gets pushed to next quarter. Then the quarter after. Then it becomes “we should probably test that someday.”
This same pattern plays out across growth: creative testing, paywall design, funnel optimization, and offer positioning. The cost of running experiments is higher than the cost of shipping features. So teams choose features.
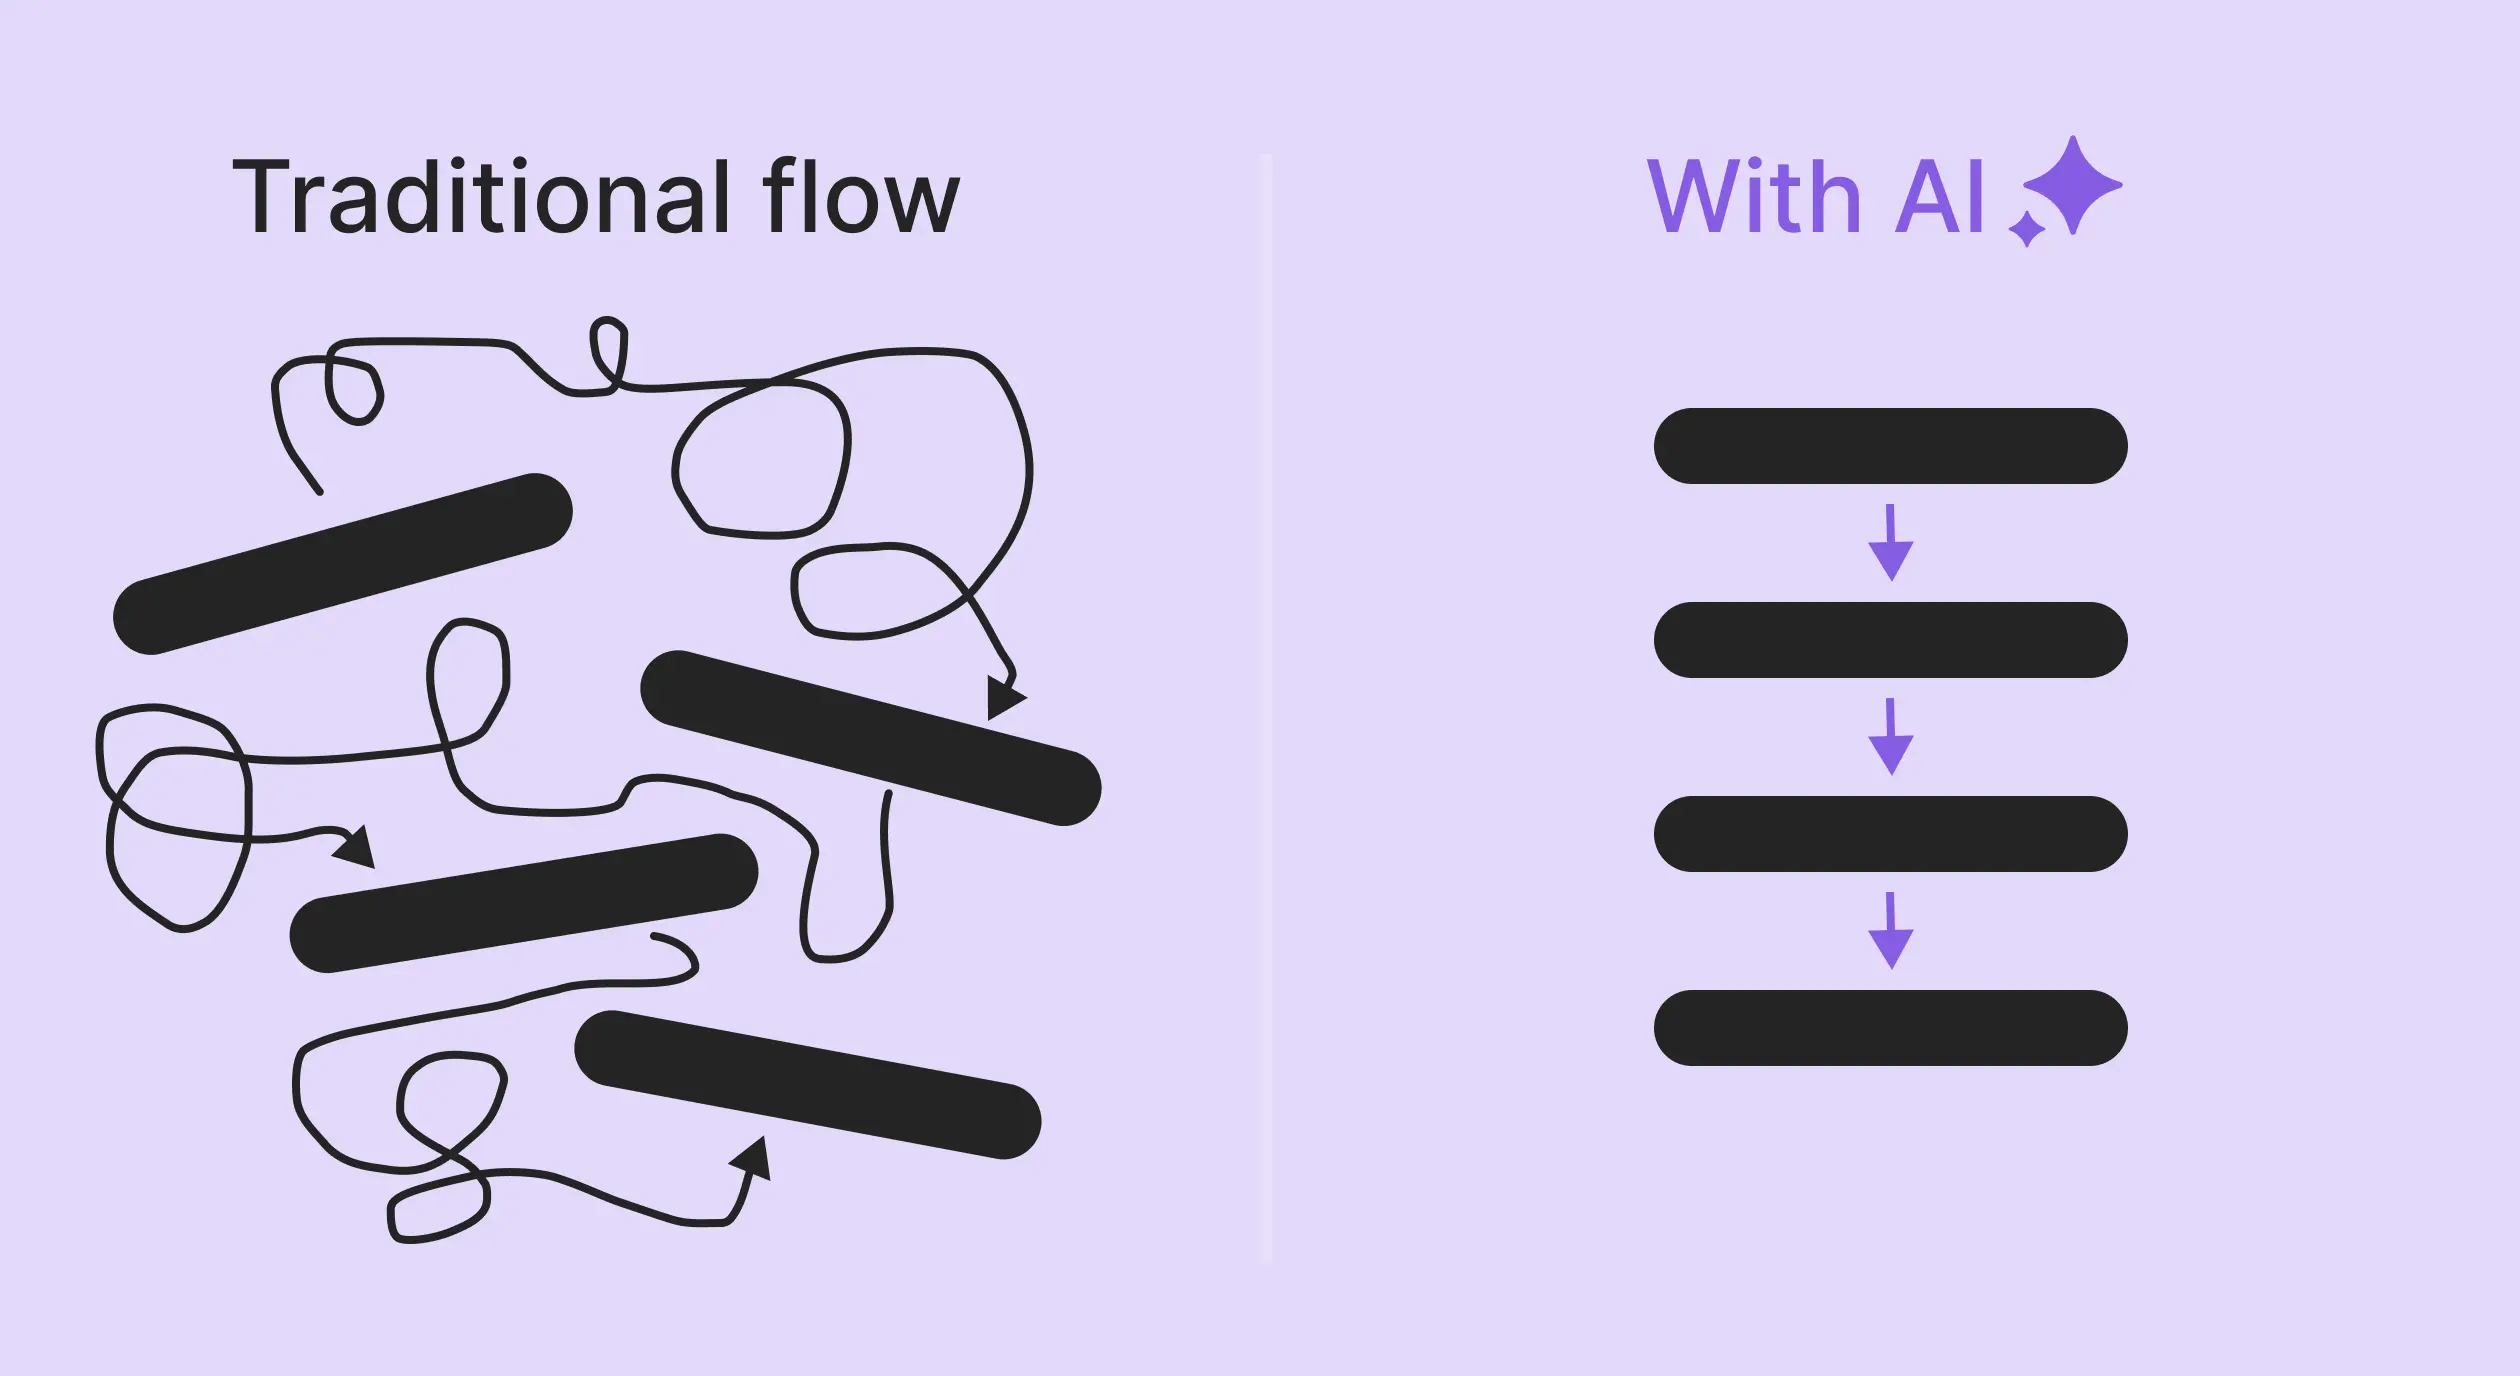
What’s changed in the past 12 months is the cost structure. When systems can do the research, build the hypothesis, flag when results are significant, and queue up the next test, the 15-20 hour commitment drops to 2-3 hours of review and approval.
The economics flip. Running six tests in a quarter becomes easier than shipping one feature. And the teams that figure this out first are opening up that 74% MRR gap.
4 AI-powered mobile growth strategies producing real results
Let me show you four specific implementations producing measurable results.
1. AI-driven pricing optimization: How often should you test?
Here’s the pattern we keep seeing: apps test pricing once, maybe twice a year. They pick a price that feels right, launch it, and move on. Testing more often requires research, engineering time, and monitoring – work that’s hard to justify when the roadmap is packed.
That calculation is flipping.
A productivity app had been optimizing for months. New paywall designs and visuals. Different headlines, benefit copy, and CTAs. Manual price changes in App Store Connect.
These tweaks helped engagement, but none created a step change in revenue. The team felt they were “within 5 to 10% of the best we could do.” So they kept polishing the same structure instead of questioning it.
Then they tried Autopilot. The tool analyzed their current plans and prices, pricing patterns of similar productivity apps, and anonymized benchmarks across thousands of subscription apps.
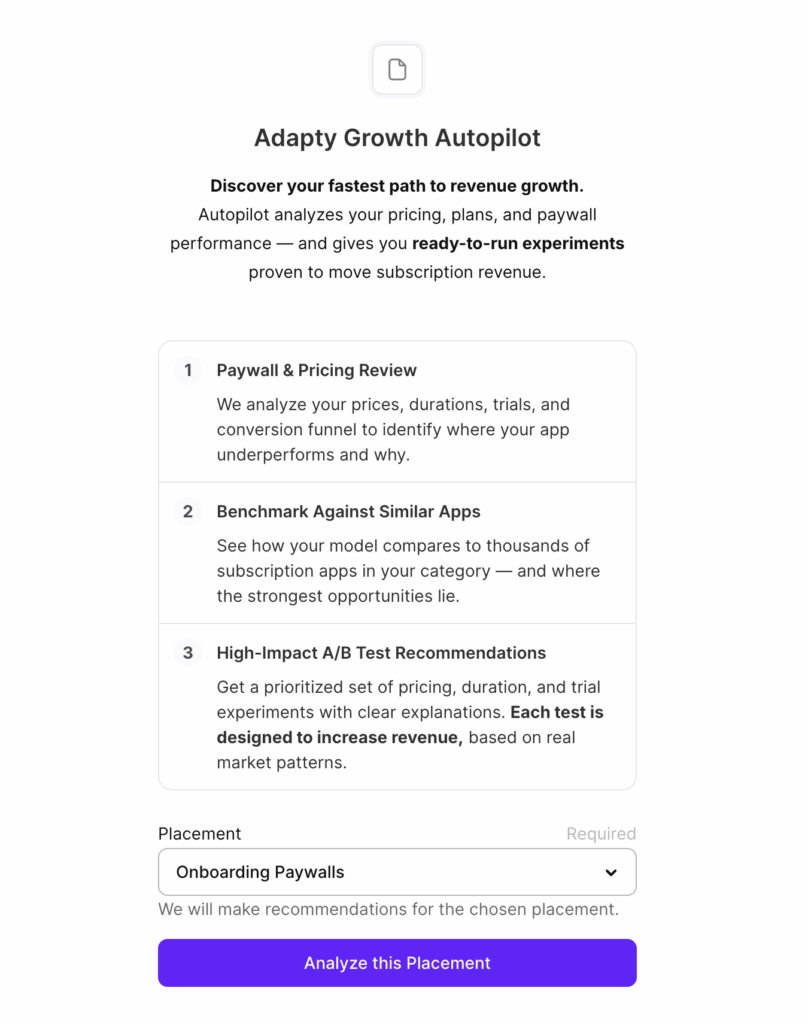
The analysis surfaced three clear gaps:
- Add a weekly plan to highlight the cost-saving benefits of annual
- Change annual plan pricing to capture more revenue without breaking conversion
- Introduce a free trial to reduce friction for first-time subscribers
The team ran the experiments in sequence over eight weeks. During testing, there were no large spikes in ad spend or big launches. The team credits the new pricing structure and trial for most of the uplift.
The biggest advantage was measurement clarity. Each experiment ran separately with clear windows between them, so the team could see exactly which changes drove which results.
Some teams build this capability in-house, connecting analytics to experimentation frameworks. Others use platforms like Adapty, RevenueCat, or Purchasely. The approach matters less than committing to continuous testing instead of quarterly reviews.
2. Scaling creative testing with AI and automation
The bottleneck in creative testing isn’t production. Most UA teams produce 60-80 new creatives monthly.
The bottleneck is getting them into testing.
We see this pattern constantly: Most UA teams produce 60-80 new creatives monthly. Getting those assets live becomes the bottleneck. The gap comes from manual upload work.
Each creative needs a proper setup in Meta and Google Ads – naming conventions, ad set assignment, budget allocation, and conversion tracking. Five minutes per creative adds up fast. When you’re looking at 60-80 assets, that’s hours of work just to get things live.
So teams prioritize. Test the obvious winners. Skip the experimental stuff. Never find out what they’re missing.
The teams solving this are building automations that connect creative databases (usually Airtable or Google Sheets) to ad accounts using tools like Make or Zapier. When a creative gets marked “Ready to Test,” it goes live automatically with proper tracking and naming.
What this unlocks: everything gets tested. The weird hooks. The unconventional formats. The ideas that would normally get skipped because someone has to manually upload 60 other creatives first. And consistently, teams report that some of their best-performing creatives were the ones that would have been deprioritized in a manual workflow. The winning creative was already made. It just needed a system that didn’t create artificial selection before testing.
Cost to build these automations is typically zero – just the automation platform subscription most teams already have. Time investment: an afternoon for someone who knows Make or Zapier.
Removing friction between production and testing so creative performance, not upload convenience, determines what gets tried.
3. Using AI to analyze creative performance at scale
After running 100+ creative tests, someone has to figure out what worked and why. Which hooks convert? Which formats perform with which audiences? Which creative elements consistently drive lower CPA?
Most teams do this manually – export performance data to a spreadsheet, tag creatives by eye, look for patterns. It takes hours, and you miss things.
We’re seeing teams build systems that connect to their creative databases (usually Airtable), automatically assign tags to each asset (hook type, visual style, audience, format, character), then analyze which combinations perform best.
The system processes every creative test – typically 40-60 per month for active teams – and outputs production briefs for the design team. Instead of: “We need more creatives”, they get: “Creatives featuring [specific visual style] with [specific hook type] targeting [specific audience] are performing significantly better than baseline. Last month’s top performers all used this pattern. Produce more variations, testing different angles within this framework.”
The design team moves from guessing what might work to producing based on patterns across hundreds of tested creatives. Teams report their hit rate – percentage of new creatives that beat control – improves notably once they’re producing from data patterns instead of intuition.
Most teams build this using Make or Zapier to connect their creative database to the Claude API or similar LLM tools, plus their existing Airtable or Google Sheets setup. Implementation typically takes a few days for someone comfortable with automation tools. Time saved: 6-10 hours per week in manual analysis. More importantly, it surfaces insights that get missed when doing it manually.
The creative that’s working might not match your assumptions. You need systems that can spot the pattern across hundreds of data points.
4. AI-powered trend detection for mobile content marketing
Staying on top of viral trends used to mean someone scrolling TikTok, Instagram Reels, and YouTube Shorts for hours trying to spot patterns relevant to your category.
The approach: use tools like Apify to scrape social platforms, connect to the Claude API or similar LLM to analyze viral videos, and set up a weekly automation that delivers a report every Monday morning.
The system identifies videos in their category that are getting unusual engagement, extracts the hook/format/concept, and generates scenarios the video team can adapt.
Instead of: “Let’s brainstorm content ideas”. They get: “This format is trending in your category right now: [specific hook style]. Here are 5-6 scenarios adapted to your app’s use case. These concepts are getting strong engagement across [X] viral videos this week.”
Teams report their organic reach improves when they’re adapting concepts that are already proving viral in their space rather than making educated guesses about what might work.
Here’s the key insight: viral content has a narrow window. By the time you manually spot a trend, research it, and brief your team, the moment’s often passed. Systems that can identify and surface trends automatically let you move at the speed trends actually move.
Cost: around $200/month for Apify, Claude API usage is negligible.
Impact: teams report notable increases in organic installs, which improves blended CAC as paid acquisition gets mixed with stronger organic performance.
The future of AI in mobile growth: What to expect next?
Six months from now, your conversion rate will be higher or it won’t. Your CAC will be lower or it won’t. Your organic reach will be stronger or it won’t.
The apps on the right side of that 74% gap operate differently. They removed the friction between knowing what to do and actually doing it. Testing isn’t a quarterly event. Creative analysis isn’t manual spreadsheet work. Trend research isn’t someone scrolling TikTok for hours. These became systems that run continuously.
Here’s what’s shifting: your three-year-old pricing guess probably isn’t optimal. Your creative backlog has winners you haven’t tested. Viral trends are moving faster than your manual research process. You’ve been optimizing around team capacity instead of revenue opportunity.
These tools make that reality harder to ignore. The gaps become visible. The work gets easier. The question becomes whether you’re willing to act on what you find.
Most teams will read this, nod along, and go back to how things have always been done. The backlog stays full. The gaps stay hidden. Everything feels fine until you see a competitor’s numbers and realize how far ahead they’ve moved.
A few teams will try it. Pick one area. Build the system. Get a win. Expand. Twelve months from now, they’ll be converting 30-40% better with 20-30% lower CAC.
Same team. Same product. Different approach to removing friction from growth work.
The tooling exists. The data is clear. The question: Are you ready to look at the gap?
Want to see where your gaps are? If you’re running a subscription app, you can analyze your pricing in Adapty Autopilot. Connect your data, see what it finds. Worst case: you confirm you’re already optimized.
Or start smaller — build that creative upload automation this afternoon. Set up a trendwatcher for Monday mornings. Pick one test you’ve been putting off and just run it.
Either way, you’ll know.