Quick answer: Weekly subscriptions now capture 47% of all revenue, free trials boost LTV by 64%, and premium pricing consistently outperforms mid-tier options. The $170 billion subscription market rewards flexibility over savings.
The subscription economy is experiencing its biggest transformation yet. After analyzing $1.9 billion in revenue across 11,000+ apps, Adapty has revealed a clear pattern: users are choosing psychological safety over financial savings. This fundamental shift is reshaping everything we thought we knew about subscription pricing, trials, and user behavior.
The new subscription psychology: Why everything changed
The data tells a compelling story. In 2026, subscription success is about offering the safest commitment. Users overwhelmed by subscription fatigue are gravitating toward options that feel less risky, more flexible, and easier to escape.
This psychological shift has created three winning strategies:
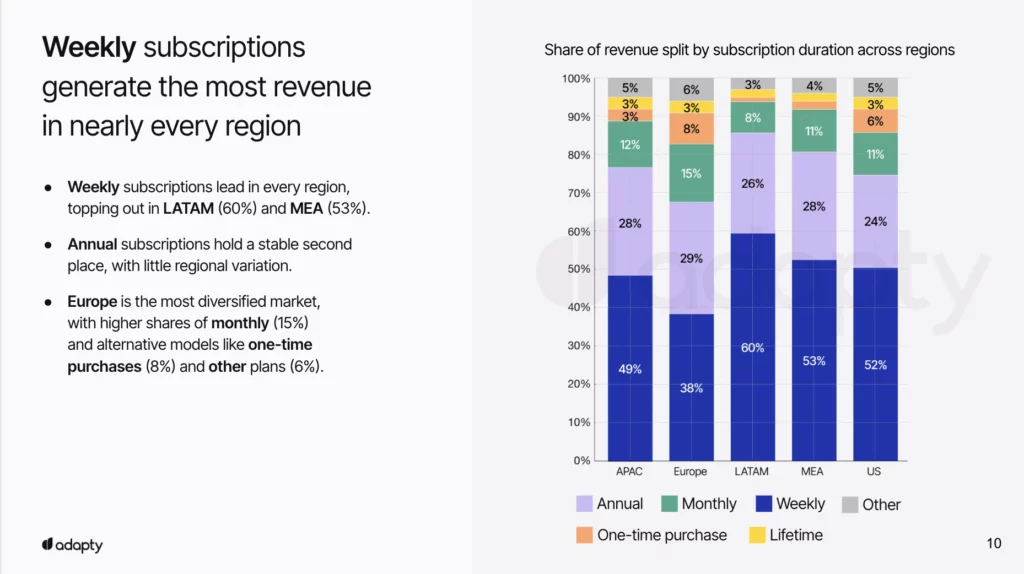
- Flexibility over savings (weekly plans dominating)
- Try-before-you-buy confidence (trials as conversion multipliers)
- Quality over quantity (premium pricing succeeding)
Let’s examine how each trend fits into this new reality.
Trend analysis: The flexibility-first revenue model
The pattern: Users want to test commitment levels gradually, not jump into long-term relationships.
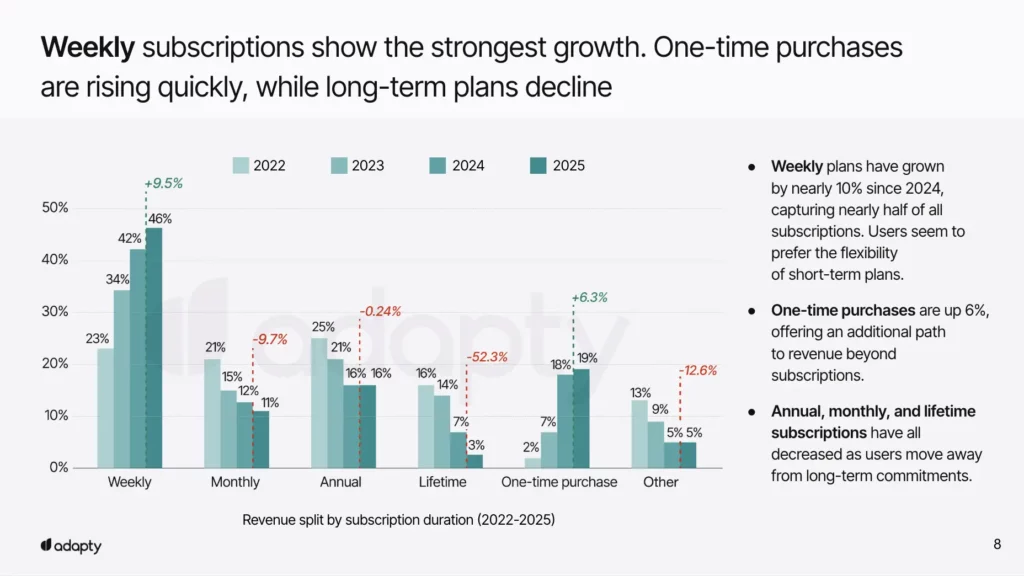
| Subscription type | 2024 revenue | 2025 revenue | Growth |
|---|---|---|---|
| Weekly plans | 42% | 46% | +9.5% |
| Monthly plans | 12% | 11% | -9.7% |
| Annual plans | 16% | 16% | 0% |
| Lifetime plans | 18% | 19% | +6.3% |
The 9 interconnected trends (revenue impact ranked)
1. The weekly revolution: your new conversion foundation
Impact score: 9.5/10 | Strategic priority: Core strategy
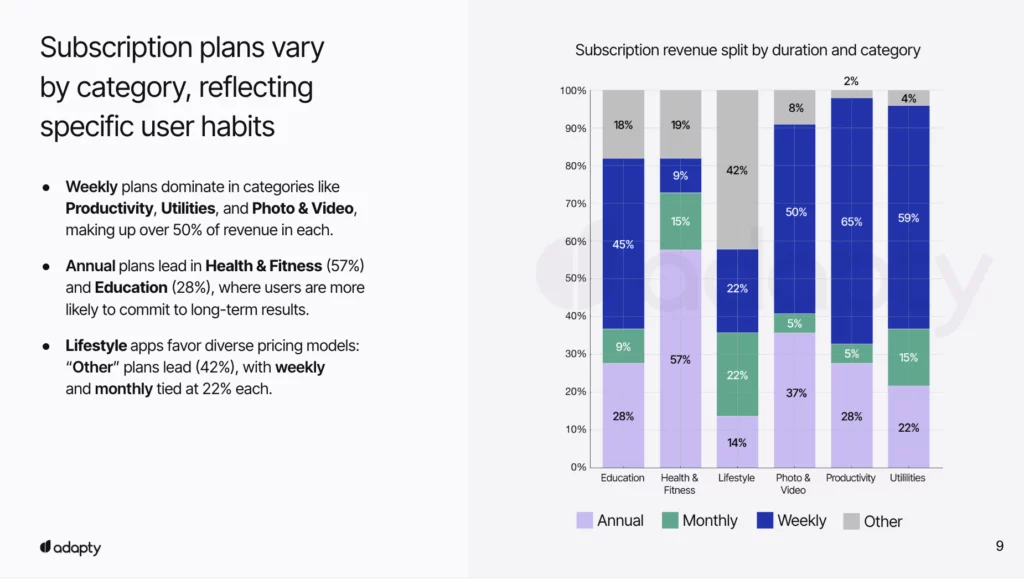
Weekly subscriptions have fundamentally changed the game. By capturing 47% of total revenue, they’ve proven that low commitment beats low prices.
Category dominance:
- Productivity: 65% of revenue (users want to test workflow integration)
- Utilities: 59% of revenue (proving daily value matters)
- Photo & Video: 50% of revenue (creative tools need quick wins)
Weekly plans eliminate the fear of “being stuck” while still generating immediate revenue. They’re essentially extended trials that users pay for.
Strategic implementation:
- Position weekly as your primary CTA – not an alternative.
- Design for quick value demonstration within 7 days.
- Build automatic upsell sequences after positive engagement.
- Use weekly data to optimize longer-term offerings.
2. Free trials: The trust-building revenue multiplier
Impact score: 9.2/10 | Strategic priority: Conversion optimization
Free trials solve the same psychological problem as weekly plans: reducing commitment anxiety. Trials now serve a dual purpose — they convert users AND filter for your highest-value customers.
The compounding effect:
- US: 64% LTV increase (trials attract committed users)
- Europe: 58% LTV increase (cultural preference for testing)
- Retention improvement: 23% → 42% (quality user filtering)
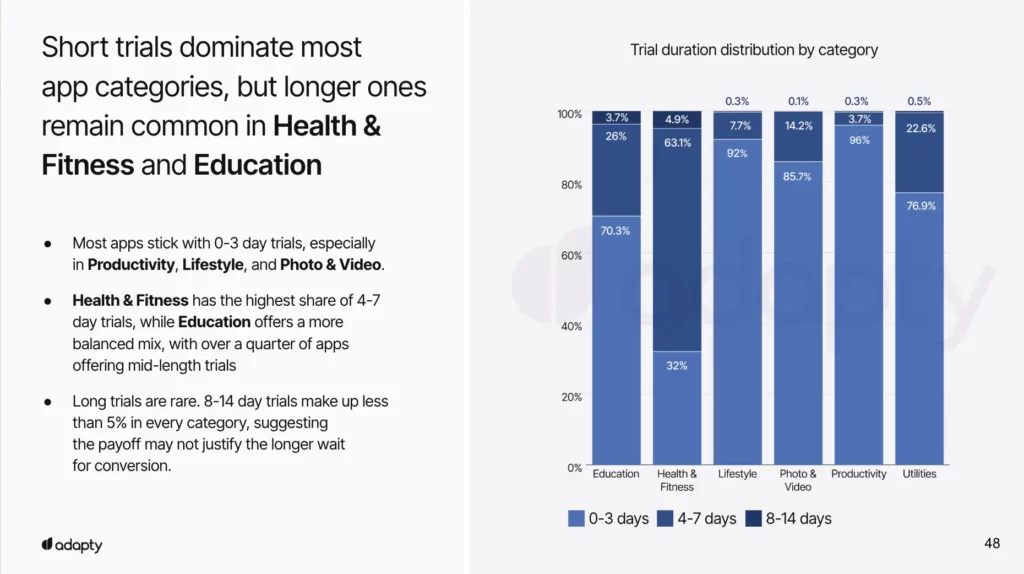
| Category | Trial length | Why this works | Conversion focus |
| Productivity | 0-3 days | Quick workflow integration | Daily habit formation |
| Health & fitness | 4-7 days | Habit establishment cycle | Routine building |
| Education | 0-3 days | Learning curve accommodation | Skill development |
| Photo & video | 0-3 days | Immediate creative output | Quick wins |
Integration with weekly strategy:
Combine 3-day trials with weekly plans for maximum psychological safety: “Try free for 3 days, then just $2.99/week.”
3. Premium pricing: The quality signal that improves economics
Impact score: 8.5/10 | Strategic priority: Revenue optimization
Here’s the counterintuitive truth driving 2025 success: higher prices create better customers. Premium pricing attracts users who value your solution enough to commit, improving both revenue and retention.
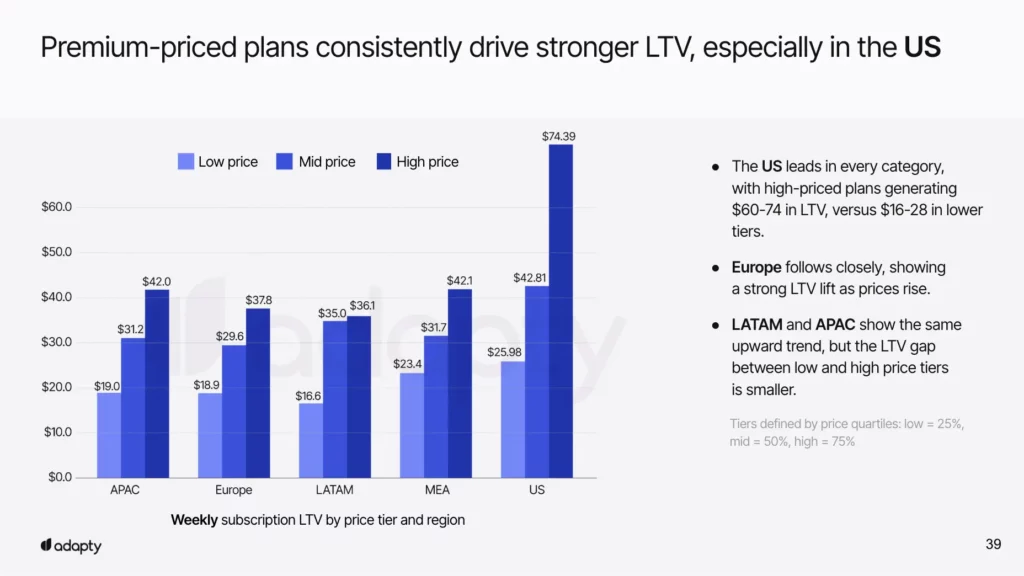
The premium advantage:
- US weekly plans: Premium ($60-74 LTV) vs Low-tier ($16-28 LTV)
- Result: 200-300% higher lifetime value
- Bonus: Lower support costs and higher retention
Users have easy exit options with weekly plans, so price becomes a quality signal rather than a commitment barrier. They’re buying confidence in your solution, not just features.
Connected strategy:
- Use weekly plans to reduce price sensitivity (low commitment).
- Position premium as the “recommended” option.
- Focus value communication on outcomes not features.
- Test 20-30% increases with clear differentiation.
4. Geographic pricing: The hidden revenue multiplier
Impact score: 8.8/10 | Strategic priority: Global expansion
Geographic pricing reveals a crucial insight: willingness to pay varies dramatically by region. While everyone focuses on major markets, the real opportunity lies in understanding value perception differences.
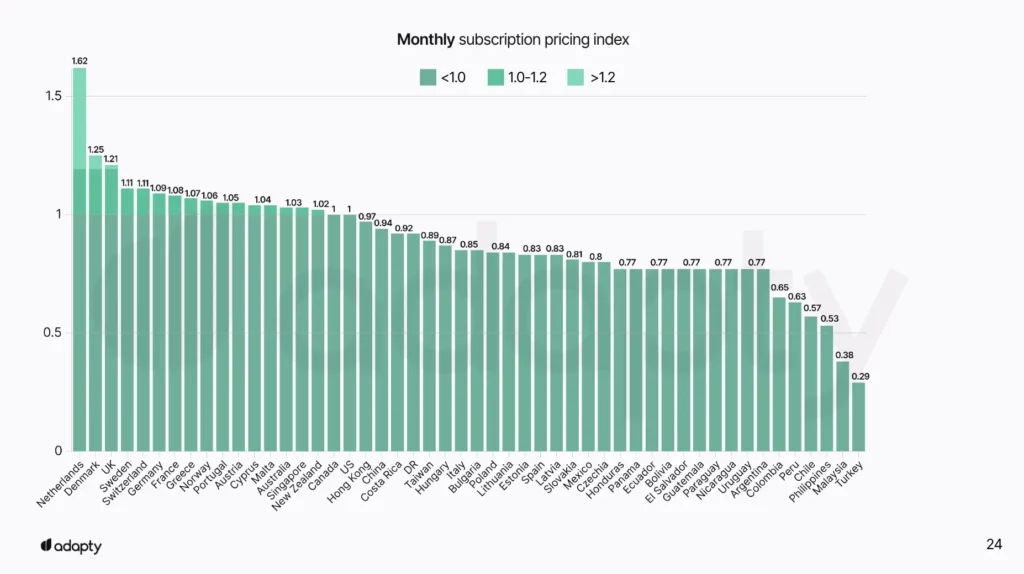
Adapty Pricing Index insights (US = 1.00):
- Netherlands: 1.62 (62% premium) – High productivity value
- Singapore: 1.45 (45% premium) – Business-focused market
- Qatar: 1.38 (38% premium) – Affluent early adopters
- Turkey: 0.29 (71% discount) – Price-sensitive but high volume
Geographic pricing works best when combined with flexible plans. Users in premium markets prefer weekly plans for expensive apps, while price-sensitive markets convert better to annual commitments with discounts.
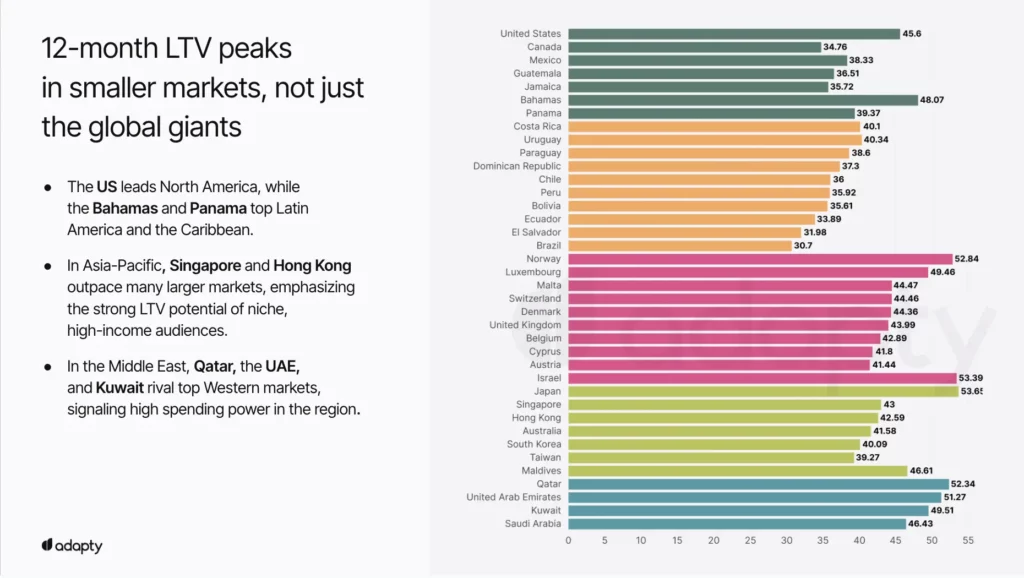
Hidden gem markets (High LTV, low competition):
- UAE
- Bahamas
- Luxembourg
- Singapore
5. The mid-tier elimination strategy
Impact score: 8.0/10 | Strategic priority: Conversion optimization
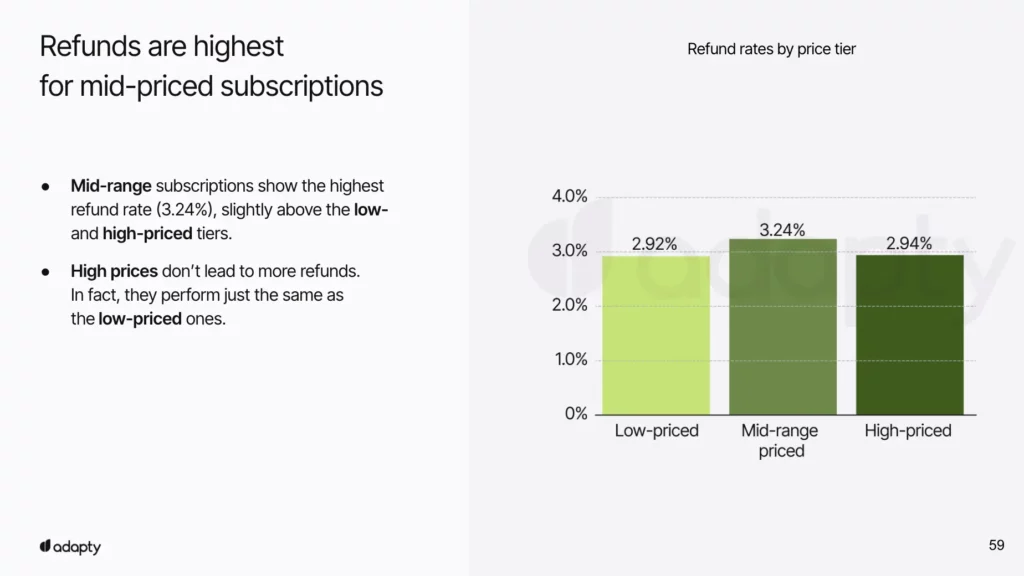
Mid-tier pricing fails because it contradicts the flexibility-first psychology. Users want clear choices, and middle options create decision paralysis.
The problems:
- Highest refund rates: 3.24% (buyer’s remorse)
- Poor retention across all plan types
- Confuses the value narrative
The Solution – Clear value differentiation:
Instead of confusing three-tier systems, focus on obvious feature distinctions:
- Basic plan: Core functionality only
- Premium plan: Full features + exclusive benefits
Keep billing frequency separate from feature tiers. Offer both Basic and Premium at weekly, monthly, and annual intervals. This way users choose features first, then commitment level, eliminating the decision paralysis that mid-tier pricing creates.
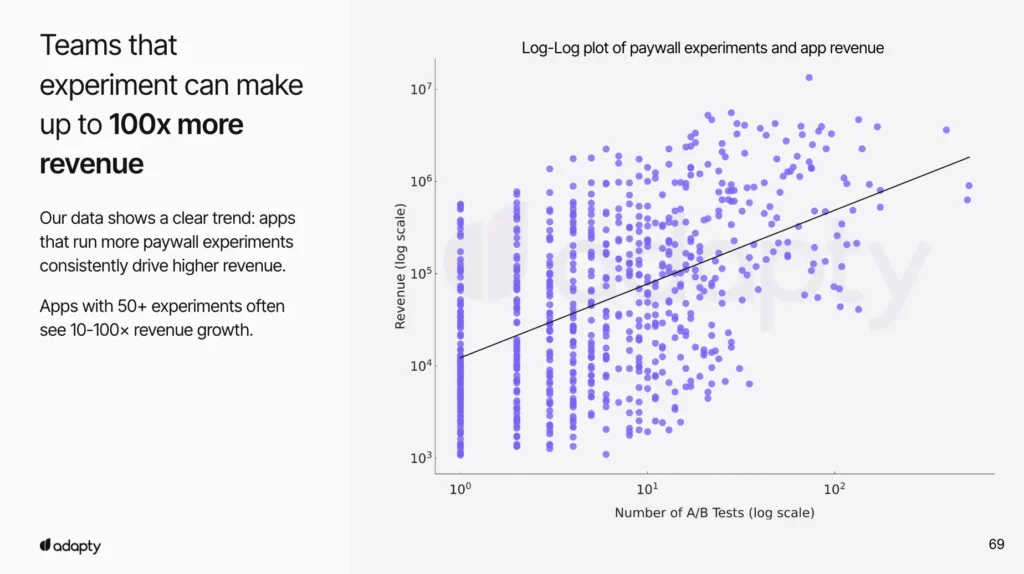
6. Experimentation as your competitive moat
Impact score: 7.8/10 | Strategic priority: Systematic improvement
Apps running 50+ experiments annually see 10-100x revenue growth because experimentation compounds across all trends. Each test improves your understanding of flexibility-first users.
Priority testing framework:
| Test category | CR uplift | LTV uplift | Connection to trends |
|---|---|---|---|
| Trial offers | 66% | 80% | Reduces commitment anxiety |
| Plan duration | 66% | 85% | Optimizes flexibility spectrum |
| Pricing changes | 46% | 73% | Finds premium pricing sweet spot |
| Number of plans | 54% | 58% | Avoids mid-tier confusion |
| Visual changes | 27% | 33% | Improves conversion experience |
The testing sequence for 2026:
- Test trial lengths for your category.
- Experiment with weekly plan positioning.
- Test number of plans (eliminate mid-tier options).
- Try premium pricing variations.
- Optimize visual paywall elements.
7. Global revenue reality: Focus follows revenue
Impact score: 7.5/10 | Strategic priority: market expansion
Current distribution:
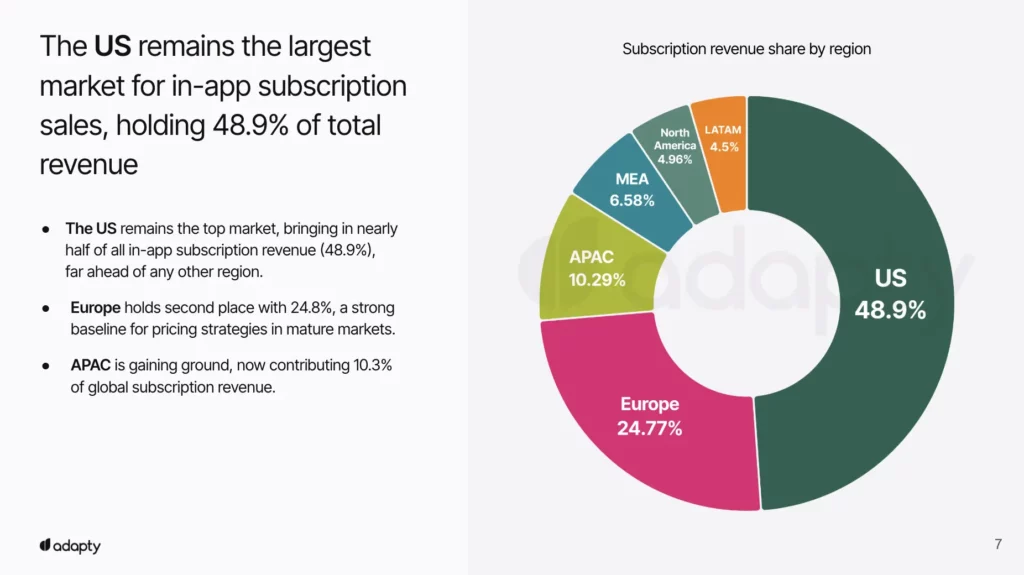
Success in major markets requires mastering flexibility-first psychology, while smaller markets offer premium pricing opportunities with less competition.
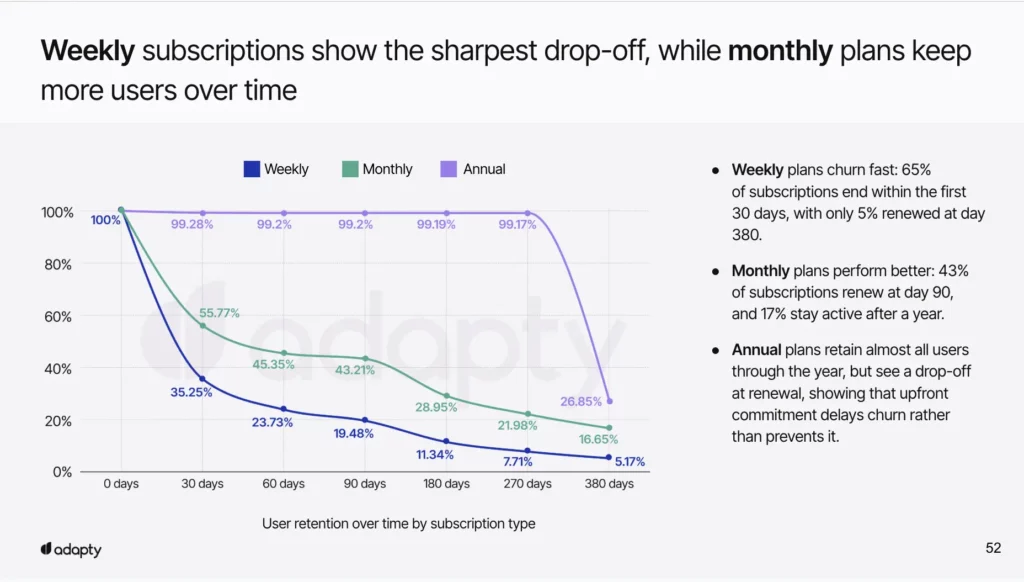
8. Weekly retention challenge: The upselling imperative
Impact score: 7.2/10 | Strategic priority: Retention strategy
Weekly plans have a retention problem: 65% churn by day 30. However, this becomes an advantage when you design for strategic upselling.
The two-phase strategy:
- Phase 1: Use weekly plans for conversion (high acquisition)
- Phase 2: Implement smart upselling to monthly/annual (retention focus)
Upselling triggers:
- Day 14: “You’re getting great value – save 40% with monthly”
- Day 21: “Users like you typically prefer our annual plan”
- Usage milestone: “You’ve used this 20 times – time to upgrade?”
9. One-time purchases: The subscription alternative
Impact score: 6.8/10 | Strategic priority: Market expansion
Growing 6% as subscription fatigue increases, one-time purchases serve as the ultimate flexibility option. They’re perfect for users who reject all recurring commitments.
Strategic integration:
- Offer as fallback when subscription conversion fails
- Use in markets resistant to recurring payments
- Position for users who abandon weekly plans
Bottom line: The flexibility-first future
After analyzing $1.9 billion in subscription data, one thing is crystal clear: 2025 belongs to apps that master psychological safety over financial optimization.
The winning formula isn’t complicated:
- Start with weekly plans to eliminate commitment anxiety
- Use strategic trials to build confidence
- Price premium to attract quality users
- Test everything to optimize for your specific market
But here’s what ties it all together: every successful strategy reduces user risk while maintaining your revenue opportunity. Weekly plans, trials, premium pricing, and geographic optimization all serve the same master, giving users confidence in their decision to subscribe.
The $170 billion opportunity is massive, but it requires thinking differently about subscription psychology. Users don’t want the cheapest option anymore, they want the safest one.
The question isn’t whether you can afford to implement these strategies. It’s whether you can afford to ignore the fundamental shift toward flexibility-first subscription models.